.png)
Protein Ingredients Market by Source and Application - Global Industry Analysis and Forecast to 2027
Published On : May 2022 Pages : 100 Category: Food and Beverages Report Code : FB0640
SEGMENTS & REGIONS:
- Regions: North America, Europe, Asia- Pacific, Latin America, Middle East & Africa
Industry Trend Analysis
The protein ingredients market is expected to be around $59 billion by 2027. This is primarily attributed to the scientific evidences to support health benefits of protein, rising consumer awareness about dietary supplements and functional foods, and advancements in protein extraction techniques. Human body cannot produce vital amino acids which are needed for healing of cells. Therefore, it is very important to consume these proteins through diet. These proteins can be obtained from plants or animals. Additionally, growing demand for these proteins in industries such as food & beverages, pharmaceuticals, and animal feeds is one of the major factors contributing to the market growth.
Product Outlook and Trend Analysis
Animal proteins segment accounted for the largest share of the overall market in 2017 and is projected to be the fastest growing segment over the forecast period. This is attributed to wide usage of animal sources for deriving protein ingredients as they have better nutritional profile when compared to plants proteins.
Application Outlook and Trend Analysis
Protein ingredients are widely used in food & beverages industry, due to increase in demand for functional foods in developed nations. Infant formulations was the second largest segment in the protein ingredients market in 2017; while cosmetics & personal care segment is expected to witness high growth during the forecast period.
Regional Outlook and Trend Analysis
North America dominated the overall market in 2017, due to growing consumer awareness, increased demand for functional foods with growing use of protein ingredients in cosmetics and food & beverages industries. Asia-Pacific is projected to be fastest growing region during the forecast period. This is attributed to a large number of factors such as huge patient population, increasing disposable income to spend on functional foods, and improving healthcare and cosmetic industries in Japan, China, and South Korea.
Competitive Analysis
The major players in the market are Cargill, Archer Daniels Midland Company (ADM), E. I. du Pont de Nemours and Company, Kerry Group plc, and Omega Protein Corporation. Other players studied include Fonterra Co-operative Group Ltd., Arla Foods, Kewpie Corporation, AMCO Proteins, GELITA AG, and Hilmar Ingredients. Major strategies adopted by them to sustain the market competition are increasing R&D spending with the aim of introducing new products in the market and strengthening their presence in Asia-Pacific.
Market Opportunities
Launch of new products containing low fat content and cholesterol free beverages will be key factors for growth of global market. These functional foods play beneficial roles in certain disease especially gastrointestinal diseases by exerting positive impact on gut flora besides improving overall health of individual which will increase demand for such products. Increase in demand for protein based drinks in countries such as U.S. and Europe will enable manufacturers to expand beyond traditional soy based drinks.
Protein Ingredients Market Segmentation
By Source:
- Plant Proteins
- Pea
- Textured Soy Protein
- Wheat
- Soy Protein Concentrates
- Soy Protein Isolates
- Canola
- Others
- Animal Proteins
- Whey Protein Concentrates
- Whey Protein Hydrolysates
- Whey Protein Isolates
- Egg Proteins
- Milk Protein Concentrates/Isolates
- Gelatin
- Casein/Caseinates
By Application:
- Cosmetics & Personal Care
- Infant Formulations
- Food & Beverages
- Animal Feeds
By Region:
- North America
- U.S
- Canada
- Mexico
- Europe
- Germany
- France
- UK
- Italy
- Spain
- Rest of Europe
- Asia-Pacific
- Japan
- China
- Australia
- India
- South Korea
- Rest of Asia-Pacific
- Rest of the World
- Brazil
- South Africa
- Saudi Arabia
- Turkey
- United Arab Emirates
- Others
Some of the key questions answered by the report are:
- What was the market size in 2017 and forecast from 2022 to 2027?
- What will be the industry market growth from 2022 to 2027?
- What are the major drivers, restraints, opportunities, challenges, and industry trends and their impact on the market forecast?
- What are the major segments leading the market growth and why?
- Which are the leading players in the market and what are the major strategies adopted by them to sustain the market competition?
Market Classification
- Protein Ingredients Market, By Source, Estimates and Forecast, 2017-2027 ($Million)
- Plant Proteins
- Wheat
- Soy Protein Concentrates
- Soy Protein Isolates
- Textured Soy Protein
- Pea
- Canola
- Others
- Animal Proteins
- Egg proteins
- Milk Protein Concentrates/Isolates
- Whey Protein Concentrates
- Whey Protein Hydrolysates
- Whey Protein Isolates
- Gelatin
- Casein/Caseinates
- Protein Ingredients Market, By Application, Estimates and Forecast, 2017-2027 ($Million)
- Food & Beverages
- Cosmetics & Personal Care
- Infant Formulations
- Animal Feeds
- Protein Ingredients Market, By Region, Estimates and Forecast, 2017-2027 ($Million)
- North America
- North America Protein Ingredients Market, By Country
- North America Protein Ingredients Market, By Source
- North America Protein Ingredients Market, By Application
- U.S. Protein Ingredients Market, By Source
- U.S. Protein Ingredients Market, By Application
- Canada Protein Ingredients Market, By Source
- Canada Protein Ingredients Market, By Application
- Mexico Protein Ingredients Market, By Source
- Mexico Protein Ingredients Market, By Application
-
- Europe
- Europe Protein Ingredients Market, By Country
- Europe Protein Ingredients Market, By Source
- Europe Protein Ingredients Market, By Application
- Germany Protein Ingredients Market, By Source
- Germany Protein Ingredients Market, By Application
- France Protein Ingredients Market, By Source
- France Protein Ingredients Market, By Application
- UK Protein Ingredients Market, By Source
- UK Protein Ingredients Market, By Application
- Italy Protein Ingredients Market, By Source
- Italy Protein Ingredients Market, By Application
- Spain Protein Ingredients Market, By Source
- Spain Protein Ingredients Market, By Application
- Rest of Europe Protein Ingredients Market, By Source
- Rest of Europe Protein Ingredients Market, By Application
-
- Asia-Pacific
- Asia-Pacific Protein Ingredients Market, By Country
- Asia-Pacific Protein Ingredients Market, By Source
- Asia-Pacific Protein Ingredients Market, By Application
- Japan Protein Ingredients Market, By Source
- Japan Protein Ingredients Market, By Application
- Australia Protein Ingredients Market, By Source
- Australia Protein Ingredients Market, By Application
- India Protein Ingredients Market, By Source
- India Protein Ingredients Market, By Application
- South Korea Protein Ingredients Market, By Source
- South Korea Protein Ingredients Market, By Application
- Rest of Asia-Pacific Protein Ingredients Market, By Source
- Rest of Asia-Pacific Protein Ingredients Market, By Application
- Asia-Pacific
-
- Rest of the World
- Rest of the World Protein Ingredients Market, By Country
- Rest of the World Protein Ingredients Market, By Source
- Rest of the World Protein Ingredients Market, By Application
- Brazil Protein Ingredients Market, By Source
- Brazil Protein Ingredients Market, By Application
- South Africa Protein Ingredients Market, By Source
- South Africa Protein Ingredients Market, By Application
- Saudi Arabia Protein Ingredients Market, By Source
- Saudi Arabia Protein Ingredients Market, By Application
- Turkey Protein Ingredients Market, By Source
- Turkey Protein Ingredients Market, By Application
- United Arab Emirates Protein Ingredients Market, By Source
- United Arab Emirates Protein Ingredients Market, By Application
- Other Protein Ingredients Market, By Source
- Other Protein Ingredients Market, By Application
- Rest of the World
Table of Contents
1. Introduction
1.1. Report Description
1.2. Research Methodology
1.2.1. Secondary Research
1.2.2. Primary Research
2. Executive Summary
2.1. Key Highlights
3. Market Overview
3.1. Introduction
3.1.1. Market Definition
3.1.2. Market Segmentation
3.2. Market Share Analysis
3.3. Market Dynamics
3.3.1. Drivers
3.3.1.1. Scientific Evidence Supporting Health Benefits of Proteins
3.3.1.2. Rising Consumer Awareness Especially Regarding Dietary Supplements and Functional Foods
3.3.2. Restraints
3.3.2.1. Imbalance in Supply and Fluctuations in Prices of Ingredients
3.3.3. Opportunities
3.3.3.1. Launch of New Products Containing Low Fat Content and Cholesterol Free Beverages
3.4. Industry Trends
4. Protein Ingredients Market, By Source
4.1. Introduction
4.2. The Protein Ingredients Market Assessment and Forecast, By Source, 2017-2027
4.3. Plant Proteins
4.3.1. Global Market Assessment and Forecast, By Type, 2017-2027 ($Million)
4.3.2. Market Assessment and Forecast, By Region, 2017-2027 ($Million)
4.3.3. Wheat
4.3.3.1. Market Assessment and Forecast, By Region, 2017-2027 ($Million)
4.3.4. Soy Protein Concentrates
4.3.4.1. Market Assessment and Forecast, By Region, 2017-2027 ($Million)
4.3.5. Soy Protein Isolates
4.3.5.1. Market Assessment and Forecast, By Region, 2017-2027 ($Million)
4.3.6. Textured Soy Protein
4.3.6.1. Market Assessment and Forecast, By Region, 2017-2027 ($Million)
4.3.7. Pea
4.3.7.1. Market Assessment and Forecast, By Region, 2017-2027 ($Million)
4.3.8. Canola
4.3.8.1. Market Assessment and Forecast, By Region, 2017-2027 ($Million)
4.3.9. Other Sources
4.3.9.1. Market Assessment and Forecast, By Region, 2017-2027 ($Million)
4.4. Animal Proteins
4.4.1. Global Market Assessment and Forecast, By Type, 2017-2027 ($Million)
4.4.2. Market Assessment and Forecast, By Region, 2017-2027 ($Million)
4.4.3. Egg Proteins
4.4.3.1. Market Assessment and Forecast, By Region, 2017-2027 ($Million)
4.4.4. Milk Protein Concentrates/Isolates
4.4.4.1. Market Assessment and Forecast, By Region, 2017-2027 ($Million)
4.4.5. Whey Protein Concentrates
4.4.5.1. Market Assessment and Forecast, By Region, 2017-2027 ($Million)
4.4.6. Whey Protein Hydrolysates
4.4.6.1. Market Assessment and Forecast, By Region, 2017-2027 ($Million)
4.4.7. Whey Protein Isolates
4.4.7.1. Market Assessment and Forecast, By Region, 2017-2027 ($Million)
4.4.8. Gelatin
4.4.8.1. Market Assessment and Forecast, By Region, 2017-2027 ($Million)
4.4.9. Casein/Caseinates
4.4.9.1. Market Assessment and Forecast, By Region, 2017-2027 ($Million)
5. Protein Ingredients Market, By Application
5.1. Introduction
5.2. The Protein Ingredients Market Assessment and Forecast, By Application, 2017-2027
5.2.1. Food & Beverages
5.2.1.1. Market Assessment and Forecast, By Region, 2017-2027 ($Million)
5.2.2. Cosmetics & Personal Care
5.2.2.1. Market Assessment and Forecast, By Region, 2017-2027 ($Million)
5.2.3. Infant Formulations
5.2.3.1. Market Assessment and Forecast, By Region, 2017-2027 ($Million)
5.2.4. Animal Feeds
5.2.4.1. Market Assessment and Forecast, By Region, 2017-2027 ($Million)
6. Protein Ingredients Market, By Region
6.1. Introduction
6.2. Protein Ingredients Market Assessment and Forecast, By Region, 2017-2027 ($Million)
6.3. North America
6.3.1. Market Assessment and Forecast, By Country, 2017-2027 ($Million)
6.3.2. Market Assessment and Forecast, By Source, 2017-2027 ($Million)
6.3.3. Market Assessment and Forecast, By Application, 2017-2027 ($Million)
6.3.3.1. U.S.
6.3.3.1.1. Market Assessment and Forecast, By Source, 2017-2027 ($Million)
6.3.3.1.2. Market Assessment and Forecast, By Application, 2017-2027 ($Million)
6.3.3.2. Canada
6.3.3.2.1. Market Assessment and Forecast, By Source, 2017-2027 ($Million)
6.3.3.2.2. Market Assessment and Forecast, By Application, 2017-2027 ($Million)
6.3.3.3. Mexico
6.3.3.3.1. Market Assessment and Forecast, By Source, 2017-2027 ($Million)
6.3.3.3.2. Market Assessment and Forecast, By Application, 2017-2027 ($Million)
6.4. Europe
6.4.1. Market Assessment and Forecast, By Country, 2017-2027 ($Million)
6.4.2. Market Assessment and Forecast, By Source, 2017-2027 ($Million)
6.4.3. Market Assessment and Forecast, By Application, 2017-2027 ($Million)
6.4.3.1. Germany
6.4.3.1.1. Market Assessment and Forecast, By Source, 2017-2027 ($Million)
6.4.3.1.2. Market Assessment and Forecast, By Application, 2017-2027 ($Million)
6.4.3.2. France
6.4.3.2.1. Market Assessment and Forecast, By Source, 2017-2027 ($Million)
6.4.3.2.2. Market Assessment and Forecast, By Source, 2017-2027 ($Million)
6.4.3.3. UK
6.4.3.3.1. Market Assessment and Forecast, By Source, 2017-2027 ($Million)
6.4.3.3.2. Market Assessment and Forecast, By Application, 2017-2027 ($Million)
6.4.3.4. Italy
6.4.3.4.1. Market Assessment and Forecast, By Source, 2017-2027 ($Million)
6.4.3.4.2. Market Assessment and Forecast, By Application, 2017-2027 ($Million)
6.4.3.5. Spain
6.4.3.5.1. Market Assessment and Forecast, By Source, 2017-2027 ($Million)
6.4.3.5.2. Market Assessment and Forecast, By Application, 2017-2027 ($Million)
6.4.3.6. Russia
6.4.3.6.1. Market Assessment and Forecast, By Source, 2017-2027 ($Million)
6.4.3.6.2. Market Assessment and Forecast, By Application, 2017-2027 ($Million)
6.4.3.7. Rest of Europe
6.4.3.7.1. Market Assessment and Forecast, By Source, 2017-2027 ($Million)
6.4.3.7.2. Market Assessment and Forecast, By Application, 2017-2027 ($Million)
6.5. Asia-Pacific
6.5.1. Market Assessment and Forecast, By Country, 2017-2027 ($Million)
6.5.2. Market Assessment and Forecast, By Source, 2017-2027 ($Million)
6.5.3. Market Assessment and Forecast, By Application, 2017-2027 ($Million)
6.5.3.1. Japan
6.5.3.1.1. Market Assessment and Forecast, By Source, 2017-2027 ($Million)
6.5.3.1.2. Market Assessment and Forecast, By Application, 2017-2027 ($Million)
6.5.3.2. China
6.5.3.2.1. Market Assessment and Forecast, By Source, 2017-2027 ($Million)
6.5.3.2.2. Market Assessment and Forecast, By Application, 2017-2027 ($Million)
6.5.3.3. Australia
6.5.3.3.1. Market Assessment and Forecast, By Source, 2017-2027 ($Million)
6.5.3.3.2. Market Assessment and Forecast, By Application, 2017-2027 ($Million)
6.5.3.4. India
6.5.3.4.1. Market Assessment and Forecast, By Source, 2017-2027 ($Million)
6.5.3.4.2. Market Assessment and Forecast, By Application, 2017-2027 ($Million)
6.5.3.5. South Korea
6.5.3.5.1. Market Assessment and Forecast, By Source, 2017-2027 ($Million)
6.5.3.5.2. Market Assessment and Forecast, By Application, 2017-2027 ($Million)
6.5.3.6. Taiwan
6.5.3.6.1. Market Assessment and Forecast, By Source, 2017-2027 ($Million)
6.5.3.6.2. Market Assessment and Forecast, By Application, 2017-2027 ($Million)
6.5.3.7. Rest of Asia-Pacific
6.5.3.7.1. Market Assessment and Forecast, By Source, 2017-2027 ($Million)
6.5.3.7.2. Market Assessment and Forecast, By Application, 2017-2027 ($Million)
6.6. Rest of the World
6.6.1. Market Assessment and Forecast, By Country, 2017-2027 ($Million)
6.6.2. Market Assessment and Forecast, By Source, 2017-2027 ($Million)
6.6.3. Market Assessment and Forecast, By Application, 2017-2027 ($Million)
6.6.3.1. Brazil
6.6.3.1.1. Market Assessment and Forecast, By Source, 2017-2027 ($Million)
6.6.3.1.2. Market Assessment and Forecast, By Application, 2017-2027 ($Million)
6.6.3.2. Turkey
6.6.3.2.1. Market Assessment and Forecast, By Source, 2017-2027 ($Million)
6.6.3.2.2. Market Assessment and Forecast, By Application, 2017-2027 ($Million)
6.6.3.3. Saudi Arabia
6.6.3.3.1. Market Assessment and Forecast, By Source, 2017-2027 ($Million)
6.6.3.3.2. Market Assessment and Forecast, By Application, 2017-2027 ($Million)
6.6.3.4. South Africa
6.6.3.4.1. Market Assessment and Forecast, By Source, 2017-2027 ($Million)
6.6.3.4.2. Market Assessment and Forecast, By Application, 2017-2027 ($Million)
6.6.3.5. United Arab Emirates
6.6.3.5.1. Market Assessment and Forecast, By Source, 2017-2027 ($Million)
6.6.3.5.2. Market Assessment and Forecast, By Application, 2017-2027 ($Million)
6.6.3.6. Others
6.6.3.6.1. Market Assessment and Forecast, By Source, 2017-2027 ($Million)
6.6.3.6.2. Market Assessment and Forecast, By Application, 2017-2027 ($Million)
7. Company Profiles
7.1. Cargill
7.1.1. Business Overview
7.1.2. Product Portfolio
7.1.3. Key Financials
7.1.4. Strategic Developments
7.2. Archer Daniels Midland Company
7.2.1. Business Overview
7.2.2. Product Portfolio
7.2.3. Key Financials
7.2.4. Strategic Developments
7.3. E. I. du Pont de Nemours and Company
7.3.1. Business Overview
7.3.2. Product Portfolio
7.3.3. Key Financials
7.3.4. Strategic Developments
7.4. Kerry Group Plc
7.4.1. Business Overview
7.4.2. Product Portfolio
7.4.3. Key Financials
7.4.4. Strategic Developments
7.5. Omega Protein Corporation
7.5.1. Business Overview
7.5.2. Product Portfolio
7.5.3. Key Financials
7.5.4. Strategic Developments
7.6. Fonterra Co-operative Group Ltd.
7.6.1. Business Overview
7.6.2. Product Portfolio
7.6.3. Key Financials
7.6.4. Strategic Developments
7.7. Arla Foods
7.7.1. Business Overview
7.7.2. Product Portfolio
7.7.3. Key Financials
7.7.4. Strategic Developments
7.8. Kewpie Corporation
7.8.1. Business Overview
7.8.2. Product Portfolio
7.8.3. Key Financials
7.8.4. Strategic Developments
7.9. AMCO Proteins
7.9.1. Business Overview
7.9.2. Product Portfolio
7.9.3. Strategic Developments
7.10. GELITA AG
7.10.1. Business Overview
7.10.2. Product Portfolio
7.10.3. Key Financials
7.10.4. Strategic Developments
7.11. Hilmar Ingredients
7.11.1. Business Overview
7.11.2. Product Portfolio
7.11.3. Strategic Developments
List of Tables
Table 1.Global Protein Ingredients Market, By Source ($Million), 2017-2025
Table 2.Plant Proteins Market, By Type ($Million), 2017-2025
Table 2.Plant Proteins Market, By Region ($Million), 2017-2025
Table 3.Wheat Market, By Region ($Million), 2017-2025
Table 4.Soy Protein Concentrates Market, By Region ($Million), 2017-2025
Table 5.Soy Protein Isolates Market, By Region ($Million), 2017-2025
Table 6.Textured Soy Protein Market, By Region ($Million), 2017-2025
Table 7.Pea Market, By Region ($Million), 2017-2025
Table 8.Canola Market, By Region ($Million), 2017-2025
Table 9.Other Plant Protein Sources Market, By Region ($Million), 2017-2025
Table 10.Animal Proteins Market, By Type ($Million), 2017-2025
Table 11.Animal Proteins Market, By Region ($Million), 2017-2025
Table 12.Egg Proteins Market, By Region ($Million), 2017-2025
Table 13.Milk Protein Concentrates/Isolates Market, By Region ($Million), 2017-2025
Table 14.Whey Protein Concentrates Market, By Region ($Million), 2017-2025
Table 15.Whey Protein Hydrolysates Market, By Region ($Million), 2017-2025
Table 16.Whey Protein Isolates Market, By Region ($Million), 2017-2025
Table 17.Gelatin Market, By Application ($Million), 2017-2025
Table 18.Casein/Caseinates Market, By Region, 2017-2025 ($Million)
Table 19.Casein/Caseinates Market, By Region, 2017-2025 ($Million)
Table 20.Global Protein Ingredients Market, By Application ($Million), 2017-2025
Table 21.Food & Beverage Market, By Region, 2017-2025 ($Million)
Table 22.Cosmetics & Personal Care Market, By Region, 2017-2025 ($Million)
Table 23.Infant Formulations Market, By Region, 2017-2025 ($Million)
Table 24.Animal Feeds Market, By Region, 2017-2025 ($Million)
Table 25.Protein Ingredients Market, By Region, 2017-2025 ($Million)
Table 26.North America Protein Ingredients Market, By Country, 2017-2025 ($Million)
Table 27.North America Protein Ingredients Market, By Source, 2017-2025 ($Million)
Table 28.North America Protein Ingredients Market, By Application, 2017-2025 ($Million)
Table 29.U.S. Protein Ingredients Market, by Source, 2017-2025 ($Million)
Table 30.U.S. Protein Ingredients Market, by Application, 2017-2025 ($Million)
Table 31.Canada Protein Ingredients Market, By Source, 2017-2025 ($Million)
Table 32.Canada Protein Ingredients Market, By Application, 2017-2025 ($Million)
Table 33.Mexico Protein Ingredients Market, By Source, 2017-2025 ($Million)
Table 34.Mexico Protein Ingredients Market, By Application, 2017-2025 ($Million)
Table 35.Europe Protein Ingredients Market, By Country, 2017-2025 ($Million)
Table 35.Europe Protein Ingredients Market, By Source, 2017-2025 ($Million)
Table 36.Europe Protein Ingredients Market, By Application, 2017-2025 ($Million)
Table37.Germany Protein Ingredients Market, By Source, 2017-2025 ($Million)
Table 38.Germany Protein Ingredients Market, By Application, 2017-2025 ($Million)
Table 39.France Protein Ingredients Market, By Source, 2017-2025 ($Million)
Table 40.France Protein Ingredients Market, By Application, 2017-2025 ($Million)
Table 41.UK Protein Ingredients Market, By Source, 2017-2025 ($Million)
Table 42.UK Protein Ingredients Market, By Application, 2017-2025 ($Million)
Table 43.Italy Protein Ingredients Market, By Source, 2017-2025 ($Million)
Table 44.Italy Protein Ingredients Market, By Application, 2017-2025 ($Million)
Table 45.Spain Protein Ingredients Market, By Source, 2017-2025 ($Million)
Table 46.Spain Protein Ingredients Market, By Application, 2017-2025 ($Million)
Table 47.Russia Protein Ingredients Market, By Source, 2017-2025 ($Million)
Table 48.Russia Protein Ingredients Market, By Application, 2017-2025 ($Million)
Table 49.Rest of Europe Protein Ingredients Market, By Source, 2017-2025 ($Million)
Table 50.Rest of Europe Protein Ingredients Market, By Application, 2017-2025 ($Million)
Table 51.Asia-Pacific Protein Ingredients Market, By Country, 2017-2025 ($Million)
Table 52.Asia-Pacific Protein Ingredients Market, By Source, 2017-2025 ($Million)
Table 53.Asia-Pacific Protein Ingredients Market, By Application, 2017-2025 ($Million)
Table 54.Japan Protein Ingredients Market, By Source, 2017-2025 ($Million)
Table 55.Japan Protein Ingredients Market, By Application, 2017-2025 ($Million)
Table 56.China Protein Ingredients Market, By Source, 2017-2025 ($Million)
Table 57.China Protein Ingredients Market, By Application, 2017-2025 ($Million)
Table 58.Australia Protein Ingredients Market, By Source, 2017-2025 ($Million)
Table 59.Australia Protein Ingredients Market, By Application, 2017-2025 ($Million)
Table 60.India Protein Ingredients Market, By Source, 2017-2025 ($Million)
Table 61.India Protein Ingredients Market, By Application, 2017-2025 ($Million)
Table 62.South Korea Protein Ingredients Market, By Source, 2017-2025 ($Million)
Table 63.South Korea Protein Ingredients Market, By Application, 2017-2025 ($Million)
Table 64.Taiwan Protein Ingredients Market, By Source, 2017-2025 ($Million)
Table 65.Taiwan Protein Ingredients Market, By Application, 2017-2025 ($Million)
Table 66.Rest of Asia-Pacific Protein Ingredients Market, By Source, 2017-2025 ($Million)
Table 67.Rest of Asia-Pacific Protein Ingredients Market, By Application, 2017-2025 ($Million)
Table 68.Rest of the World Protein Ingredients Market, By Country, 2017-2025 ($Million)
Table 69.Rest of the World Protein Ingredients Market, By Source, 2017-2025 ($Million)
Table 70.Rest of the World Protein Ingredients Market, By Application, 2017-2025 ($Million)
Table 71.Brazil Protein Ingredients Market, By Source, 2017-2025 ($Million)
Table 72.Brazil Protein Ingredients Market, By Application, 2017-2025 ($Million)
Table 73.Turkey Protein Ingredients Market, By Source, 2017-2025 ($Million)
Table 74.Turkey Protein Ingredients Market, By Application, 2017-2025 ($Million)
Table 75.Saudi Arabia Protein Ingredients Market, By Source, 2017-2025 ($Million)
Table 76.Saudi Arabia Protein Ingredients Market, By Application, 2017-2025 ($Million)
Table 77.South Africa Protein Ingredients Market, By Source, 2017-2025 ($Million)
Table 78.South Africa Protein Ingredients Market, By Application, 2017-2025 ($Million)
Table 79.United Arab Emirates Protein Ingredients Market, By Source, 2017-2025 ($Million)
Table 80.United Arab Emirates Protein Ingredients Market, By Application, 2017-2025 ($Million)
Table 81.Other Protein Ingredients Market, By Source, 2017-2025 ($Million)
Table 82.Other Protein Ingredients Market, By Application, 2017-2025 ($Million)
Table 83.Cargill: Key Strategic Developments, 2017-2017
Table 84.Archer Daniels Midland Company (ADM): Key Strategic Developments, 2017-2017
Table 85.E. I. du Pont de Nemours and Company: Key Strategic Developments, 2017-2017
Table 86.Kerry Group Plc: Key Strategic Developments, 2017-2017
Table 87.Omega Protein Corporation: Key Strategic Developments, 2017-2017
Table 88.Fonterra Co-operative Group Ltd.: Key Strategic Developments, 2017-2017
Table 89.Arla Foods: Key Strategic Developments, 2017-2017
Table 90.Kewpie Corporation: Key Strategic Developments, 2017-2017
Table 91.AMCO Proteins Key Strategic Developments, 2017-2017
Table 92.GELITA AG: Key Strategic Developments, 2017-2017
Table 93.Hilmar Ingredients: Key Strategic Developments, 2017-2017
List of Figures
Figure 1.Global Protein Ingredients Market Share, By Source, 2017 & 2025
Figure 2.Protein Ingredients Market, By Application, 2017, ($Million)
Figure 3.Protein Ingredients Market, By Region, 2017, ($Million)
Figure 4.Cargill: Net Revenues, 2017-2017 ($Million)
Figure 5.Cargill: Net Revenue Share, By Segment, 2017
Figure 6.Cargill: Net Revenue Share, By Geography, 2017
Figure 7.Archer Daniels Midland Company: Net Revenues, 2017-2017 ($Million)
Figure 8.Archer Daniels Midland Company: Net Revenue Share, By Segment, 2017
Figure 9.Archer Daniels Midland Company: Net Revenue Share, By Geography, 2017
Figure 10.E. I. du Pont de Nemours and Company: Net Revenues, 2017-2017 ($Million)
Figure 11.E. I. du Pont de Nemours and Company: Net Revenue Share, By Segment, 2017
Figure 12.E. I. du Pont de Nemours and Company: Net Revenue Share, By Geography, 2017
Figure 13.Kerry Group: Net Revenues, 2017-2017 ($Million)
Figure 14.Kerry Group: Net Revenue Share, By Segment, 2017
Figure 15.Kerry Group: Net Revenue Share, By Geography, 2017
Figure 16.Omega Protein Corporation: Net Revenues, 2017-2017 ($Million)
Figure 17.Omega Protein Corporation: Net Revenue Share, By Segment, 2017
Figure 18.Omega Protein Corporation: Net Revenue Share, By Geography, 2017
Figure 19.Fonterra Co-operative Group Ltd: Net Revenues, 2017-2017 ($Million)
Figure 20.Fonterra Co-operative Group Ltd: Net Revenue Share, By Segment, 2017
Figure 21.Fonterra Co-operative Group Ltd: Net Revenue Share, By Geography, 2017
Figure 22.Arla Foods: Net Revenues, 2017-2017 ($Million)
Figure 23.Arla Foods: Net Revenue Share, By Segment, 2017
Figure 24.Arla Foods: Net Revenue Share, By Geography, 2017
Figure 25.Kewpie Corporation: Net Revenues, 2017-2017 ($Million)
Figure 26.Kewpie Corporation: Net Revenue Share, By Segment, 2017
Figure 27.Kewpie Corporation: Net Revenue Share, By Geography, 2017
Figure 28.AMCO Proteins: Net Revenues, 2017-2017 ($Million)
Figure 29.AMCO Proteins: Net Revenue Share, By Segment, 2017
Figure 30.AMCO Proteins: Net Revenue Share, By Geography, 2017
Figure 31.GELITA AG: Net Revenues, 2017-2017 ($Million)
Figure 32.GELITA AG: Net Revenue Share, By Segment, 2017
Figure 33.GELITA AG: Net Revenue Share, By Geography, 2017
Figure 34.Hilmar Ingredients: Net Revenues, 2017-2017 ($Million)
Figure 35.Hilmar Ingredients: Net Revenue Share, By Segment, 2017
Figure 36.Hilmar Ingredients: Net Revenue Share, By Geography, 2017
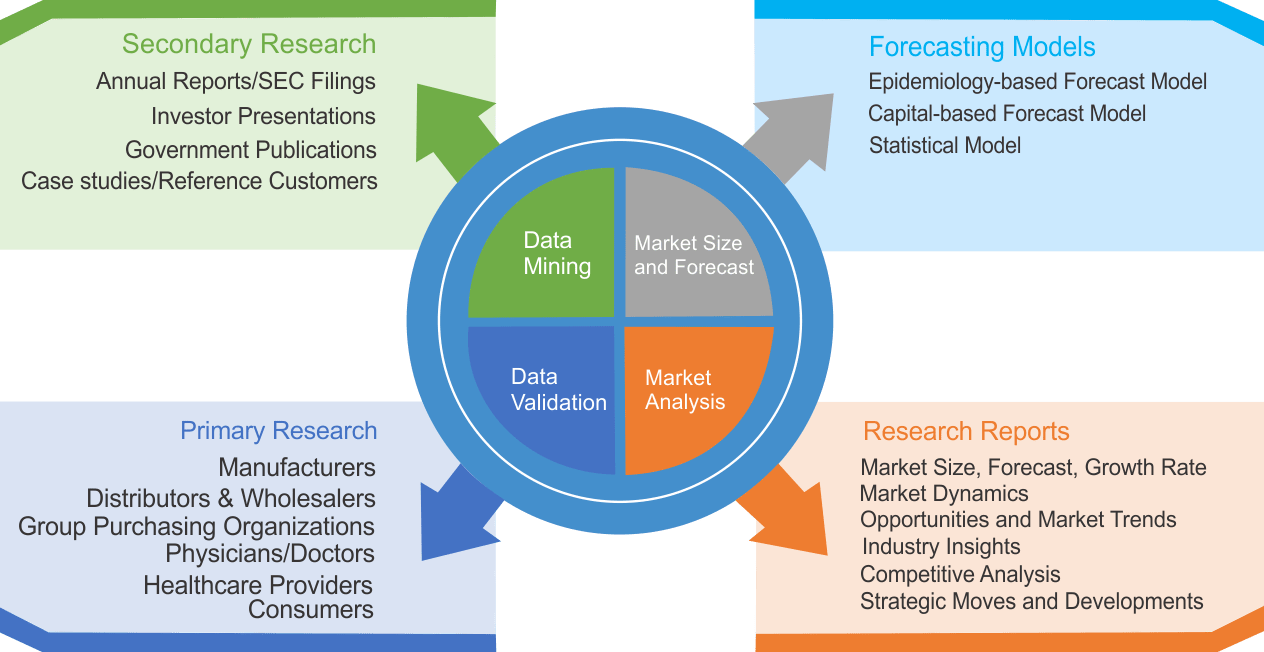
Research Methodology
We use both primary as well as secondary research for our market surveys, estimates and for developing forecast. Our research process commence by analyzing the problem which enable us to design the scope for our research study. Our research process is uniquely designed with enough flexibility to adjust according to changing nature of products and markets, while retaining core element to ensure reliability and accuracy in research findings. We understand both macro and micro-economic factors to evaluate and forecast different market segments.
Data Mining
Data is extensively collected through various secondary sources such as annual reports, investor presentations, SEC filings, and other corporate publications. We also refer trade magazines, technical journals, paid databases such as Factiva and Bloomberg, industry trade journals, scientific journals, and social media data to understand market dynamics and industry trends. Further, we also conduct primary research to understand market drivers, restraints, opportunities, challenges, and competitive scenario to build our analysis.
Data Collection Matrix
|
Data Collection Matrix |
Supply Side |
Demand Side |
|
Primary Data Sources |
|
|
|
Secondary Data Sources |
|
|
Market Modeling and Forecasting
We use epidemiology and capital equipment-based models to forecast market size of different segments at country and regional level.
- Epidemiology-based Forecasting Model: This method uses epidemiology data gathered through various publications and from physicians to estimate population of patients, flow of treatment of individual disease and therapies. The data collected through this method includes statics on incidence of disease, population suffering from disease, and treatment population. This method is used to understand:
- Number of patients for particular device or medical procedure and
- Repeated use of particular device depending on health and condition of patient
- Capital-based Forecasting Model: This method of forecasting is based on number of replacements, installed-based and new sales of capital equipment used in various healthcare and diagnostic centers. These three parameters are calculated and forecast is developed. Installation base is calculated as average number of units per facility; while sales for particular year is calculated from number of new and replace units. Secondary data is collected through various supply chain intermediaries and opinion leaders to arrive at installation and sales rate. These techniques help our analysts in validating market and developed market estimates and forecast.
We do forecast on basis of several parameters such as market drivers, market opportunities, industry trends government regulations, raw materials supply and trade dynamics to ensure relevance of forecast with market scenario. With increasing need to granulized information, we used bottom-up methodology for forecasting where we evaluate each regional segment differently and combined all forecast to develop final market forecast.
Data Validation
We believe primary research is a very important tool in analyzing and forecasting different markets. In order to make sure accuracy of our findings, our team conducts primary interviews at every stage of research to gain deep insights into current business environment and future trends and key developments in market. This includes use of various methods such as telephonic interviews, focus groups, face to face interviews and questionnaires to validate our research from all aspects. We validate our data through primary research from key industry leaders such as CEO, product managers, marketing managers, suppliers, distributors, and consumers are frequently interviewed. These interviews provide valuable insights which help us to have better market understanding besides validating our estimates and forecast.
Data Triangulation
Industry Analysis
|
Qualitative Data |
Quantitative Data (2017-2025) |
|
|