.png)
Frozen Bakery Products Market by Target Audience, Product, Distribution Channel and Technology - Global Industry Analysis and Forecast to 2023
Published On : September 2017 Pages : 130 Category: Food and Beverages Report Code : FB09204
SEGMENTS & REGIONS:
- Regions: North America, Europe, Asia- Pacific, Latin America, Middle East & Africa
Industry Outlook and Trend Analysis
The global frozen bakery products market was worth USD billion in 2017 and is prognosticated to be nearly USD billion by 2023, growing at a compound annual growth rate (CAGR) of % during the forecast period. Rising requirement of processed food and increasing preference of bakery products among consumers is said to boost the demand of bakery products. These products can be stored for longer time in comparison with traditional bakery products. Various benefits provided by these products such as enhanced quality, manufacturing process that is environment friendly, convenient availability and low prices are anticipated to spur the growth of this market. A considerable chunk is contributed by frozen bakery products to the frozen food market owing to the increasing demand of ready to warm and ready to bake products. Quick service is offered by these products along with maintaining freshness as well as quality. Multiple companies have accomplished prosperity in a competitive market by providing these products to places that offer quick services like cafes, gas stations, restaurants, in-store bakeries and coffee chains. The major factors that influence the growth of these products are growing demand among consumers, consistency in taste and enhancement of retail avenues providing these products. On the other hand, shortage of distribution facilities in rural or semi-urban areas and absence of refrigeration facility in some retail stores are factors that can hamper the growth of this market.
Product Outlook and Trend analysis
The global frozen bakery products market in terms of product is disintegrated into pastries, pizza crusts, rolls, donuts, cakes, breads and others. With regards to revenue a substantial market share was registered by pizza crust of over 30 percent. In several western countries like Germany, France, Spain and Mexico frozen pizza is a part of daily meal. Moreover, this segment was leading the market owing to the pattern of consumption in emerging countries like United States and Italy. Companies providing frozen food are launching new pizzas that contain ingredients that are healthy. On the basis of consumption, frozen bread is said to show significant growth in the upcoming years. In America, bread is known to be as a staple food item. At the time of storage various physical and chemical changes take place that may degrade the freshness and the quality of the bread.
Distribution Channel outlook and Trend Analysis
On the basis of distribution channel the global frozen bakery products market is disintegrated into quick serving restaurants, artisan bakers, convenience stores, catering & industrial and Hypermarket & supermarket. Catering and industrial sector is anticipated to witness swift growth in the forecast period. The major factors that spur the growth of this market are the availability of several national as well as international brands of bakery products coupled with rising tourism. Many international cuisines include bread and bread products in their food items. The catering sector is the fastest growing in comparison with any other industry. Quick service restaurants are an increasingly emerging channel of distribution for frozen bakery products. This segment is said to witness significant growth owing to factors like enhanced living standards of people coupled with increased disposable income. Moreover, the rising requirement of convenient and on-the-go products is said to boost the quick service restaurants market.
Regional Outlook and Trend analysis
A significant amount of contribution to the global frozen bakery products market is expected from Europe during the forecast period. Emerging tourism and catering industry in the United Kingdom, France and Germany is said to reflect significant growth in the region in the upcoming years. The growth of the regional market of frozen bakery products is attributed to the increasing requirement for ‘thaw and serve’ products that render convenience to retail bakeries, households, quick service restaurants and grocery stores. Moreover, increase in the shelf life of these products render an option of stocking the products and utilizing as and when needed. Latin America was accounted for a revenue of USD billion in 2017 in the frozen bakery market. The region is anticipated to have a booming market due to the rising requirement of processed food and diversity in the lifestyle of the consumers. Additionally, the enhance food culture couples with rising living standards and disposable income is said to spur the growth of the market.
Competitive Insights
The leading manufacturers in the global frozen bakery products market are Kellogg Company, General Mills, Bridgford Foods Corporation, Alpha Baking Company Inc, Pepperidge Farm, Maple Leaf Foods, Conagra Brands, Vandemoortele, Lantmännen Unibake, Cargill, Général Waffle Manufactory SPRL, Cole's Quality Foods and EUROPASTRY S.A.
The global frozen bakery products marketis segmented as follows-
By Target Audience
- Food safety agencies
- Government and research organizations
- Frozen bakery products manufacturers and suppliers
- Food safety agencies
- Associations and industrial bodies
- Regulatory institutions
- Traders, distributors, and retailers
- Agricultural institutes and universities
By Product
- Breads
- Rolls
- Pizza Crusts
- Cakes
- Muffins
- Pound cakes
- Pancakes
- Pastries
- Donuts
- Others Frozen Bakery Products
By Distribution Channel
- Catering & Industrial
- Artisan Bakers
- Retail
- Supermarkets & Hypermarkets
- In-Store Bakeries
- Convenience Stores
By Technology
- Ready Baked & Frozen
- Raw Products
- Ready-to-Bake
By Region
- North America
- U.S
- Canada
- Mexico
- Europe
- Germany
- France
- UK
- Italy
- Spain
- Rest of Europe
- Asia-Pacific
- Japan
- China
- Australia
- India
- South Korea
- Rest of Asia Pacific
- Rest of the World
- Brazil
- South Africa
- Saudi Arabia
- United Arab Emirates
- Others
Some of the key questions answered by the report are:
- What was the market size in 2017 and forecast from 2022 to 2027?
- What will be the industry market growth from 2022 to 2027?
- What are the major drivers, restraints, opportunities, challenges, and industry trends and their impact on the market forecast?
- What are the major segments leading the market growth and why?
- Which are the leading players in the market and what are the major strategies adopted by them to sustain the market competition?
Market Classification
- Frozen Bakery Products Market, By Target Audience, Estimates and Forecast, 2013-2023 ($Million)
- Food safety agencies
- Government and research organizations
- Frozen bakery products manufacturers and suppliers
- Food safety agencies
- Associations and industrial bodies
- Regulatory institutions
- Traders, distributors, and retailers
- Agricultural institutes and universities
- Frozen Bakery Products Market, By Product, Estimates and Forecast, 2013-2023 ($Million)
- Breads
- Rolls
- Pizza Crusts
- Cakes
- Muffins
- Pound cakes
- Pancakes
- Pastries
- Donuts
- Others Frozen Bakery Products
- Frozen Bakery Products Market, By Distribution Channel, Estimates and Forecast, 2013-2023 ($Million)
- Catering & Industrial
- Artisan Bakers
- Retail
- Supermarkets & Hypermarkets
- In-Store Bakeries
- Convenience Stores
- Frozen Bakery Products Market, By Technology, Estimates and Forecast, 2013-2023 ($Million)
- Ready Baked & Frozen
- Raw Products
- Ready-to-Bake
- Frozen Bakery Products Market, By Region, Estimates and Forecast, 2013-2023 ($Million)
- North America
- North America Frozen Bakery Products Market, By Country
- North America Frozen Bakery Products Market, By Target Audience
- North America Frozen Bakery Products Market, By Product
- North America Frozen Bakery Products Market, By Distribution Channel
- North America Frozen Bakery Products Market, By Technology
- U.S. Frozen Bakery Products Market, By Target Audience
- U.S. Frozen Bakery Products Market, By Product
- U.S. Frozen Bakery Products Market, By Distribution Channel
- U.S. Frozen Bakery Products Market, By Technology
- Canada Frozen Bakery Products Market, By Target Audience
- Canada Frozen Bakery Products Market, By Product
- Canada Frozen Bakery Products Market, By Distribution Channel
- Canada Frozen Bakery Products Market, By Technology
- Mexico Frozen Bakery Products Market, By Target Audience
- Mexico Frozen Bakery Products Market, By Product
- Mexico Frozen Bakery Products Market, By Distribution Channel
- Mexico Frozen Bakery Products Market, By Technology
-
- Europe
- Europe Frozen Bakery Products Market, By Country
- Europe Frozen Bakery Products Market, By Target Audience
- Europe Frozen Bakery Products Market, By Product
- Europe Frozen Bakery Products Market, By Distribution Channel
- Europe Frozen Bakery Products Market, By Technology
- Germany Frozen Bakery Products Market, By Target Audience
- Germany Frozen Bakery Products Market, By Product
- Germany Frozen Bakery Products Market, By Distribution Channel
- Germany Frozen Bakery Products Market, By Technology
- France Frozen Bakery Products Market, By Target Audience
- France Frozen Bakery Products Market, By Product
- France Frozen Bakery Products Market, By Distribution Channel
- France Frozen Bakery Products Market, By Technology
- UK Frozen Bakery Products Market, By Target Audience
- UK Frozen Bakery Products Market, By Product
- UK Frozen Bakery Products Market, By Distribution Channel
- UK Frozen Bakery Products Market, By Technology
- Italy Frozen Bakery Products Market, By Target Audience
- Italy Frozen Bakery Products Market, By Product
- Italy Frozen Bakery Products Market, By Distribution Channel
- Italy Frozen Bakery Products Market, By Technology
- Spain Frozen Bakery Products Market, By Target Audience
- Spain Frozen Bakery Products Market, By Product
- Spain Frozen Bakery Products Market, By Distribution Channel
- Spain Frozen Bakery Products Market, By Technology
- Rest of Europe Frozen Bakery Products Market, By Target Audience
- Rest of Europe Frozen Bakery Products Market, By Product
- Rest of Europe Frozen Bakery Products Market, By Distribution Channel
- Rest of Europe Frozen Bakery Products Market, By Technology
-
- Asia-Pacific
- Asia-Pacific Frozen Bakery Products Market, By Country
- Asia-Pacific Frozen Bakery Products Market, By Target Audience
- Asia-Pacific Frozen Bakery Products Market, By Product
- Asia-Pacific Frozen Bakery Products Market, By Distribution Channel
- Asia-Pacific Frozen Bakery Products Market, By Technology
- Japan Frozen Bakery Products Market, By Target Audience
- Japan Frozen Bakery Products Market, By Product
- Japan Frozen Bakery Products Market, By Distribution Channel
- Japan Frozen Bakery Products Market, By Technology
- Australia Frozen Bakery Products Market, By Target Audience
- Australia Frozen Bakery Products Market, By Product
- Australia Frozen Bakery Products Market, By Distribution Channel
- Australia Frozen Bakery Products Market, By Technology
- India Frozen Bakery Products Market, By Target Audience
- India Frozen Bakery Products Market, By Product
- India Frozen Bakery Products Market, By Distribution Channel
- India Frozen Bakery Products Market, By Technology
- South Korea Frozen Bakery Products Market, By Target Audience
- South Korea Frozen Bakery Products Market, By Product
- South Korea Frozen Bakery Products Market, By Distribution Channel
- South Korea Frozen Bakery Products Market, By Technology
- Rest of Asia-Pacific Frozen Bakery Products Market, By Target Audience
- Rest of Asia-Pacific Frozen Bakery Products Market, By Product
- Rest of Asia-Pacific Frozen Bakery Products Market, By Distribution Channel
- Rest of Asia-Pacific Frozen Bakery Products Market, By Technology
- Asia-Pacific
-
- Rest of the World
- Rest of the World Frozen Bakery Products Market, By Country
- Rest of the World Frozen Bakery Products Market, By Target Audience
- Rest of the World Frozen Bakery Products Market, By Product
- Rest of the World Frozen Bakery Products Market, By Distribution Channel
- Rest of the World Frozen Bakery Products Market, By Technology
- Brazil Frozen Bakery Products Market, By Target Audience
- Brazil Frozen Bakery Products Market, By Product
- Brazil Frozen Bakery Products Market, By Distribution Channel
- Brazil Frozen Bakery Products Market, By Technology
- South Africa Frozen Bakery Products Market, By Target Audience
- South Africa Frozen Bakery Products Market, By Product
- South Africa Frozen Bakery Products Market, By Distribution Channel
- South Africa Frozen Bakery Products Market, By Technology
- Saudi Arabia Frozen Bakery Products Market, By Target Audience
- Saudi Arabia Frozen Bakery Products Market, By Product
- Saudi Arabia Frozen Bakery Products Market, By Distribution Channel
- Saudi Arabia Frozen Bakery Products Market, By Technology
- Turky Frozen Bakery Products Market, By Target Audience
- Turkey Frozen Bakery Products Market, By Product
- Turkey Frozen Bakery Products Market, By Distribution Channel
- Turkey Frozen Bakery Products Market, By Technology
- United Arab Emirates Frozen Bakery Products Market, By Target Audience
- United Arab Emirates Frozen Bakery Products Market, By Product
- United Arab Emirates Frozen Bakery Products Market, By Distribution Channel
- United Arab Emirates Frozen Bakery Products Market, By Technology
- Others Frozen Bakery Products Market, By Target Audience
- Others Frozen Bakery Products Market, By Product
- Others Frozen Bakery Products Market, By Distribution Channel
- Others Frozen Bakery Products Market, By Technology
- Rest of the World
Table of Contents
1.Introduction
1.1.Report Description
1.2.Research Methodology
1.2.1. Secondary Research
1.2.2. Primary Research
2.Executive Summary
2.1.Key Highlights
3.Market Overview
3.1.Introduction
3.1.1. Market Definition
3.1.2. Market Segmentation
3.2.Market Share Analysis
3.3.Market Dynamics
3.3.1. Drivers
3.3.1.1.Adoption rate of processed and preserved goods
3.3.1.2.Benefits of frozen bakery products over traditional bakery items
3.3.1.3.Technological advancement in processed food
3.3.2. Restraints
3.3.2.1.Lack of refrigeration facility in many areas
3.3.3. Opportunities
3.3.3.1.Advancement in food quality with improvise technological aspects
3.4.Industry Trends
4.Frozen Bakery Products Market, By Target Audience
4.1.Introduction
4.2.Frozen Bakery Products Market Assessment and Forecast, By Product, 2013-2023
4.3.Food safety agencies
4.3.1. Market Assessment and Forecast, By Region, 2013-2023 ($Million)
4.4.Government and research organizations
4.4.1. Market Assessment and Forecast, By Region, 2013-2023 ($Million)
4.5.Frozen bakery products manufacturers and suppliers
4.5.1. Market Assessment and Forecast, By Region, 2013-2023 ($Million)
4.6.Food safety agencies
4.6.1. Market Assessment and Forecast, By Region, 2013-2023 ($Million)
4.7.Associations and industrial bodies
4.7.1. Market Assessment and Forecast, By Region, 2013-2023 ($Million)
4.8.Regulatory institutions
4.8.1. Market Assessment and Forecast, By Region, 2013-2023 ($Million)
4.9.Traders, distributors, and retailers
4.9.1. Market Assessment and Forecast, By Region, 2013-2023 ($Million)
4.10.Agricultural institutes and universities
4.10.1.Market Assessment and Forecast, By Region, 2013-2023 ($Million)
5.Frozen Bakery Products Market, By Product
5.1.Introduction
5.2.Frozen Bakery Products Market Assessment and Forecast, By Product, 2013-2023
5.3.Breads
5.3.1. Market Assessment and Forecast, By Region, 2013-2023 ($Million)
5.4.Rolls
5.4.1. Market Assessment and Forecast, By Region, 2013-2023 ($Million)
5.5.Pizza Crusts
5.6.Market Assessment and Forecast, By Region, 2013-2023 ($Million)
5.7.Cakes
5.7.1. Market Assessment and Forecast, By Type, 2013-2023 ($Million)
5.7.2. Market Assessment and Forecast, By Region, 2013-2023 ($Million)
5.7.2.1.Muffins
5.7.2.1.1.Market Assessment and Forecast, By Region, 2013-2023 ($Million)
5.7.2.2.Pound cakes
5.7.2.2.1.Market Assessment and Forecast, By Region, 2013-2023 ($Million)
5.7.2.3.Pancakes
5.7.2.3.1.Market Assessment and Forecast, By Region, 2013-2023 ($Million)
5.8.Pastries
5.8.1. Market Assessment and Forecast, By Region, 2013-2023 ($Million)
5.9.Donuts
5.9.1. Market Assessment and Forecast, By Region, 2013-2023 ($Million)
5.10.Other Frozen Bakery Products
5.10.1.Market Assessment and Forecast, By Region, 2013-2023 ($Million)
6.Frozen Bakery Products Market, By Distribution Channel
6.1.Introduction
6.2.Frozen Bakery Products Market Assessment and Forecast, By Distribution Channel, 2013-2023
6.3.Catering & Industrial
6.3.1.1.Market Assessment and Forecast, By Region, 2013-2023 ($Million)
6.4.Artisan Bakers
6.4.1.1.Market Assessment and Forecast, By Region, 2013-2023 ($Million)
6.5.Retail
6.5.1.1.Market Assessment and Forecast, By Type, 2013-2023 ($Million)
6.5.1.2.Market Assessment and Forecast, By Region, 2013-2023 ($Million)
6.5.1.3.Supermarkets & Hypermarkets l
6.5.1.3.1.1.Market Assessment and Forecast, By Region, 2013-2023 ($Million)
6.5.1.4.In-Store Bakeries
6.5.1.4.1.1.Market Assessment and Forecast, By Region, 2013-2023 ($Million)
6.5.1.5.Convenience Stores
6.5.1.5.1.1.Market Assessment and Forecast, By Region, 2013-2023 ($Million)
7.Frozen Bakery Products Market, By Technology
7.1.Introduction
7.2.Frozen Bakery Products Market Assessment and Forecast, By Technology, 2013-2023 ($Million)
7.3.Ready Baked & Frozen
7.3.1.1.Market Assessment and Forecast, By Region, 2013-2023 ($Million)
7.4.Raw Products
7.4.1.1.Market Assessment and Forecast, By Region, 2013-2023 ($Million)
7.5.Ready-to-Bake
7.5.1.1.Market Assessment and Forecast, By Region, 2013-2023 ($Million)
8.Frozen Bakery Products Market, By Region
8.1.Introduction
8.2.Frozen Bakery Products Market Assessment and Forecast, By Region, 2013-2023 ($Million)
8.3.North America
8.3.1. Market Assessment and Forecast, By Country, 2013-2023 ($Million)
8.3.2. Market Assessment and Forecast, By Target Audience, 2013-2023 ($Million)
8.3.3. Market Assessment and Forecast, By Product, 2013-2023 ($Million)
8.3.4. Market Assessment and Forecast, By Distribution Channel, 2013-2023 ($Million)
8.3.5. Market Assessment and Forecast, By Technology, 2013-2023 ($Million)
8.3.5.1.U.S.
8.3.5.1.1.Market Assessment and Forecast, By Target Audience, 2013-2023 ($Million)
8.3.5.1.2.Market Assessment and Forecast, By Product, 2013-2023 ($Million)
8.3.5.1.3.Market Assessment and Forecast, By Distribution Channel, 2013-2023 ($Million)
8.3.5.1.4.Market Assessment and Forecast, By Technology, 2013-2023 ($Million)
8.3.5.1.5.
8.3.5.2.Canada
8.3.5.2.1.Market Assessment and Forecast, By Target Audience, 2013-2023 ($Million)
8.3.5.2.2.Market Assessment and Forecast, By Product, 2013-2023 ($Million)
8.3.5.2.3.Market Assessment and Forecast, By Distribution Channel, 2013-2023 ($Million)
8.3.5.2.4.Market Assessment and Forecast, By Technology, 2013-2023 ($Million)
8.3.5.3.Mexico
8.3.5.3.1.Market Assessment and Forecast, By Target Audience, 2013-2023 ($Million)
8.3.5.3.2.Market Assessment and Forecast, By Product, 2013-2023 ($Million)
8.3.5.3.3.Market Assessment and Forecast, By Distribution Channel, 2013-2023 ($Million)
8.3.5.3.4.Market Assessment and Forecast, By Technology, 2013-2023 ($Million)
8.4.Europe
8.4.1. Market Assessment and Forecast, By Country, 2013-2023 ($Million)
8.4.2. Market Assessment and Forecast, By Target Audience, 2013-2023 ($Million)
8.4.3. Market Assessment and Forecast, By Product, 2013-2023 ($Million)
8.4.4. Market Assessment and Forecast, By Distribution Channel, 2013-2023 ($Million)
8.4.5. Market Assessment and Forecast, By Technology, 2013-2023 ($Million)
8.4.5.1.Germany
8.4.5.1.1.Market Assessment and Forecast, By Target Audience, 2013-2023 ($Million)
8.4.5.1.2.Market Assessment and Forecast, By Product, 2013-2023 ($Million)
8.4.5.1.3.Market Assessment and Forecast, By Distribution Channel, 2013-2023 ($Million)
8.4.5.1.4.Market Assessment and Forecast, By Technology, 2013-2023 ($Million)
8.4.5.2.France
8.4.5.2.1.Market Assessment and Forecast, By Target Audience, 2013-2023 ($Million)
8.4.5.2.2.Market Assessment and Forecast, By Product, 2013-2023 ($Million)
8.4.5.2.3.Market Assessment and Forecast, By Product, 2013-2023 ($Million)
8.4.5.2.4.Market Assessment and Forecast, By Technology, 2013-2023 ($Million)
8.4.5.3.UK
8.4.5.3.1.Market Assessment and Forecast, By Target Audience, 2013-2023 ($Million)
8.4.5.3.2.Market Assessment and Forecast, By Product, 2013-2023 ($Million)
8.4.5.3.3.Market Assessment and Forecast, By Distribution Channel, 2013-2023 ($Million)
8.4.5.3.4.Market Assessment and Forecast, By Technology, 2013-2023 ($Million)
8.4.5.4.Italy
8.4.5.4.1.Market Assessment and Forecast, By Target Audience, 2013-2023 ($Million)
8.4.5.4.2.Market Assessment and Forecast, By Product, 2013-2023 ($Million)
8.4.5.4.3.Market Assessment and Forecast, By Distribution Channel, 2013-2023 ($Million)
8.4.5.4.4.Market Assessment and Forecast, By Technology, 2013-2023 ($Million)
8.4.5.5.Spain
8.4.5.5.1.Market Assessment and Forecast, By Target Audience, 2013-2023 ($Million)
8.4.5.5.2.Market Assessment and Forecast, By Product, 2013-2023 ($Million)
8.4.5.5.3.Market Assessment and Forecast, By Distribution Channel, 2013-2023 ($Million)
8.4.5.5.4.Market Assessment and Forecast, By Technology, 2013-2023 ($Million)
8.4.5.6.Russia
8.4.5.6.1.Market Assessment and Forecast, By Target Audience, 2013-2023 ($Million)
8.4.5.6.2.Market Assessment and Forecast, By Product, 2013-2023 ($Million)
8.4.5.6.3.Market Assessment and Forecast, By Distribution Channel, 2013-2023 ($Million)
8.4.5.6.4.Market Assessment and Forecast, By Technology, 2013-2023 ($Million)
8.4.5.7.Rest of Europe
8.4.5.7.1.Market Assessment and Forecast, By Target Audience, 2013-2023 ($Million)
8.4.5.7.2.Market Assessment and Forecast, By Product, 2013-2023 ($Million)
8.4.5.7.3.Market Assessment and Forecast, By Distribution Channel, 2013-2023 ($Million)
8.4.5.7.4.Market Assessment and Forecast, By Technology, 2013-2023 ($Million)
8.5.Asia-Pacific
8.5.1. Market Assessment and Forecast, By Country, 2013-2023 ($Million)
8.5.2. Market Assessment and Forecast, By Target Audience, 2013-2023 ($Million)
8.5.3. Market Assessment and Forecast, By Product, 2013-2023 ($Million)
8.5.4. Market Assessment and Forecast, By Distribution Channel, 2013-2023 ($Million)
8.5.5. Market Assessment and Forecast, By Technology, 2013-2023 ($Million)
8.5.5.1.Japan
8.5.5.1.1.Market Assessment and Forecast, By Target Audience, 2013-2023 ($Million)
8.5.5.1.2.Market Assessment and Forecast, By Product, 2013-2023 ($Million)
8.5.5.1.3.Market Assessment and Forecast, By Distribution Channel, 2013-2023 ($Million)
8.5.5.1.4.Market Assessment and Forecast, By Technology, 2013-2023 ($Million)
8.5.5.2.China
8.5.5.2.1.Market Assessment and Forecast, By Target Audience, 2013-2023 ($Million)
8.5.5.2.2.Market Assessment and Forecast, By Product, 2013-2023 ($Million)
8.5.5.2.3.Market Assessment and Forecast, By Distribution Channel, 2013-2023 ($Million)
8.5.5.2.4.Market Assessment and Forecast, By Technology, 2013-2023 ($Million)
8.5.5.3.Australia
8.5.5.3.1.Market Assessment and Forecast, By Target Audience, 2013-2023 ($Million)
8.5.5.3.2.Market Assessment and Forecast, By Product, 2013-2023 ($Million)
8.5.5.3.3.Market Assessment and Forecast, By Distribution Channel, 2013-2023 ($Million)
8.5.5.3.4.Market Assessment and Forecast, By Technology, 2013-2023 ($Million)
8.5.5.4.India
8.5.5.4.1.Market Assessment and Forecast, By Target Audience, 2013-2023 ($Million)
8.5.5.4.2.Market Assessment and Forecast, By Product, 2013-2023 ($Million)
8.5.5.4.3.Market Assessment and Forecast, By Distribution Channel, 2013-2023 ($Million)
8.5.5.4.4.Market Assessment and Forecast, By Technology, 2013-2023 ($Million)
8.5.5.5.South Korea
8.5.5.5.1.Market Assessment and Forecast, By Target Audience, 2013-2023 ($Million)
8.5.5.5.2.Market Assessment and Forecast, By Product, 2013-2023 ($Million)
8.5.5.5.3.Market Assessment and Forecast, By Distribution Channel, 2013-2023 ($Million)
8.5.5.5.4.Market Assessment and Forecast, By Technology, 2013-2023 ($Million)
8.5.5.6.Taiwan
8.5.5.6.1.Market Assessment and Forecast, By Target Audience, 2013-2023 ($Million)
8.5.5.6.2.Market Assessment and Forecast, By Product, 2013-2023 ($Million)
8.5.5.6.3.Market Assessment and Forecast, By Distribution Channel, 2013-2023 ($Million)
8.5.5.6.4.Market Assessment and Forecast, By Technology, 2013-2023 ($Million)
8.5.5.7.Rest of Asia-Pacific
8.5.5.7.1.Market Assessment and Forecast, By Target Audience, 2013-2023 ($Million)
8.5.5.7.2.Market Assessment and Forecast, By Product, 2013-2023 ($Million)
8.5.5.7.3.Market Assessment and Forecast, By Distribution Channel, 2013-2023 ($Million)
8.5.5.7.4.Market Assessment and Forecast, By Technology, 2013-2023 ($Million)
8.6.Rest of the World
8.6.1. Market Assessment and Forecast, By Country, 2013-2023 ($Million)
8.6.2. Market Assessment and Forecast, By Target Audience, 2013-2023 ($Million)
8.6.3. Market Assessment and Forecast, By Product, 2013-2023 ($Million)
8.6.4. Market Assessment and Forecast, By Distribution Channel, 2013-2023 ($Million)
8.6.5. Market Assessment and Forecast, By Technology, 2013-2023 ($Million)
8.6.5.1.Brazil
8.6.5.1.1.Market Assessment and Forecast, By Target Audience, 2013-2023 ($Million)
8.6.5.1.2.Market Assessment and Forecast, By Product, 2013-2023 ($Million)
8.6.5.1.3.Market Assessment and Forecast, By Distribution Channel, 2013-2023 ($Million)
8.6.5.1.4.Market Assessment and Forecast, By Technology, 2013-2023 ($Million)
8.6.5.2.Turkey
8.6.5.2.1.Market Assessment and Forecast, By Target Audience, 2013-2023 ($Million)
8.6.5.2.2.Market Assessment and Forecast, By Product, 2013-2023 ($Million)
8.6.5.2.3.Market Assessment and Forecast, By Distribution Channel, 2013-2023 ($Million)
8.6.5.2.4.Market Assessment and Forecast, By Technology, 2013-2023 ($Million)
8.6.5.3.Saudi Arabia
8.6.5.3.1.Market Assessment and Forecast, By Target Audience, 2013-2023 ($Million)
8.6.5.3.2.Market Assessment and Forecast, By Product, 2013-2023 ($Million)
8.6.5.3.3.Market Assessment and Forecast, By Distribution Channel, 2013-2023 ($Million)
8.6.5.3.4.Market Assessment and Forecast, By Technology, 2013-2023 ($Million)
8.6.5.4.South Africa
8.6.5.4.1.Market Assessment and Forecast, By Target Audience, 2013-2023 ($Million)
8.6.5.4.2.Market Assessment and Forecast, By Product, 2013-2023 ($Million)
8.6.5.4.3.Market Assessment and Forecast, By Distribution Channel, 2013-2023 ($Million)
8.6.5.4.4.Market Assessment and Forecast, By Technology, 2013-2023 ($Million)
8.6.5.5.United Arab Emirates
8.6.5.5.1.Market Assessment and Forecast, By Target Audience, 2013-2023 ($Million)
8.6.5.5.2.Market Assessment and Forecast, By Product, 2013-2023 ($Million)
8.6.5.5.3.Market Assessment and Forecast, By Distribution Channel, 2013-2023 ($Million)
8.6.5.5.4.Market Assessment and Forecast, By Technology, 2013-2023 ($Million)
8.6.5.6.Others
8.6.5.6.1.Market Assessment and Forecast, By Target Audience, 2013-2023 ($Million)
8.6.5.6.2.Market Assessment and Forecast, By Product, 2013-2023 ($Million)
8.6.5.6.3.Market Assessment and Forecast, By Distribution Channel, 2013-2023 ($Million)
8.6.5.6.4.Market Assessment and Forecast, By Technology, 2013-2023 ($Million)
9.Company Profiles
9.1.CSC BRANDS, L.P
9.1.1. Business Overview
9.1.2. Product Portfolio
9.1.3. Key Financials
9.1.4. Strategic Developments
9.2.General Mills Inc.
9.2.1. Business Overview
9.2.2. Product Portfolio
9.2.3. Key Financials
9.2.4. Strategic Developments
9.3.Vaasan Ltd.
9.3.1. Business Overview
9.3.2. Product Portfolio
9.3.3. Strategic Developments
9.4.Lantmännen
9.4.1. Business Overview
9.4.2. Product Portfolio
9.4.3. Key Financials
9.4.4. Strategic Developments
9.5.Maple Leaf Foods Inc.
9.5.1. Business Overview
9.5.2. Product Portfolio
9.5.3. Key Financials
9.5.4. Strategic Developments
9.6.Flowers Foods Inc.
9.6.1. Business Overview
9.6.2. Product Portfolio
9.6.3. Key Financials
9.6.4. Strategic Developments
9.7.Barilla G. e R. Fratelli S.p.A
9.7.1. Business Overview
9.7.2. Product Portfolio
9.7.3. Key Financials
9.7.4. Strategic Developments
9.8.KELLOGG CO.
9.8.1. Business Overview
9.8.2. Product Portfolio
9.8.3. Key Financials
9.8.4. Strategic Developments
9.9.Alpha Baking Company, Inc.
9.9.1. Business Overview
9.9.2. Product Portfolio
9.9.3. Key Financials
9.9.4. Strategic Developments
9.10.Grupo Bimbo
9.10.1.Business Overview
9.10.2.Product Portfolio
9.10.3.Key Financials
9.10.4.Strategic Developments
9.11.Premier Foods Plc
9.11.1.Business Overview
9.11.2.Product Portfolio
9.11.3.Key Financials
9.11.4.Strategic Developments
9.12.Bridgford Foods Corporation
9.12.1.Business Overview
9.12.2.Product Portfolio
9.12.3.Key Financials
9.12.4.Strategic Developments
9.13.EUROPASTRY, S.A.
9.13.1.Business Overview
9.13.2.Product Portfolio
9.13.3.Key Financials
9.13.4.Strategic Developments
9.14.Aryzta AG
9.14.1.Business Overview
9.14.2.Product Portfolio
9.14.3.Strategic Developments
List of Tables
Table 1.Frozen Bakery Products Market, By Target Audience ($Million), 2017-2023
Table 2.Food safety agencies Market, By Region ($Million), 2017-2023
Table 3.Government and research organizations Market, By Region ($Million), 2017-2023
Table 4.Frozen bakery products manufacturers and suppliers Market, By Region ($Million), 2017-2023
Table 5.Food safety agencies Market, By Region ($Million), 2017-2023
Table 6.Associations and industrial bodies Market, By Region ($Million), 2017-2023
Table 7.Regulatory institutions Market, By Region ($Million), 2017-2023
Table 8.Traders, distributors, and retailers Market, By Region ($Million), 2017-2023
Table 9.Agricultural institutes and universities Market, By Region ($Million), 2017-2023
Table 10.Frozen Bakery Products Market, By Product ($Million), 2017-2023
Table 11.Breads Market, By Region ($Million), 2017-2023
Table 12.Rolls Market, By Region ($Million), 2017-2023
Table 13.Pizza Crusts Market, By Region ($Million), 2017-2023
Table 14.Cakes Market, By Region ($Million), 2017-2023
Table 15.Muffins Market, By Region ($Million), 2017-2023
Table 16Cakes & Pastries Market, By Region ($Million), 2017-2023
Table 17.Pound cakes Market, By Region ($Million), 2017-2023
Table 18.Pancakes Market, By Region ($Million), 2017-2023
Table 19.Pastries Market, By Region ($Million), 2017-2023
Table 20.Donuts Market, By Region ($Million), 2017-2023
Table 21.Other Frozen Bakery Products Market, By Region ($Million), 2017-2023
Table 22.Frozen Bakery Products Market, By Distribution Channel ($Million), 2017-2023
Table 23.Catering & Industrial Market, By Region ($Million), 2017-2023
Table 24.Artisan Bakers Market, By Region ($Million), 2017-2023
Table 25.Retail Market, By Region ($Million), 2017-2023
Table 26.Supermarkets & Hypermarkets Market, By Region ($Million), 2017-2023
Table 27.In-Store Bakeries Market, By Region ($Million), 2017-2023
Table 28.Convenience Stores Market, By Region ($Million), 2017-2023
Table 29.Frozen Bakery Products Market, By Technology ($Million), 2017-2023
Table 30.Ready Baked & Frozen Market, By Region ($Million), 2017-2023
Table 31.Raw Products Market, By Region ($Million), 2017-2023
Table 32.Ready-to-Bake Market, By Region ($Million), 2017-2023
Table 33.Frozen Bakery Products Market, By Region ($Million), 2017-2023
Table 34.North America Frozen Bakery Products Market, By Country, 2017-2023 ($Million)
Table 35.North America Frozen Bakery Products Market, By Target Audience, 2017-2023 ($Million)
Table 36.North America Frozen Bakery Products Market, By Product, 2017-2023 ($Million)
Table 37.North America Frozen Bakery Products Market, By Distribution Channel, 2017-2023 ($Million)
Table 38.North America Frozen Bakery Products Market, By Technology, 2017-2023 ($Million)
Table 39.U.S. Frozen Bakery Products Market, By Target Audience, 2017-2023 ($Million)
Table 40.U.S. Frozen Bakery Products Market, By Product, 2017-2023 ($Million)
Table 41.U.S. Frozen Bakery Products Market, By Distribution Channel, 2017-2023 ($Million)
Table 42.U.S. Frozen Bakery Products Market, By Technology, 2017-2023 ($Million)
Table 43.Canada Frozen Bakery Products Market, By Target Audience, 2017-2023 ($Million)
Table 44.Canada Frozen Bakery Products Market, By Product, 2017-2023 ($Million)
Table 45.Canada Frozen Bakery Products Market, By Distribution Channel, 2017-2023 ($Million)
Table 46.Canada Frozen Bakery Products Market, By Technology, 2017-2023 ($Million)
Table 47.Mexico Frozen Bakery Products Market, By Target Audience, 2017-2023 ($Million)
Table 48.Mexico Frozen Bakery Products Market, By Product, 2017-2023 ($Million)
Table 49.Mexico Frozen Bakery Products Market, By Distribution Channel, 2017-2023 ($Million)
Table 50.Mexico Frozen Bakery Products Market, By Technology, 2017-2023 ($Million)
Table 51.Europe Frozen Bakery Products Market, By Country, 2017-2023 ($Million)
Table 52.Europe Frozen Bakery Products Market, By Target Audience, 2017-2023 ($Million)
Table 53.Europe Frozen Bakery Products Market, By Product, 2017-2023 ($Million)
Table 54.Europe Frozen Bakery Products Market, By Distribution Channel, 2017-2023 ($Million)
Table 55.Europe Frozen Bakery Products Market, By Technology, 2017-2023 ($Million)
Table 56.Germany Frozen Bakery Products Market, By Target Audience, 2017-2023 ($Million)
Table 57.Germany Frozen Bakery Products Market, By Product, 2017-2023 ($Million)
Table 58.Germany Frozen Bakery Products Market, By Distribution Channel, 2017-2023 ($Million)
Table 59.Germany Frozen Bakery Products Market, By Technology, 2017-2023 ($Million)
Table 60.France Frozen Bakery Products Market, By Target Audience, 2017-2023 ($Million)
Table 61.France Frozen Bakery Products Market, By Product, 2017-2023 ($Million)
Table 62.France Frozen Bakery Products Market, By Distribution Channel, 2017-2023 ($Million)
Table 63.France Frozen Bakery Products Market, By Technology, 2017-2023 ($Million)
Table 64.UK Frozen Bakery Products Market, By Target Audience, 2017-2023 ($Million)
Table 65.UK Frozen Bakery Products Market, By Product, 2017-2023 ($Million)
Table 66.UK Frozen Bakery Products Market, By Distribution Channel, 2017-2023 ($Million)
Table 67.UK Frozen Bakery Products Market, By Technology, 2017-2023 ($Million)
Table 68.Italy Frozen Bakery Products Market, By Target Audience, 2017-2023 ($Million)
Table 69.Italy Frozen Bakery Products Market, By Product, 2017-2023 ($Million)
Table 70.Italy Frozen Bakery Products Market, By Distribution Channel, 2017-2023 ($Million)
Table 71.Italy Frozen Bakery Products Market, By Technology, 2017-2023 ($Million)
Table 72.Spain Frozen Bakery Products Market, By Target Audience, 2017-2023 ($Million)
Table 73.Spain Frozen Bakery Products Market, By Product, 2017-2023 ($Million)
Table 74.Spain Frozen Bakery Products Market, By Distribution Channel, 2017-2023 ($Million)
Table 75.Spain Frozen Bakery Products Market, By Technology, 2017-2023 ($Million)
Table 76.Russia Frozen Bakery Products Market, By Target Audience, 2017-2023 ($Million)
Table 77.Russia Frozen Bakery Products Market, By Product, 2017-2023 ($Million)
Table 78.Russia Frozen Bakery Products Market, By Distribution Channel, 2017-2023 ($Million)
Table 79.Russia Frozen Bakery Products Market, By Technology, 2017-2023 ($Million)
Table 80.Rest of Europe Frozen Bakery Products Market, By Target Audience, 2017-2023 ($Million)
Table 81.Rest of Europe Frozen Bakery Products Market, By Product, 2017-2023 ($Million)
Table 82.Rest of Europe Frozen Bakery Products Market, By Distribution Channel, 2017-2023 ($Million)
Table 83.Rest of Europe Frozen Bakery Products Market, By Technology, 2017-2023 ($Million)
Table 84.Asia-Pacific Frozen Bakery Products Market, By Country, 2017-2023 ($Million)
Table 85.Asia-Pacific Frozen Bakery Products Market, By Target Audience, 2017-2023 ($Million)
Table 86.Asia-Pacific Frozen Bakery Products Market, By Product, 2017-2023 ($Million)
Table 87.Asia-Pacific Frozen Bakery Products Market, By Distribution Channel, 2017-2023 ($Million)
Table 88.Asia-Pacific Frozen Bakery Products Market, By Technology, 2017-2023 ($Million)
Table 99.Japan Frozen Bakery Products Market, By Target Audience, 2017-2023 ($Million)
Table 90.Japan Frozen Bakery Products Market, By Product, 2017-2023 ($Million)
Table 91.Japan Frozen Bakery Products Market, By Distribution Channel, 2017-2023 ($Million)
Table 92.Japan Frozen Bakery Products Market, By Technology, 2017-2023 ($Million)
Table 93.China Frozen Bakery Products Market, By Target Audience, 2017-2023 ($Million)
Table 94.China Frozen Bakery Products Market, By Product, 2017-2023 ($Million)
Table 95.China Frozen Bakery Products Market, By Distribution Channel, 2017-2023 ($Million)
Table 96.China Frozen Bakery Products Market, By Technology, 2017-2023 ($Million)
Table 97.Australia Frozen Bakery Products Market, By Target Audience, 2017-2023 ($Million)
Table 98.Australia Frozen Bakery Products Market, By Product, 2017-2023 ($Million)
Table 99.Australia Frozen Bakery Products Market, By Distribution Channel, 2017-2023 ($Million)
Table 100.Australia Frozen Bakery Products Market, By Technology, 2017-2023 ($Million)
Table 101.India Frozen Bakery Products Market, By Target Audience, 2017-2023 ($Million)
Table 102.India Frozen Bakery Products Market, By Product, 2017-2023 ($Million)
Table 103.India Frozen Bakery Products Market, By Distribution Channel, 2017-2023 ($Million)
Table 104.India Frozen Bakery Products Market, By Technology, 2017-2023 ($Million)
Table 105.South Korea Frozen Bakery Products Market, By Target Audience, 2017-2023 ($Million)
Table 106.South Korea Frozen Bakery Products Market, By Product, 2017-2023 ($Million)
Table 107.South Korea Frozen Bakery Products Market, By Distribution Channel, 2017-2023 ($Million)
Table 108.South Korea Frozen Bakery Products Market, By Technology, 2017-2023 ($Million)
Table 109.Taiwan Frozen Bakery Products Market, By Target Audience, 2017-2023 ($Million)
Table 110.Taiwan Frozen Bakery Products Market, By Product, 2017-2023 ($Million)
Table 111.Taiwan Frozen Bakery Products Market, By Distribution Channel, 2017-2023 ($Million)
Table 112.Taiwan Frozen Bakery Products Market, By Technology, 2017-2023 ($Million)
Table 113.Rest of Asia-Pacific Frozen Bakery Products Market, By Target Audience, 2017-2023 ($Million)
Table 114.Rest of Asia-Pacific Frozen Bakery Products Market, By Product, 2017-2023 ($Million)
Table 115.Rest of Asia-Pacific Frozen Bakery Products Market, By Distribution Channel, 2017-2023 ($Million)
Table 116.Rest of Asia-Pacific Frozen Bakery Products Market, By Technology, 2017-2023 ($Million)
Table 117.Rest of the World Frozen Bakery Products Market, By Country, 2017-2023 ($Million)
Table 118.Rest of the World Frozen Bakery Products Market, By Target Audience, 2017-2023 ($Million)
Table 119.Rest of the World Frozen Bakery Products Market, By Product, 2017-2023 ($Million)
Table 120.Rest of the World Frozen Bakery Products Market, By Distribution Channel, 2017-2023 ($Million)
Table 121.Rest of the World Frozen Bakery Products Market, By Technology, 2017-2023 ($Million)
Table 122.Brazil Frozen Bakery Products Market, By Target Audience, 2017-2023 ($Million)
Table 123.Brazil Frozen Bakery Products Market, By Product, 2017-2023 ($Million)
Table 124.Brazil Frozen Bakery Products Market, By Distribution Channel, 2017-2023 ($Million)
Table 125.Brazil Frozen Bakery Products Market, By Technology, 2017-2023 ($Million)
Table 126.Turkey Frozen Bakery Products Market, By Target Audience, 2017-2023 ($Million)
Table 127.Turkey Frozen Bakery Products Market, By Product, 2017-2023 ($Million)
Table 128.Turkey Frozen Bakery Products Market, By Distribution Channel, 2017-2023 ($Million)
Table 129.Turkey Frozen Bakery Products Market, By Technology, 2017-2023 ($Million)
Table 130.Saudi Arabia Frozen Bakery Products Market, By Target Audience, 2017-2023 ($Million)
Table 131.Saudi Arabia Frozen Bakery Products Market, By Product, 2017-2023 ($Million)
Table 132.Saudi Arabia Frozen Bakery Products Market, By Distribution Channel, 2017-2023 ($Million)
Table 133.Saudi Arabia Frozen Bakery Products Market, By Technology, 2017-2023 ($Million)
Table 134.South Africa Frozen Bakery Products Market, By Target Audience, 2017-2023 ($Million)
Table 135.South Africa Frozen Bakery Products Market, By Product, 2017-2023 ($Million)
Table 136.South Africa Frozen Bakery Products Market, By Distribution Channel, 2017-2023 ($Million)
Table 137.South Africa Frozen Bakery Products Market, By Technology, 2017-2023 ($Million)
Table 138.United Arab Emirates Frozen Bakery Products Market, By Target Audience, 2017-2023 ($Million)
Table 139.United Arab Emirates Frozen Bakery Products Market, By Product, 2017-2023 ($Million)
Table 140.United Arab Emirates Frozen Bakery Products Market, By Distribution Channel, 2017-2023 ($Million)
Table 141.United Arab Emirates Frozen Bakery Products Market, By Technology, 2017-2023 ($Million)
Table 142.Other Frozen Bakery Products Market, By Target Audience, 2017-2023 ($Million)
Table 143.Others Frozen Bakery Products Market, By Product, 2017-2023 ($Million)
Table 144.Others Frozen Bakery Products Market, By Distribution Channel, 2017-2023 ($Million)
Table 145.Others Frozen Bakery Products Market, By Technology, 2017-2023 ($Million)
Table 146.CSC BRANDS, L.P: Key Strategic Developments, 2017-2017
Table 147.General Mills Inc.: Key Strategic Developments, 2017-2017
Table 148.Lantmännen: Key Strategic Developments, 2017-2017
Table 149.Lantmännen: Key Strategic Developments, 2017-2017
Table 150.Maple Leaf Foods Inc.: Key Strategic Developments, 2017-2017
Table 151.Flowers Foods Inc.: Key Strategic Developments, 2017-2017
Table 152.Barilla G. e R. Fratelli S.p.A: Key Strategic Developments, 2017-2017
Table 153.KELLOGG CO.: Key Strategic Developments, 2017-2017
Table 154.Alpha Baking Company, Inc.: Key Strategic Developments, 2017-2017
Table 155.Grupo Bimbo: Key Strategic Developments, 2017-2017
Table 156.Premier Foods Plc: Key Strategic Developments, 2017-2017
Table 157.BRIDGFORD FOODS CORPORATION: Key Strategic Developments, 2017-2017
Table 158.BRIDGFORD FOODS CORPORATION: Key Strategic Developments, 2017-2017
Table 159.Aryzta AG: Key Strategic Developments, 2017-2017
List of Figures
Figure 1.Frozen Bakery Products Market Share, By Target Audience, 2017 & 2023 ($Million)
Figure 2.Frozen Bakery Products Market Share, By Product, 2017 & 2023 ($Million)
Figure 3.Frozen Bakery Products Market, By Distribution Channel, 2017 & 2023 ($Million)
Figure 4.Frozen Bakery Products Market, By Technology, 2017 & 2023 ($Million)
Figure 5.Frozen Bakery Products Market, By Region, 2017 & 2023 ($Million)
Figure 6.CSC BRANDS, L.P: Net Revenues, 2017-2017 ($Million)
Figure 7.CSC BRANDS, L.P: Net Revenue Share, By Segment, 2017
Figure 8.CSC BRANDS, L.P: Net Revenue Share, By Geography, 2017
Figure 9.General Mills Inc.: Net Revenues, 2017-2017 ($Million)
Figure 10.General Mills Inc.: Net Revenue Share, By Segment, 2017
Figure 11.General Mills Inc.: Net Revenue Share, By Geography, 2017
Figure 12.Lantmännen: Net Revenues, 2017-2017 ($Million)
Figure 13.Lantmännen: Net Revenue Share, By Segment, 2017
Figure 14.Lantmännen: Net Revenue Share, By Geography, 2017
Figure 15.Maple Leaf Foods Inc.: Net Revenues, 2017-2017 ($Million)
Figure 16.Maple Leaf Foods Inc.: Net Revenue Share, By Segment, 2017
Figure 17.Maple Leaf Foods Inc.: Net Revenue Share, By Geography, 2017
Figure 18.Flowers Foods Inc.: Net Revenues, 2017-2017 ($Million)
Figure 19.Flowers Foods Inc.: Net Revenue Share, By Segment, 2017
Figure 20.Flowers Foods Inc.: Net Revenue Share, By Geography, 2017
Figure 21.Barilla G. e R. Fratelli S.p.A: Net Revenues, 2017-2017 ($Million)
Figure 22.Barilla G. e R. Fratelli S.p.A: Net Revenue Share, By Segment, 2017
Figure 23.Barilla G. e R. Fratelli S.p.A: Net Revenue Share, By Geography, 2017
Figure 24.KELLOGG CO.: Net Revenues, 2017-2017 ($Million)
Figure 25.KELLOGG CO.: Net Revenue Share, By Segment, 2017
Figure 26.KELLOGG CO.: Net Revenue Share, By Geography, 2017
Figure 27.Alpha Baking Company, Inc.: Net Revenues, 2017-2017 ($Million)
Figure 28.Alpha Baking Company, Inc.: Net Revenue Share, By Segment, 2017
Figure 29.Alpha Baking Company, Inc.: Net Revenue Share, By Geography, 2017
Figure 30.Grupo Bimbo: Net Revenues, 2017-2017 ($Million)
Figure 31.Grupo Bimbo: Net Revenue Share, By Segment, 2017
Figure 32.Grupo Bimbo: Net Revenue Share, By Geography, 2017
Figure 33.Premier Foods Plc: Net Revenues, 2017-2017 ($Million)
Figure 34.Premier Foods Plc: Net Revenue Share, By Segment, 2017
Figure 35.Premier Foods Plc: Net Revenue Share, By Geography, 2017
Figure 36.BRIDGFORD FOODS CORPORATION: Net Revenues, 2017-2017 ($Million)
Figure 37.BRIDGFORD FOODS CORPORATION: Net Revenue Share, By Segment, 2017
Figure 38.BRIDGFORD FOODS CORPORATION: Net Revenue Share, By Geography, 2017
Figure 39.EUROPASTRY, S.A.: Net Revenues, 2017-2017 ($Million)
Figure 40.EUROPASTRY, S.A.: Net Revenue Share, By Segment, 2017
Figure 41.EUROPASTRY, S.A.: Net Revenue Share, By Geography, 2017
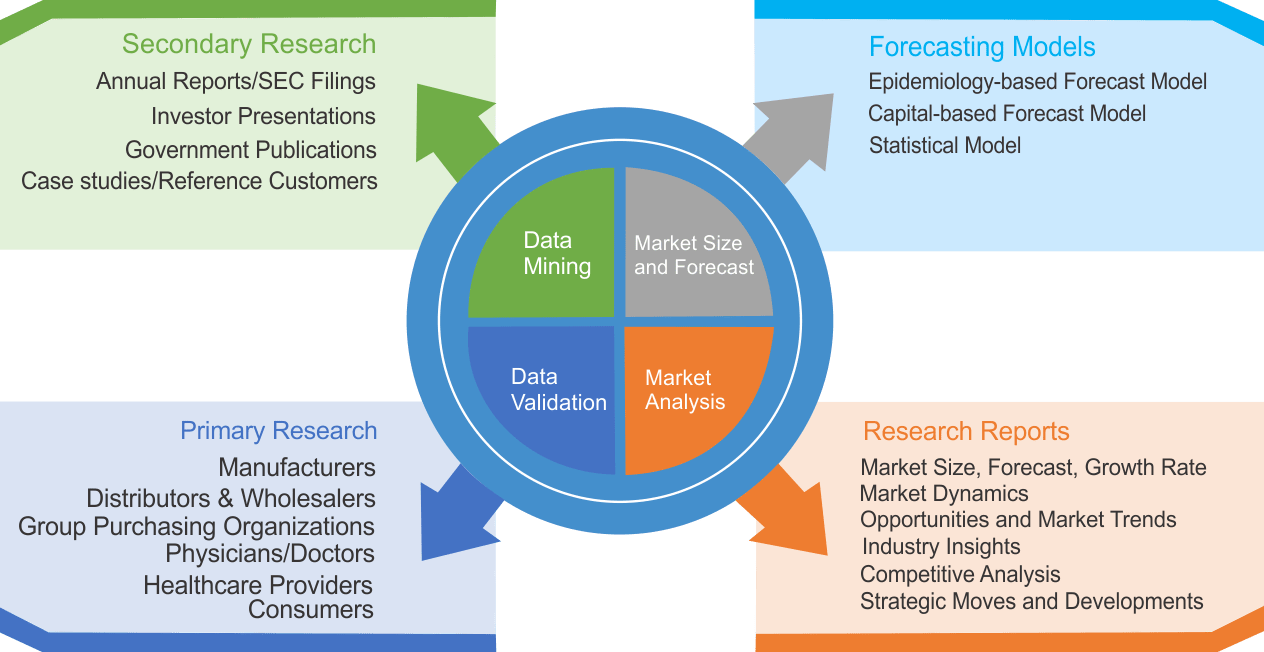
Research Methodology
We use both primary as well as secondary research for our market surveys, estimates and for developing forecast. Our research process commence by analyzing the problem which enable us to design the scope for our research study. Our research process is uniquely designed with enough flexibility to adjust according to changing nature of products and markets, while retaining core element to ensure reliability and accuracy in research findings. We understand both macro and micro-economic factors to evaluate and forecast different market segments.
Data Mining
Data is extensively collected through various secondary sources such as annual reports, investor presentations, SEC filings, and other corporate publications. We also refer trade magazines, technical journals, paid databases such as Factiva and Bloomberg, industry trade journals, scientific journals, and social media data to understand market dynamics and industry trends. Further, we also conduct primary research to understand market drivers, restraints, opportunities, challenges, and competitive scenario to build our analysis.
Data Collection Matrix
|
Data Collection Matrix |
Supply Side |
Demand Side |
|
Primary Data Sources |
|
|
|
Secondary Data Sources |
|
|
Market Modeling and Forecasting
We use epidemiology and capital equipment-based models to forecast market size of different segments at country and regional level.
- Epidemiology-based Forecasting Model: This method uses epidemiology data gathered through various publications and from physicians to estimate population of patients, flow of treatment of individual disease and therapies. The data collected through this method includes statics on incidence of disease, population suffering from disease, and treatment population. This method is used to understand:
- Number of patients for particular device or medical procedure and
- Repeated use of particular device depending on health and condition of patient
- Capital-based Forecasting Model: This method of forecasting is based on number of replacements, installed-based and new sales of capital equipment used in various healthcare and diagnostic centers. These three parameters are calculated and forecast is developed. Installation base is calculated as average number of units per facility; while sales for particular year is calculated from number of new and replace units. Secondary data is collected through various supply chain intermediaries and opinion leaders to arrive at installation and sales rate. These techniques help our analysts in validating market and developed market estimates and forecast.
We do forecast on basis of several parameters such as market drivers, market opportunities, industry trends government regulations, raw materials supply and trade dynamics to ensure relevance of forecast with market scenario. With increasing need to granulized information, we used bottom-up methodology for forecasting where we evaluate each regional segment differently and combined all forecast to develop final market forecast.
Data Validation
We believe primary research is a very important tool in analyzing and forecasting different markets. In order to make sure accuracy of our findings, our team conducts primary interviews at every stage of research to gain deep insights into current business environment and future trends and key developments in market. This includes use of various methods such as telephonic interviews, focus groups, face to face interviews and questionnaires to validate our research from all aspects. We validate our data through primary research from key industry leaders such as CEO, product managers, marketing managers, suppliers, distributors, and consumers are frequently interviewed. These interviews provide valuable insights which help us to have better market understanding besides validating our estimates and forecast.
Data Triangulation
Industry Analysis
|
Qualitative Data |
Quantitative Data (2017-2025) |
|
|