.png)
Plastics Market by Product Type and Application - Global Industry Analysis and Forecast to 2027
Published On : September 2017 Pages : 93 Category: Plastics, Polymers & Resins Report Code : CM09221
SEGMENTS & REGIONS:
- Regions: North America, Europe, Asia- Pacific, Latin America, Middle East & Africa
Industry Trend Analysis
The plastics market was valued around USD billion in 2017 and is expected to reach roughly USD billion by the end of 2027 while registering itself at a compound annual growth rate (CAGR) of % during the forecast period, owing to various advantages of plastic materials. Plastics are a large array of synthetic or semi-synthetic natural solids which are molded or transformed into numerous useful products. Generally, plastics are natural polymers which occur sometimes naturally or developed from petrochemicals and have elevated molecular weights. Global plastic market is regularized by means of the end user market application. Due to their low price, the flexibility of use, accessibility to raw materials and ease of production, plastics have dismissed many traditional materials such as paper, wood, metal, glass, leather, and ceramic in the most of their applications. The rising demand for durable and sustainable products in a variety of end-user industries is fueling the demand for a range of plastics worldwide. The expansion of key end use industries, primarily construction and packaging and flexible characteristics of plastics involving pressure resistance and better heat, making them more appropriate for various industries. Unpredictable prices of major raw materials together with increasing environmental considerations concerning disposal of plastic are projected to hamper market growth during the forecast period. To conquer these challenges, the market industry has switched its focus towards producing bio-based options to petroleum-based conventional plastics. Key plastics producers have been developing JV and have been co-operating with biotechnology sector to unite their operations to produce bio-based plastics. Furthermore, future technologies to reprocess plastics for the fabricating plastics into textile stuff for a variety of end user products shows huge market opportunities. Major plastics producers from the western side of the globe have to concentrate on setting up production plants in high-growth regions like Asia Pacific and the Middle East. These regions together with rendering steady plastics demand also assist in cutting down the general cost of production. Regulative authority support to boost the FDI flow through financial incentives and tax benefits in nations such as India and China has been a major factor in market growth in Asia. Besides, these regions present low labor cost that further aids in cutting down the total production cost for manufacturers. Though, this switch has led into the overcapacity of numerous plastics products which have impacted their costs.
Product Outlook and Trend Analysis
The segmentation of the plastic products is depending upon the resin type such as polypropylene, polyethylene, PET, engineering thermoplastics, polystyrene, PVC, and others. These plastic products vary from one another concerning the monomers and molecular arrangement implicated in their production. The plastics products have extensive applications varying from space ship parts to manufacturing paper clips. In 2017, polyethylene has been recognized as the major product segment worldwide, reporting for % of the overall plastics manufactured globally. Rising demand from a variety of end user industries such as injection molding, food & beverage packaging, pipe, and film/sheet is measured to be the major driving factors for international polyethylene market. However, numerous environmental concerns and disposal policies are major challenges for global polyethylene market. However, polyethylene terephthalate (PET) is anticipated to be the fastest increasing product segment above the next few years with a compound annual growth rate (CAGR) of % over the forecast years.
Application Outlook and Trend Analysis
The plastics can be utilized in several end-user industries counting film/sheet, injection molding, pipes, construction, electrical & electronics and consumer appliances, automotive parts manufacture, textiles, food and beverage packaging among others. Growing Polyethylene terephthalate (PET) demand for sparkling drink packaging is projected to boost the demand for Polyethylene terephthalate (PET) during the next few years. Plastic products also have a wide variety of applications in electrical and automobile segment.
Regional Outlook and Trend Analysis
Asia Pacific regional market dominated the global plastics market and reported for % of overall market share in 2017. The expansion of major end use industry, predominantly in economies such as India and China, are likely to drive plastics demand in the region. North America and Europe are moderately established markets and are anticipated to grow at fairly lower rates than other high growth regions. European and North American plastics market are mainly stimulated by rising demand for environmental friendly and high-performance plastics materials like engineering thermoplastics and bio-based plastics. South & Central America is predicted to be the top growing market for plastic products with CAGR of % over forecast years. The growth of construction and automobile industry in Argentina and Brazil is anticipated to encourage the demand for plastic products in this region.
Competitive Outlook and Trend Analysis
The major players in the global plastic market include E. I. duPont de Nemours and Company, Saudi Basic Industries Corporation, Dow Chemicals and BASF SE. Other players in the plastic market are ExxonMobil, LyondellBasell, Formosa Plastics, Indorama Corp., Nan Ya Plastics, M&G Chemicals, DAK Americas, Octal Petrochem and Total SA.
The plastics market is segmented as follows –
By Product type
- Polypropylene (PP)
- PET
- Polyethylene (PE)
- PVC
- Engineering Plastics
- Polystyrene
By Application
- Film & Sheet
- Injection Molding
- Textiles
- Packaging
- Transportation
- Construction
By Region
- North America
- Canada
- U.S
- Mexico
- Europe
- Spain
- Germany
- UK
- France
- Italy
- Rest of Europe
- Asia-Pacific
- Japan
- India
- China
- Australia
- South Korea
- Rest of Asia Pacific
- Rest of the World
- Brazil
- United Arab Emirates
- South Africa
- Saudi Arabia
- Others
Some of the key questions answered by the report are:
- What was the market size in 2017 and forecast from 2022 to 2027?
- What will be the industry market growth from 2022 to 2027?
- What are the major drivers, restraints, opportunities, challenges, and industry trends and their impact on the market forecast?
- What are the major segments leading the market growth and why?
- Which are the leading players in the market and what are the major strategies adopted by them to sustain the market competition?
Market Classification
- Plastics Market, By Product Type, Estimates and Forecast, 2017-2027 ($Million)
- Polypropylene (PP)
- PET
- Polyethylene (PE)
- PVC
- Engineering Plastics
- Polystyrene
- Plastics Market, By Application, Estimates and Forecast, 2017-2027 ($Million)
- Film & Sheet
- Injection Molding
- Textiles
- Packaging
- Transportation
- Construction
- Plastics Market, By Region, Estimates and Forecast, 2017-2027 ($Million)
- North America
- North America Plastics Market, By Country
- North America Plastics Market, By Product Type
- North America Plastics Market, By Application
- U.S. Plastics Market, By Product Type
- U.S. Plastics Market, By Application
- Canada Plastics Market, By Product Type
- Canada Plastics Market, By Application
- Mexico Plastics Market, By Product Type
- Mexico Plastics Market, By Application
-
- Europe
- Europe Plastics Market, By Country
- Europe Plastics Market, By Product Type
- Europe Plastics Market, By Application
- Germany Plastics Market, By Product Type
- Germany Plastics Market, By Application
- France Plastics Market, By Product Type
- France Plastics Market, By Application
- UK Plastics Market, By Product Type
- UK Plastics Market, By Application
- Italy Plastics Market, By Product Type
- Italy Plastics Market, By Application
- Spain Plastics Market, By Product Type
- Spain Plastics Market, By Application
- Rest of Europe Plastics Market, By Product Type
- Rest of Europe Plastics Market, By Application
-
- Asia-Pacific
- Asia-Pacific Plastics Market, By Country
- Asia-Pacific Plastics Market, By Product Type
- Asia-Pacific Plastics Market, By Application
- Japan Plastics Market, By Product Type
- Japan Plastics Market, By Application
- Australia Plastics Market, By Product Type
- Australia Plastics Market, By Application
- India Plastics Market, By Product Type
- India Plastics Market, By Application
- South Korea Plastics Market, By Product Type
- South Korea Plastics Market, By Application
- Rest of Asia-Pacific Plastics Market, By Product Type
- Rest of Asia-Pacific Plastics Market, By Application
- Asia-Pacific
-
- Rest of the World
- Rest of the World Plastics Market, By Country
- Rest of the World Plastics Market, By Product Type
- Rest of the World Plastics Market, By Application
- Brazil Plastics Market, By Product Type
- Brazil Plastics Market, By Application
- South Africa Plastics Market, By Product Type
- South Africa Plastics Market, By Application
- Saudi Arabia Plastics Market, By Product Type
- Saudi Arabia Plastics Market, By Application
- Turkey Plastics Market, By Product Type
- Turkey Plastics Market, By Application
- United Arab Emirates Plastics Market, By Product Type
- United Arab Emirates Plastics Market, By Application
- Others Plastics Market, By Product Type
- Others Plastics Market, By Application
- Rest of the World
Table of Contents
1.Introduction
1.1.Report Description
1.2.Research Methodology
1.2.1. Secondary Research
1.2.2. Primary Research
2.Executive Summary
2.1.Key Highlights
3.Market Overview
3.1.Introduction
3.1.1. Market Definition
3.1.2. Market Segmentation
3.2.Market Share Analysis
3.3.Market Dynamics
3.3.1. Drivers
3.3.1.1.Rise in construction activities in emerging economies
3.3.1.2.Increasing Demand for Polyamides for 3d Printing
3.3.1.3.Amplified utilization of lightweight materials in automobiles
3.3.2. Restraints
3.3.2.1.Stringent environmental regulations
3.3.2.2.Competition From Other Polymers
3.3.3. Opportunities
3.3.3.1.Growing application of molded plastics in medical industry
3.4.Industry Trends
4.Plastics Market, By Product Type
4.1.Introduction
4.2.Plastics Market Assessment and Forecast, By Product Type, 2017-2027
4.3.Polypropylene (PP)
4.3.1. Market Assessment and Forecast, By Region, 2017-2027 ($Million)
4.4.PET
4.4.1. Market Assessment and Forecast, By Region, 2017-2027 ($Million)
4.5.Polyethylene (PE)
4.5.1. Market Assessment and Forecast, By Region, 2017-2027 ($Million)
4.6.PVC
4.6.1. Market Assessment and Forecast, By Region, 2017-2027 ($Million)
4.7.Engineering Plastics
4.7.1. Market Assessment and Forecast, By Region, 2017-2027 ($Million)
4.8.Polystyrene
4.8.1. Market Assessment and Forecast, By Region, 2017-2027 ($Million)
5.Plastics Market, By Application
5.1.Introduction
5.2.Plastics Market Assessment and Forecast, By Application, 2017-2027
5.3.Film & Sheet
5.3.1.1.Market Assessment and Forecast, By Region, 2017-2027 ($Million)
5.4.Injection Molding
5.4.1.1.Market Assessment and Forecast, By Region, 2017-2027 ($Million)
5.5.Textiles
5.5.1.1.Market Assessment and Forecast, By Region, 2017-2027 ($Million)
5.6.Packaging
5.6.1.1.Market Assessment and Forecast, By Region, 2017-2027 ($Million)
5.7.Transportation
5.7.1.1.Market Assessment and Forecast, By Region, 2017-2027 ($Million)
5.8.Construction
5.8.1.1.Market Assessment and Forecast, By Region, 2017-2027 ($Million)
6.Plastics Market, By Region
6.1.Introduction
6.2.Plastics Market Assessment and Forecast, By Region, 2017-2027 ($Million)
6.3.North America
6.3.1. Market Assessment and Forecast, By Country, 2017-2027 ($Million)
6.3.2. Market Assessment and Forecast, By Product Type, 2017-2027 ($Million)
6.3.3. Market Assessment and Forecast, By Application, 2017-2027 ($Million)
6.3.3.1.U.S.
6.3.3.1.1.Market Assessment and Forecast, By Product Type, 2017-2027 ($Million)
6.3.3.1.2.Market Assessment and Forecast, By Application, 2017-2027 ($Million)
6.3.3.2.Canada
6.3.3.2.1.Market Assessment and Forecast, By Product Type, 2017-2027 ($Million)
6.3.3.2.2.Market Assessment and Forecast, By Application, 2017-2027 ($Million)
6.3.3.3.Mexico
6.3.3.3.1.Market Assessment and Forecast, By Product Type, 2017-2027 ($Million)
6.3.3.3.2.Market Assessment and Forecast, By Application, 2017-2027 ($Million)
6.4.Europe
6.4.1. Market Assessment and Forecast, By Country, 2017-2027 ($Million)
6.4.2. Market Assessment and Forecast, By Product Type, 2017-2027 ($Million)
6.4.3. Market Assessment and Forecast, By Application, 2017-2027 ($Million)
6.4.3.1.Germany
6.4.3.1.1.Market Assessment and Forecast, By Product Type, 2017-2027 ($Million)
6.4.3.1.2.Market Assessment and Forecast, By Application, 2017-2027 ($Million)
6.4.3.2.France
6.4.3.2.1.Market Assessment and Forecast, By Product Type, 2017-2027 ($Million)
6.4.3.2.2.Market Assessment and Forecast, By Product Type, 2017-2027 ($Million)
6.4.3.3.UK
6.4.3.3.1.Market Assessment and Forecast, By Product Type, 2017-2027 ($Million)
6.4.3.3.2.Market Assessment and Forecast, By Application, 2017-2027 ($Million)
6.4.3.4.Italy
6.4.3.4.1.Market Assessment and Forecast, By Product Type, 2017-2027 ($Million)
6.4.3.4.2.Market Assessment and Forecast, By Application, 2017-2027 ($Million)
6.4.3.5.Spain
6.4.3.5.1.Market Assessment and Forecast, By Product Type, 2017-2027 ($Million)
6.4.3.5.2.Market Assessment and Forecast, By Application, 2017-2027 ($Million)
6.4.3.6.Russia
6.4.3.6.1.Market Assessment and Forecast, By Product Type, 2017-2027 ($Million)
6.4.3.6.2.Market Assessment and Forecast, By Application, 2017-2027 ($Million)
6.4.3.7.Rest of Europe
6.4.3.7.1.Market Assessment and Forecast, By Product Type, 2017-2027 ($Million)
6.4.3.7.2.Market Assessment and Forecast, By Application, 2017-2027 ($Million)
6.5.Asia-Pacific
6.5.1. Market Assessment and Forecast, By Country, 2017-2027 ($Million)
6.5.2. Market Assessment and Forecast, By Product Type, 2017-2027 ($Million)
6.5.3. Market Assessment and Forecast, By Application, 2017-2027 ($Million)
6.5.3.1.Japan
6.5.3.1.1.Market Assessment and Forecast, By Product Type, 2017-2027 ($Million)
6.5.3.1.2.Market Assessment and Forecast, By Application, 2017-2027 ($Million)
6.5.3.2.China
6.5.3.2.1.Market Assessment and Forecast, By Product Type, 2017-2027 ($Million)
6.5.3.2.2.Market Assessment and Forecast, By Application, 2017-2027 ($Million)
6.5.3.3.Australia
6.5.3.3.1.Market Assessment and Forecast, By Product Type, 2017-2027 ($Million)
6.5.3.3.2.Market Assessment and Forecast, By Application, 2017-2027 ($Million)
6.5.3.4.India
6.5.3.4.1.Market Assessment and Forecast, By Product Type, 2017-2027 ($Million)
6.5.3.4.2.Market Assessment and Forecast, By Application, 2017-2027 ($Million)
6.5.3.5.South Korea
6.5.3.5.1.Market Assessment and Forecast, By Product Type, 2017-2027 ($Million)
6.5.3.5.2.Market Assessment and Forecast, By Application, 2017-2027 ($Million)
6.5.3.6.Taiwan
6.5.3.6.1.Market Assessment and Forecast, By Product Type, 2017-2027 ($Million)
6.5.3.6.2.Market Assessment and Forecast, By Application, 2017-2027 ($Million)
6.5.3.7.Rest of Asia-Pacific
6.5.3.7.1.Market Assessment and Forecast, By Product Type, 2017-2027 ($Million)
6.5.3.7.2.Market Assessment and Forecast, By Application, 2017-2027 ($Million)
6.6.Rest of the World
6.6.1. Market Assessment and Forecast, By Country, 2017-2027 ($Million)
6.6.2. Market Assessment and Forecast, By Product Type, 2017-2027 ($Million)
6.6.3. Market Assessment and Forecast, By Application, 2017-2027 ($Million)
6.6.3.1.Brazil
6.6.3.1.1.Market Assessment and Forecast, By Product Type, 2017-2027 ($Million)
6.6.3.1.2.Market Assessment and Forecast, By Application, 2017-2027 ($Million)
6.6.3.2.Turkey
6.6.3.2.1.Market Assessment and Forecast, By Product Type, 2017-2027 ($Million)
6.6.3.2.2.Market Assessment and Forecast, By Application, 2017-2027 ($Million)
6.6.3.3.Saudi Arabia
6.6.3.3.1.Market Assessment and Forecast, By Product Type, 2017-2027 ($Million)
6.6.3.3.2.Market Assessment and Forecast, By Application, 2017-2027 ($Million)
6.6.3.4.South Africa
6.6.3.4.1.Market Assessment and Forecast, By Product Type, 2017-2027 ($Million)
6.6.3.4.2.Market Assessment and Forecast, By Application, 2017-2027 ($Million)
6.6.3.5.United Arab Emirates
6.6.3.5.1.Market Assessment and Forecast, By Product Type, 2017-2027 ($Million)
6.6.3.5.2.Market Assessment and Forecast, By Application, 2017-2027 ($Million)
6.6.3.6.Others
6.6.3.6.1.Market Assessment and Forecast, By Product Type, 2017-2027 ($Million)
6.6.3.6.2.Market Assessment and Forecast, By Application, 2017-2027 ($Million)
7.Company Profiles
7.1.BASF SE
7.1.1. Business Overview
7.1.2. Product Portfolio
7.1.3. Key Financials
7.1.4. Strategic Developments
7.2.Eastman Chemical Company
7.2.1. Business Overview
7.2.2. Product Portfolio
7.2.3. Key Financials
7.2.4. Strategic Developments
7.3.E. I. DU PONT DE NEMOURS AND COMPANY
7.3.1. Business Overview
7.3.2. Product Portfolio
7.3.3. Key Financials
7.3.4. Strategic Developments
7.4.CHEVRON PHILIPS CHEMICAL COMPANY
7.4.1. Business Overview
7.4.2. Product Portfolio
7.4.3. Key Financials
7.4.4. Strategic Developments
7.5.EXXON MOBIL CORPORATION
7.5.1. Business Overview
7.5.2. Product Portfolio
7.5.3. Key Financials
7.5.4. Strategic Developments
7.6.Huntsman International LLC.
7.6.1. Business Overview
7.6.2. Product Portfolio
7.6.3. Key Financials
7.6.4. Strategic Developments
7.7.INEOS GROUP AG
7.7.1. Business Overview
7.7.2. Product Portfolio
7.7.3. Key Financials
7.7.4. Strategic Developments
7.8.LYONDELLBASELL INDUSTRIES N.V.
7.8.1. Business Overview
7.8.2. Product Portfolio
7.8.3. Key Financials
7.8.4. Strategic Developments
7.9.SABIC
7.9.1. Business Overview
7.9.2. Product Portfolio
7.9.3. Key Financials
7.9.4. Strategic Developments
7.10.RELIANCE INDUSTRIES LIMITED
7.10.1.Business Overview
7.10.2.Product Portfolio
7.10.3.Key Financials
7.10.4.Strategic Developments
List of Tables
Table 1.Plastics Market, By Product Type ($Million), 2017-2025
Table 2.Polypropylene (PP) Market, By Region ($Million), 2017-2025
Table 3.PET Market, By Region ($Million), 2017-2025
Table 4.Polyethylene (PE) Market, By Region ($Million), 2017-2025
Table 5.PVC Market, By Region ($Million), 2017-2025
Table 6.Engineering Plastics Market, By Region ($Million), 2017-2025
Table 7.Polystyrene Market, By Region ($Million), 2017-2025
Table 8.lastics Market, By Application ($Million), 2017-2025
Table 9.Film & Sheet Market, By Region ($Million), 2017-2025
Table 10.Injection Molding Market, By Region ($Million), 2017-2025
Table 11.Textiles Market, By Region ($Million), 2017-2025
Table 12.Packaging Market, By Region ($Million), 2017-2025
Table 13.Transportation Market, By Region ($Million), 2017-2025
Table 14.Construction Market, By Region ($Million), 2017-2025
Table 15.Plastics Market, By Region ($Million), 2017-2025
Table 16.North America Plastics Market, By Country, 2017-2025 ($Million)
Table 17.North America Plastics Market, By Product Type, 2017-2025 ($Million)
Table 18.North America Plastics Market, By Application, 2017-2025 ($Million)
Table 19.U.S. Plastics Market, By Product Type, 2017-2025 ($Million)
Table 20.U.S. Plastics Market, By Application, 2017-2025 ($Million)
Table 21.Canada Plastics Market, By Product Type, 2017-2025 ($Million)
Table 22.Canada Plastics Market, By Application, 2017-2025 ($Million)
Table 23.Mexico Plastics Market, By Product Type, 2017-2025 ($Million)
Table 24.Mexico Plastics Market, By Application, 2017-2025 ($Million)
Table 25.Europe Plastics Market, By Country, 2017-2025 ($Million)
Table 26.Europe Plastics Market, By Product Type, 2017-2025 ($Million)
Table 27.Europe Plastics Market, By Application, 2017-2025 ($Million)
Table 28.Germany Plastics Market, By Product Type, 2017-2025 ($Million)
Table 29.Germany Plastics Market, By Application, 2017-2025 ($Million)
Table 30.France Plastics Market, By Product Type, 2017-2025 ($Million)
Table 31.France Plastics Market, By Application, 2017-2025 ($Million)
Table 32.UK Plastics Market, By Product Type, 2017-2025 ($Million)
Table 33.UK Plastics Market, By Application, 2017-2025 ($Million)
Table 34.Italy Plastics Market, By Product Type, 2017-2025 ($Million)
Table 35.Italy Plastics Market, By Application, 2017-2025 ($Million)
Table 36.Spain Plastics Market, By Product Type, 2017-2025 ($Million)
Table 37.Spain Plastics Market, By Application, 2017-2025 ($Million)
Table 38.Russia Plastics Market, By Product Type, 2017-2025 ($Million)
Table 39.Russia Plastics Market, By Application, 2017-2025 ($Million)
Table 40.Rest of Europe Plastics Market, By Product Type, 2017-2025 ($Million)
Table 41.Rest of Europe Plastics Market, By Application, 2017-2025 ($Million)
Table 42.Asia-Pacific Plastics Market, By Country, 2017-2025 ($Million)
Table 43.Asia-Pacific Plastics Market, By Product Type, 2017-2025 ($Million)
Table 44.Asia-Pacific Plastics Market, By Application, 2017-2025 ($Million)
Table 45.Japan Plastics Market, By Product Type, 2017-2025 ($Million)
Table 46.Japan Plastics Market, By Application, 2017-2025 ($Million)
Table 47.China Plastics Market, By Product Type, 2017-2025 ($Million)
Table 48.China Plastics Market, By Application, 2017-2025 ($Million)
Table 49.Australia Plastics Market, By Product Type, 2017-2025 ($Million)
Table 50.Australia Plastics Market, By Application, 2017-2025 ($Million)
Table 51.India Plastics Market, By Product Type, 2017-2025 ($Million)
Table 52.India Plastics Market, By Application, 2017-2025 ($Million)
Table 53.South Korea Plastics Market, By Product Type, 2017-2025 ($Million)
Table 54.South Korea Plastics Market, By Application, 2017-2025 ($Million)
Table 55.Taiwan Plastics Market, By Product Type, 2017-2025 ($Million)
Table 56.Taiwan Plastics Market, By Application, 2017-2025 ($Million)
Table 57.Rest of Asia-Pacific Plastics Market, By Product Type, 2017-2025 ($Million)
Table 58.Rest of Asia-Pacific Plastics Market, By Application, 2017-2025 ($Million)
Table 59.Rest of the World Plastics Market, By Country, 2017-2025 ($Million)
Table 60.Rest of the World Plastics Market, By Product Type, 2017-2025 ($Million)
Table 61.Rest of the World Plastics Market, By Application, 2017-2025 ($Million)
Table 62.Brazil Plastics Market, By Product Type, 2017-2025 ($Million)
Table 63.Brazil Plastics Market, By Application, 2017-2025 ($Million)
Table 64.Turkey Plastics Market, By Product Type, 2017-2025 ($Million)
Table 65.Turkey Plastics Market, By Application, 2017-2025 ($Million)
Table 66.Saudi Arabia Plastics Market, By Product Type, 2017-2025 ($Million)
Table 67.Saudi Arabia Plastics Market, By Application, 2017-2025 ($Million)
Table 68.South Africa Plastics Market, By Product Type, 2017-2025 ($Million)
Table 69.South Africa Plastics Market, By Application, 2017-2025 ($Million)
Table 70.United Arab Emirates Plastics Market, By Product Type, 2017-2025 ($Million)
Table 71.United Arab Emirates Plastics Market, By Application, 2017-2025 ($Million)
Table 72.Others Plastics Market, By Product Type, 2017-2025 ($Million)
Table 73.Others Plastics Market, By Application, 2017-2025 ($Million)
Table 74.BASF SE: Key Strategic Developments, 2017-2017
Table 75.Eastman Chemical Company: Key Strategic Developments, 2017-2017
Table 76.E. I. DU PONT DE NEMOURS AND COMPANY: Key Strategic Developments, 2017-2017
Table 77.CHEVRON PHILIPS CHEMICAL COMPANY: Key Strategic Developments, 2017-2017
Table 78.EXXON MOBIL CORPORATION: Key Strategic Developments, 2017-2017
Table 79.Huntsman International LLC.: Key Strategic Developments, 2017-2017
Table 80.INEOS GROUP AG: Key Strategic Developments, 2017-2017
Table 81.LYONDELLBASELL INDUSTRIES N.V.: Key Strategic Developments, 2017-2017
Table 82.SABIC: Key Strategic Developments, 2017-2017
Table 83.RELIANCE INDUSTRIES LIMITED: Key Strategic Developments, 2017-2017
List of Figures
Figure 1.Plastics Market Share, By Product Type, 2017 & 2025 ($Million)
Figure 2.Plastics Market, By Application, 2017 & 2025 ($Million)
Figure 3.Plastics Market, By Region, 2017, ($Million)
Figure 4.BASF SE: Net Revenues, 2017-2017 ($Million)
Figure 5.BASF SE: Net Revenue Share, By Segment, 2017
Figure 6.BASF SE: Net Revenue Share, By Geography, 2017
Figure 7.Eastman Chemical Company: Net Revenues, 2017-2017 ($Million)
Figure 8.Eastman Chemical Company: Net Revenue Share, By Segment, 2017
Figure 9.Eastman Chemical Company: Net Revenue Share, By Geography, 2017
Figure 10.E. I. DU PONT DE NEMOURS AND COMPANY: Net Revenues, 2017-2017 ($Million)
Figure 11.E. I. DU PONT DE NEMOURS AND COMPANY: Net Revenue Share, By Segment, 2017
Figure 12.E. I. DU PONT DE NEMOURS AND COMPANY: Net Revenue Share, By Geography, 2017
Figure 13.CHEVRON PHILIPS CHEMICAL COMPANY: Net Revenues, 2017-2017 ($Million)
Figure 14.CHEVRON PHILIPS CHEMICAL COMPANY: Net Revenue Share, By Segment, 2017
Figure 15.CHEVRON PHILIPS CHEMICAL COMPANY: Net Revenue Share, By Geography, 2017
Figure 16.EXXON MOBIL CORPORATION: Net Revenues, 2017-2017 ($Million)
Figure 17.EXXON MOBIL CORPORATION: Net Revenue Share, By Segment, 2017
Figure 18.EXXON MOBIL CORPORATION: Net Revenue Share, By Geography, 2017
Figure 19.Huntsman International LLC.: Net Revenues, 2017-2017 ($Million)
Figure 20.Huntsman International LLC.: Net Revenue Share, By Segment, 2017
Figure 21.Huntsman International LLC.: Net Revenue Share, By Geography, 2017
Figure 22.INEOS GROUP AG: Net Revenues, 2017-2017 ($Million)
Figure 23.INEOS GROUP AG: Net Revenue Share, By Segment, 2017
Figure 24.INEOS GROUP AG: Net Revenue Share, By Geography, 2017
Figure 25.LYONDELLBASELL INDUSTRIES N.V.: Net Revenues, 2017-2017 ($Million)
Figure 26.LYONDELLBASELL INDUSTRIES N.V.: Net Revenue Share, By Segment, 2017
Figure 27.LYONDELLBASELL INDUSTRIES N.V.: Net Revenue Share, By Geography, 2017
Figure 28.SABIC: Net Revenues, 2017-2017 ($Million)
Figure 29.SABIC: Net Revenue Share, By Segment, 2017
Figure 30.SABIC: Net Revenue Share, By Geography, 2017
Figure 31.RELIANCE INDUSTRIES LIMITED: Net Revenues, 2017-2017 ($Million)
Figure 32.RELIANCE INDUSTRIES LIMITED: Net Revenue Share, By Segment, 2017
Figure 33.RELIANCE INDUSTRIES LIMITED: Net Revenue Share, By Geography, 2017
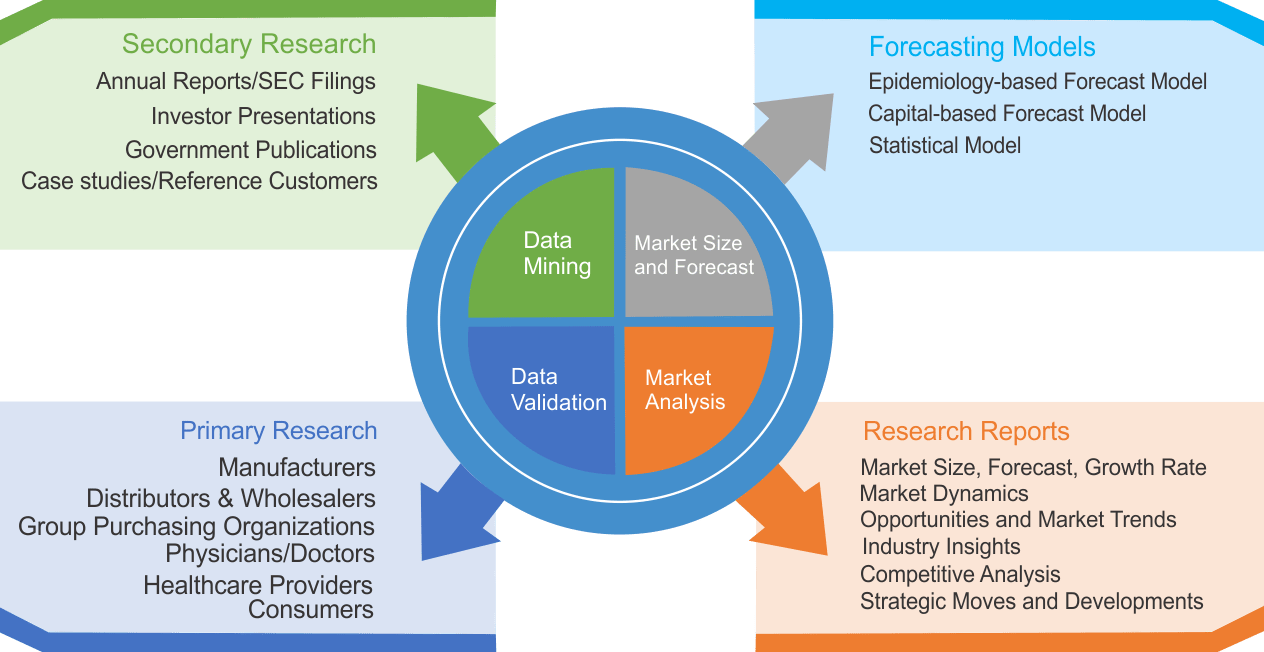
Research Methodology
We use both primary as well as secondary research for our market surveys, estimates and for developing forecast. Our research process commence by analyzing the problem which enable us to design the scope for our research study. Our research process is uniquely designed with enough flexibility to adjust according to changing nature of products and markets, while retaining core element to ensure reliability and accuracy in research findings. We understand both macro and micro-economic factors to evaluate and forecast different market segments.
Data Mining
Data is extensively collected through various secondary sources such as annual reports, investor presentations, SEC filings, and other corporate publications. We also refer trade magazines, technical journals, paid databases such as Factiva and Bloomberg, industry trade journals, scientific journals, and social media data to understand market dynamics and industry trends. Further, we also conduct primary research to understand market drivers, restraints, opportunities, challenges, and competitive scenario to build our analysis.
Data Collection Matrix
|
Data Collection Matrix |
Supply Side |
Demand Side |
|
Primary Data Sources |
|
|
|
Secondary Data Sources |
|
|
Market Modeling and Forecasting
We use epidemiology and capital equipment-based models to forecast market size of different segments at country and regional level.
- Epidemiology-based Forecasting Model: This method uses epidemiology data gathered through various publications and from physicians to estimate population of patients, flow of treatment of individual disease and therapies. The data collected through this method includes statics on incidence of disease, population suffering from disease, and treatment population. This method is used to understand:
- Number of patients for particular device or medical procedure and
- Repeated use of particular device depending on health and condition of patient
- Capital-based Forecasting Model: This method of forecasting is based on number of replacements, installed-based and new sales of capital equipment used in various healthcare and diagnostic centers. These three parameters are calculated and forecast is developed. Installation base is calculated as average number of units per facility; while sales for particular year is calculated from number of new and replace units. Secondary data is collected through various supply chain intermediaries and opinion leaders to arrive at installation and sales rate. These techniques help our analysts in validating market and developed market estimates and forecast.
We do forecast on basis of several parameters such as market drivers, market opportunities, industry trends government regulations, raw materials supply and trade dynamics to ensure relevance of forecast with market scenario. With increasing need to granulized information, we used bottom-up methodology for forecasting where we evaluate each regional segment differently and combined all forecast to develop final market forecast.
Data Validation
We believe primary research is a very important tool in analyzing and forecasting different markets. In order to make sure accuracy of our findings, our team conducts primary interviews at every stage of research to gain deep insights into current business environment and future trends and key developments in market. This includes use of various methods such as telephonic interviews, focus groups, face to face interviews and questionnaires to validate our research from all aspects. We validate our data through primary research from key industry leaders such as CEO, product managers, marketing managers, suppliers, distributors, and consumers are frequently interviewed. These interviews provide valuable insights which help us to have better market understanding besides validating our estimates and forecast.
Data Triangulation
Industry Analysis
|
Qualitative Data |
Quantitative Data (2017-2025) |
|
|