.png)
Pharmaceutical Packaging Equipment Market by Product and Package Type - Global Industry Analysis and Forecast to 2027
Published On : May 2022 Pages : 99 Category: Pharmaceuticals Report Code : HC0639
SEGMENTS & REGIONS:
- Regions: North America, Europe, Asia- Pacific, Latin America, Middle East & Africa
Industry Trend Analysis
The global pharmaceutical packaging equipment market is expected to be around $10.5 billion by 2027. Technological advancements related to labeling, increase in demand for flexible packaging equipment, increase in the generic drugs market are set to drive the market growth. Furthermore, stringent regulations imposed by FDA regarding methods and material used for packaging will drive the market during forecast period. However, increasing use of refurbished packaging equipment and high cost of packaging equipment is expected to hinder the market growth.
Product Outlook and Trend Analysis
The liquid packaging equipment segment accounted for major share of the overall market in 2017. This major share can be attributed to factors such as increasing demand for automation in packaging and rise in demand for liquid doses for filling liquid products.
Package Outlook and Trend Analysis
The primary packaging segment held the major share of the overall market in 2017 and is expected to maintain its lead during the forecast period, owing to increase in need for unit dosage forms. The aseptic filling and sealing equipment segment dominated the primary packaging equipment market in 2017. However, other packaging equipment segment is expected to witness high growth during the forecast period owing to increase utilization of this equipment for packaging of products such as contact lenses, blood plasma and other vital pharma products.
Regional Outlook and Trend Analysis
North America accounted for the major share of the overall market in 2017. This large share can be attributed to factors such as increase in R&D expenditure, constantly increasing investments, existence of major pharmaceutical companies, and high adoption rate of technologically advanced packaging materials. Asia-Pacific is expected to grow at highest rate throughout the forecast period owing to increasing geriatric population, growing manufacturing activities in these region, and rapid growth and development in pharmaceutical sector.
Competitive Analysis
Key players operating in this market include Romaco Pharmatechnik, Körber AG, OPTIMA Packaging Group, I.M.A. Industria Macchine Automatiche, Uhlmann-Group, MULTIVAC, Marchesini Group, MG2, Robert Bosch, and Bausch & Ströbel Maschinenfabrik ilshofen Gmbh Co. Kg.
Market Opportunities
Rapidly evolving pharmaceutical market will provide lucrative growth opportunities for players. Introduction of innovative technologies such as blow fill seal technology which is used to produce small and large volume liquid containers is set to drive the market over the next six years. Majority of players are focusing on enhancing drug protection and ease of drug delivery to patients. For instance, in October 2017, Ecobliss launched Locked4kids packaging, a child protection solution to pharma packaging. Furthermore, stringent regulatory compliance will force substitution of older equipment used for packaging, which will further increase demand for advanced packaging equipment.
Pharmaceutical Packaging Equipment Market Segmentation
By Product:
- Solids Packaging Equipment
- Tablet Packaging Equipment
- Powder Packaging Equipment
- Capsule Packaging Equipment
- Semi-Solids Packaging Equipment
- Cream Packaging Equipment
- Ointment Packaging Equipment
- Liquids Packaging Equipment
- Syrup Packaging Equipment
- Aerosol Packaging Equipment
- Eye/Ear Drop Packaging Equipment
By Package Type:
- Primary Packaging Equipment
- Blister Packaging Equipment
- Soft Tube Filling and Sealing Equipment
- Bottle Filling and Capping Equipment
- Sachet Packaging Equipment
- Aseptic Filling and Sealing Equipment
- Others
- Secondary Packaging Equipment
- Wrapping Equipment
- Case Packaging Equipment
- Cartooning Equipment
- Others
By Region:
- North America
- U.S
- Canada
- Mexico
- Europe
- Germany
- France
- UK
- Italy
- Spain
- Rest of Europe
- Asia-Pacific
- Japan
- China
- Australia
- India
- South Korea
- Rest of Asia-Pacific
- Rest of the World
- Brazil
- South Africa
- Saudi Arabia
- Turkey
- United Arab Emirates
- Others
Some of the key questions answered by the report are:
- What was the market size in 2017 and forecast from 2022 to 2027?
- What will be the industry market growth from 2022 to 2027?
- What are the major drivers, restraints, opportunities, challenges, and industry trends and their impact on the market forecast?
- What are the major segments leading the market growth and why?
- Which are the leading players in the market and what are the major strategies adopted by them to sustain the market competition?
Market Classification
- Pharmaceutical Packaging Equipment Market, By Product, Estimates and Forecast, 2017-2027 ($Million)
- Solids Packaging Equipment
- Tablet Packaging Equipment
- Powder Packaging Equipment
- Capsule Packaging Equipment
- Semi-Solids Packaging Equipment
- Cream Packaging Equipment
- Ointment Packaging Equipment
- Liquids Packaging Equipment
- Syrup Packaging Equipment
- Aerosol Packaging Equipment
- Eye/Ear Drop Packaging Equipment
- Pharmaceutical Packaging Equipment Market, By Package Type, Estimates and Forecast, 2017-2027 ($Million)
- Primary Packaging Equipment
- Blister Packaging Equipment
- Soft Tube Filling and Sealing Equipment
- Bottle Filling and Capping Equipment
- Sachet Packaging Equipment
- Aseptic Filling and Sealing Equipment
- Others
- Secondary Packaging Equipment
- Wrapping Equipment
- Case Packaging Equipment
- Cartooning Equipment
- Others
- Pharmaceutical Packaging Equipment Market, By Region, Estimates and Forecast, 2017-2027 ($Million)
- North America
- North America Pharmaceutical Packaging Equipment Market, By Country
- North America Pharmaceutical Packaging Equipment Market, By Product
- North America Pharmaceutical Packaging Equipment Market, By Package Type
- U.S. Pharmaceutical Packaging Equipment Market, By Product
- U.S. Pharmaceutical Packaging Equipment Market, By Package Type
- Canada Pharmaceutical Packaging Equipment Market, By Product
- Canada Pharmaceutical Packaging Equipment Market, By Package Type
- Mexico Pharmaceutical Packaging Equipment Market, By Product
- Mexico Pharmaceutical Packaging Equipment Market, By Package Type
-
- Europe
- Europe Pharmaceutical Packaging Equipment Market, By Country
- Europe Pharmaceutical Packaging Equipment Market, By Product
- Europe Pharmaceutical Packaging Equipment Market, By Package Type
- Germany Pharmaceutical Packaging Equipment Market, By Product
- Germany Pharmaceutical Packaging Equipment Market, By Package Type
- France Pharmaceutical Packaging Equipment Market, By Product
- France Pharmaceutical Packaging Equipment Market, By Package Type
- UK Pharmaceutical Packaging Equipment Market, By Product
- UK Pharmaceutical Packaging Equipment Market, By Package Type
- Italy Pharmaceutical Packaging Equipment Market, By Product
- Italy Pharmaceutical Packaging Equipment Market, By Package Type
- Spain Pharmaceutical Packaging Equipment Market, By Product
- Spain Pharmaceutical Packaging Equipment Market, By Package Type
- Rest of Europe Pharmaceutical Packaging Equipment Market, By Product
- Rest of Europe Pharmaceutical Packaging Equipment Market, By Package Type
-
- Asia-Pacific
- Asia-Pacific Pharmaceutical Packaging Equipment Market, By Country
- Asia-Pacific Pharmaceutical Packaging Equipment Market, By Product
- Asia-Pacific Pharmaceutical Packaging Equipment Market, By Package Type
- Japan Pharmaceutical Packaging Equipment Market, By Product
- Japan Pharmaceutical Packaging Equipment Market, By Package Type
- China Pharmaceutical Packaging Equipment Market, By Product
- China Pharmaceutical Packaging Equipment Market, By Package Type
- Australia Pharmaceutical Packaging Equipment Market, By Product
- Australia Pharmaceutical Packaging Equipment Market, By Package Type
- India Pharmaceutical Packaging Equipment Market, By Product
- India Pharmaceutical Packaging Equipment Market, By Package Type
- South Korea Pharmaceutical Packaging Equipment Market, By Product
- South Korea Pharmaceutical Packaging Equipment Market, By Package Type
- Rest of Asia-Pacific Pharmaceutical Packaging Equipment Market, By Product
- Rest of Asia-Pacific Pharmaceutical Packaging Equipment Market, By Package Type
- Asia-Pacific
-
- Rest of the World
- Rest of the World Pharmaceutical Packaging Equipment Market, By Country
- Rest of the World Pharmaceutical Packaging Equipment Market, By Product
- Rest of the World Pharmaceutical Packaging Equipment Market, By Package Type
- Brazil Pharmaceutical Packaging Equipment Market, By Product
- Brazil Pharmaceutical Packaging Equipment Market, By Package Type
- South Africa Pharmaceutical Packaging Equipment Market, By Product
- South Africa Pharmaceutical Packaging Equipment Market, By Package Type
- Saudi Arabia Pharmaceutical Packaging Equipment Market, By Product
- Saudi Arabia Pharmaceutical Packaging Equipment Market, By Package Type
- Turkey Pharmaceutical Packaging Equipment Market, By Product
- Turkey Pharmaceutical Packaging Equipment Market, By Package Type
- United Arab Emirates Pharmaceutical Packaging Equipment Market, By Product
- United Arab Emirates Pharmaceutical Packaging Equipment Market, By Package Type
- Others Pharmaceutical Packaging Equipment Market, By Product
- Others Pharmaceutical Packaging Equipment Market, By Package Type
- Rest of the World
Table of Contents
1. Introduction
1.1. Report Description
1.2. Research Methodology
1.2.1. Secondary Research
1.2.2. Primary Research
2. Executive Summary
2.1. Key Highlights
3. Market Overview
3.1. Introduction
3.1.1. Market Definition
3.1.2. Market Segmentation
3.2. Market Share Analysis
3.3. Market Dynamics
3.3.1. Drivers
3.3.1.1. Technological Advancements Related to Labeling
3.3.1.2. Rising Contract Manufacturing
3.3.1.3. High Accuracy
3.3.1.4. Increase in the Generic Drugs Market
3.3.2. Restraints
3.3.2.1. Growing Adoption of Refurbished Packaging Equipment
3.3.2.2. High Cost of Equipment
3.3.3. Opportunities
3.3.3.1. Emerging Markets to Offer Lucrative Growth Opportunities
3.4. Industry Trends
4. Pharmaceutical Packaging Equipment Market, By Product
4.1. Introduction
4.2. Pharmaceutical Packaging Equipment Market Assessment and Forecast, By Product, 2017-2027
4.3. Solids Packaging Equipment
4.3.1. Market Assessment and Forecast, By Type, 2017-2027 ($Million)
4.3.2. Market Assessment and Forecast, By Region, 2017-2027 ($Million)
4.3.3. Tablet Packaging Equipment
4.3.3.1. Market Assessment and Forecast, By Region, 2017-2027 ($Million).
4.3.4. Powder Packaging Equipment
4.3.4.1. Market Assessment and Forecast, By Region, 2017-2027 ($Million).
4.3.5. Capsule Packaging Equipment
4.3.5.1. Market Assessment and Forecast, By Region, 2017-2027 ($Million).
4.4. Semi-Solids Packaging Equipment
4.4.1. Market Assessment and Forecast, By Type, 2017-2027 ($Million)
4.4.2. Market Assessment and Forecast, By Region, 2017-2027 ($Million)
4.4.3. Cream Packaging Equipment
4.4.3.1. Market Assessment and Forecast, By Region, 2017-2027 ($Million).
4.4.4. Ointment Packaging Equipment
4.4.4.1. Market Assessment and Forecast, By Region, 2017-2027 ($Million).
4.5. Liquids Packaging Equipment
4.5.1. Market Assessment and Forecast, By Type, 2017-2027 ($Million)
4.5.2. Market Assessment and Forecast, By Region, 2017-2027 ($Million)
4.5.3. Syrup Packaging Equipment
4.5.3.1. Market Assessment and Forecast, By Region, 2017-2027 ($Million)
4.5.4. Aerosol Packaging Equipment
4.5.4.1. Market Assessment and Forecast, By Region, 2017-2027 ($Million)
4.5.5. Eye/Ear Drop Packaging Equipment
4.5.5.1. Market Assessment and Forecast, By Region, 2017-2027 ($Million)
5. Pharmaceutical Packaging Equipment Market, By Package Type
5.1. Introduction
5.2. Pharmaceutical Packaging Equipment Market Assessment and Forecast, By Package Type, 2017-2027
5.3. Primary Packaging Equipment
5.3.1. Market Assessment and Forecast, By Type, 2017-2027 ($Million)
5.3.2. Market Assessment and Forecast, By Region, 2017-2027 ($Million)
5.3.3. Aseptic Filling and Sealing Equipment
5.3.3.1. Market Assessment and Forecast, By Region, 2017-2027 ($Million)
5.3.4. Bottle Filling and Capping Equipment
5.3.4.1. Market Assessment and Forecast, By Region, 2017-2027 ($Million)
5.3.5. Blister Packaging Equipment
5.3.5.1. Market Assessment and Forecast, By Region, 2017-2027 ($Million)
5.3.6. Soft Tube Filling and Sealing Equipment
5.3.6.1. Market Assessment and Forecast, By Region, 2017-2027 ($Million)
5.3.7. Sachet Packaging Equipment
5.3.7.1. Market Assessment and Forecast, By Region, 2017-2027 ($Million)
5.3.8. Others
5.3.8.1. Market Assessment and Forecast, By Region, 2017-2027 ($Million)
5.4. Secondary Packaging Equipment
5.4.1. Market Assessment and Forecast, By Type, 2017-2027 ($Million)
5.4.2. Market Assessment and Forecast, By Region, 2017-2027 ($Million)
5.4.3. Cartoning Equipment
5.4.3.1. Market Assessment and Forecast, By Region, 2017-2027 ($Million)
5.4.4. Case Packaging Equipment
5.4.4.1. Market Assessment and Forecast, By Region, 2017-2027 ($Million)
5.4.5. Wrapping Equipment
5.4.5.1. Market Assessment and Forecast, By Region, 2017-2027 ($Million)
5.4.6. Others
5.4.6.1. Market Assessment and Forecast, By Region, 2017-2027 ($Million)
6. Pharmaceutical Packaging Equipment Devices Market, By Region
6.1. Introduction
6.2. Pharmaceutical Packaging Equipment Market Assessment and Forecast, By Region, 2017-2027 ($Million)
6.3. North America
6.3.1. Market Assessment and Forecast, By Country, 2017-2027 ($Million)
6.3.2. Market Assessment and Forecast, By Product, 2017-2027 ($Million)
6.3.3. Market Assessment and Forecast, By Package Type, 2017-2027 ($Million)
6.3.3.1. U.S.
6.3.3.1.1. Market Assessment and Forecast, By Product, 2017-2027 ($Million)
6.3.3.1.2. Market Assessment and Forecast, By Package Type, 2017-2027 ($Million)
6.3.3.2. Canada
6.3.3.2.1. Market Assessment and Forecast, By Product, 2017-2027 ($Million)
6.3.3.2.2. Market Assessment and Forecast, By Package Type, 2017-2027 ($Million)
6.3.3.3. Mexico
6.3.3.3.1. Market Assessment and Forecast, By Product, 2017-2027 ($Million)
6.3.3.3.2. Market Assessment and Forecast, By Package Type, 2017-2027 ($Million)
6.4. Europe
6.4.1. Market Assessment and Forecast, By Country, 2017-2027 ($Million)
6.4.2. Market Assessment and Forecast, By Product, 2017-2027 ($Million)
6.4.3. Market Assessment and Forecast, By Package Type, 2017-2027 ($Million)
6.4.3.1. Germany
6.4.3.1.1. Market Assessment and Forecast, By Product, 2017-2027 ($Million)
6.4.3.1.2. Market Assessment and Forecast, By Package Type, 2017-2027 ($Million)
6.4.3.2. France
6.4.3.2.1. Market Assessment and Forecast, By Product, 2017-2027 ($Million)
6.4.3.2.2. Market Assessment and Forecast, By Package Type, 2017-2027 ($Million)
6.4.3.3. UK
6.4.3.3.1. Market Assessment and Forecast, By Product, 2017-2027 ($Million)
6.4.3.3.2. Market Assessment and Forecast, By Package Type, 2017-2027 ($Million)
6.4.3.4. Italy
6.4.3.4.1. Market Assessment and Forecast, By Product, 2017-2027 ($Million)
6.4.3.4.2. Market Assessment and Forecast, By Package Type, 2017-2027 ($Million)
6.4.3.5. Spain
6.4.3.5.1. Market Assessment and Forecast, By Product, 2017-2027 ($Million)
6.4.3.5.2. Market Assessment and Forecast, By Package Type, 2017-2027 ($Million)
6.4.3.6. Russia
6.4.3.6.1. Market Assessment and Forecast, By Product, 2017-2027 ($Million)
6.4.3.6.2. Market Assessment and Forecast, By Package Type, 2017-2027 ($Million)
6.4.3.7. Rest of Europe
6.4.3.7.1. Market Assessment and Forecast, By Product, 2017-2027 ($Million)
6.4.3.7.2. Market Assessment and Forecast, By Package Type, 2017-2027 ($Million)
6.5. Asia-Pacific
6.5.1. Market Assessment and Forecast, By Country, 2017-2027 ($Million)
6.5.2. Market Assessment and Forecast, By Product, 2017-2027 ($Million)
6.5.3. Market Assessment and Forecast, By Package Type, 2017-2027 ($Million)
6.5.3.1. Japan
6.5.3.1.1. Market Assessment and Forecast, By Product, 2017-2027 ($Million)
6.5.3.1.2. Market Assessment and Forecast, By Package Type, 2017-2027 ($Million)
6.5.3.2. China
6.5.3.2.1. Market Assessment and Forecast, By Product, 2017-2027 ($Million)
6.5.3.2.2. Market Assessment and Forecast, By Package Type, 2017-2027 ($Million)
6.5.3.3. Australia
6.5.3.3.1. Market Assessment and Forecast, By Product, 2017-2027 ($Million)
6.5.3.3.2. Market Assessment and Forecast, By Package Type, 2017-2027 ($Million)
6.5.3.4. India
6.5.3.4.1. Market Assessment and Forecast, By Product, 2017-2027 ($Million)
6.5.3.4.2. Market Assessment and Forecast, By Package Type, 2017-2027 ($Million)
6.5.3.5. South Korea
6.5.3.5.1. Market Assessment and Forecast, By Product, 2017-2027 ($Million)
6.5.3.5.2. Market Assessment and Forecast, By Package Type, 2017-2027 ($Million)
6.5.3.6. Taiwan
6.5.3.6.1. Market Assessment and Forecast, By Product, 2017-2027 ($Million)
6.5.3.6.2. Market Assessment and Forecast, By Package Type, 2017-2027 ($Million)
6.5.3.7. Rest of Asia-Pacific
6.5.3.7.1. Market Assessment and Forecast, By Product, 2017-2027 ($Million)
6.5.3.7.2. Market Assessment and Forecast, By Package Type, 2017-2027 ($Million)
6.6. Rest of the World
6.6.1. Market Assessment and Forecast, By Country, 2017-2027 ($Million)
6.6.2. Market Assessment and Forecast, By Product, 2017-2027 ($Million)
6.6.3. Market Assessment and Forecast, By Package Type, 2017-2027 ($Million)
6.6.3.1. Brazil
6.6.3.1.1. Market Assessment and Forecast, By Product, 2017-2027 ($Million)
6.6.3.1.2. Market Assessment and Forecast, By Package Type, 2017-2027 ($Million)
6.6.3.2. Saudi Arabia
6.6.3.2.1. Market Assessment and Forecast, By Product, 2017-2027 ($Million)
6.6.3.2.2. Market Assessment and Forecast, By Package Type, 2017-2027 ($Million)
6.6.3.3. South Africa
6.6.3.3.1. Market Assessment and Forecast, By Product, 2017-2027 ($Million)
6.6.3.3.2. Market Assessment and Forecast, By Package Type, 2017-2027 ($Million)
6.6.3.4. United Arab Emirates
6.6.3.4.1. Market Assessment and Forecast, By Product, 2017-2027 ($Million)
6.6.3.4.2. Market Assessment and Forecast, By Package Type, 2017-2027 ($Million)
6.6.3.5. Others
6.6.3.5.1. Market Assessment and Forecast, By Product, 2017-2027 ($Million)
6.6.3.5.2. Market Assessment and Forecast, By Package Type, 2017-2027 ($Million)
7. Company Profiles
7.1. Körber AG
7.1.1. Business Overview
7.1.2. Product Portfolio
7.1.3. Key Financials
7.1.4. Strategic Developments
7.2. Uhlmann-Group
7.2.1. Business Overview
7.2.2. Product Portfolio
7.2.3. Key Financials
7.2.4. Strategic Developments
7.3. Romaco Pharmatechnik GmbH
7.3.1. Business Overview
7.3.2. Product Portfolio
7.3.3. Key Financials
7.3.4. Strategic Developments
7.4. I.M.A. Industria Macchine Automatiche S.p.A.
7.4.1. Business Overview
7.4.2. Product Portfolio
7.4.3. Key Financials
7.4.4. Strategic Developments
7.5. MULTIVAC
7.5.1. Business Overview
7.5.2. Product Portfolio
7.5.3. Key Financials
7.5.4. Strategic Developments
7.6. Marchesini Group S.p.A.
7.6.1. Business Overview
7.6.2. Product Portfolio
7.6.3. Key Financials
7.6.4. Strategic Developments
7.7. Robert Bosch Gmbh
7.7.1. Business Overview
7.7.2. Product Portfolio
7.7.3. Key Financials
7.7.4. Strategic Developments
7.8. MG2 s.r.l
7.8.1. Business Overview
7.8.2. Product Portfolio
7.8.3. Key Financials
7.8.4. Strategic Developments
7.9. OPTIMA packaging group GmbH
7.9.1. Business Overview
7.9.2. Product Portfolio
7.9.3. Key Financials
7.9.4. Strategic Developments
7.10. Bausch & Ströbel Maschinenfabrik ilshofen Gmbh Co. Kg.
7.10.1. Business Overview
7.10.2. Product Portfolio
7.10.3. Key Financials
7.10.4. Strategic Developments
List of Tables
Table 1.Global Pharmaceutical Packaging Equipment Market, By Product ($Million), 2017-2025
Table 2.Solids Packaging Equipment Market, By Type ($Million), 2017-2025
Table 3.Solids Packaging Equipment Market, By Region ($Million), 2017-2025
Table 4.Tablet Packaging Equipment Market, By Region ($Million), 2017-2025
Table 5.Capsule Packaging Equipment Market, By Region ($Million), 2017-2025
Table 6.Powder Packaging Equipment Market, By Region ($Million), 2017-2025
Table 7.Semi-Solids Packaging Equipment Market, By Type ($Million), 2017-2025
Table 8.Semi-Solids Packaging Equipment Market, By Region ($Million), 2017-2025
Table 9.Ointment Packaging Equipment Market, By Region ($Million), 2017-2025
Table 10.Cream Packaging Equipment Market, By Region ($Million), 2017-2025
Table 11.Liquids Packaging Equipment Market, By Type ($Million), 2017-2025
Table 12.Liquids Packaging Equipment Market, By Type ($Million), 2017-2025
Table 13.Eye/Ear Drop Packaging Equipment Market, By Region ($Million), 2017-2025
Table 14.Aerosol Packaging Equipment Market, By Region ($Million), 2017-2025
Table 15.Syrup Packaging Equipment Market, By Region ($Million), 2017-2025
Table 16.Global Pharmaceutical Packaging Equipment Market, By Packages Types ($Million), 2017-2025
Table 17.Primary Packaging Equipment Market, By Type ($Million), 2017-2025
Table 18.Primary Packaging Equipment Market, By Region ($Million), 2017-2025
Table 19.Aseptic Filling and Sealing Equipment Market, By Region ($Million), 2017-2025
Table 20.Bottle Filling and Capping Equipment Market, By Region ($Million), 2017-2025
Table 21.Blister Packaging Equipment Market, By Region ($Million), 2017-2025
Table 22.Soft Tube Filling and Sealing Equipment Market, By Region ($Million), 2017-2025
Table 23.Sachet Packaging Equipment Market, By Region ($Million), 2017-2025
Table 24.Other Market, By Region ($Million), 2017-2025
Table 25.Secondary Packaging Equipment Market, By Type ($Million), 2017-2025
Table 26.Secondary Packaging Equipment Market, By Region ($Million), 2017-2025
Table 27.Cartoning Equipment Market, By Region ($Million), 2017-2025
Table 28.Case Packaging Equipment Market, By Region ($Million), 2017-2025
Table 29.Wrapping Equipment Market, By Region ($Million), 2017-2025
Table 30.Other Market, By Region ($Million), 2017-2025
Table 31.Pharmaceutical Packaging Equipment Market, By Region, 2017-2025 ($Million)
Table 32.North America Pharmaceutical Packaging Equipment Market, By Country, 2017-2025 ($Million)
Table 33.North America Pharmaceutical Packaging Equipment Market, By Product, 2017-2025 ($Million)
Table 34.North America Pharmaceutical Packaging Equipment Market, By Package Type, 2017-2025 ($Million)
Table 35.U.S. Pharmaceutical Packaging Equipment Market, By Product, 2017-2025 ($Million)
Table 36.U.S. Pharmaceutical Packaging Equipment Market, By Package Type, 2017-2025 ($Million)
Table 37.Canada Pharmaceutical Packaging Equipment Market, By Product, 2017-2025 ($Million)
Table 38.Canada Pharmaceutical Packaging Equipment Market, By Package Type, 2017-2025 ($Million)
Table 39.Mexico Pharmaceutical Packaging Equipment Market, By Product, 2017-2025 ($Million)
Table 40.Mexico Pharmaceutical Packaging Equipment Market, By Package Type, 2017-2025 ($Million)
Table 41.Europe Pharmaceutical Packaging Equipment Market, By Country, 2017-2025 ($Million)
Table 42.Europe Pharmaceutical Packaging Equipment Market, By Product, 2017-2025 ($Million)
Table 43.Europe Pharmaceutical Packaging Equipment Market, By Package Type, 2017-2025 ($Million)
Table 44.Germany Pharmaceutical Packaging Equipment Market, By Product, 2017-2025 ($Million)
Table 45.Germany Pharmaceutical Packaging Equipment Market, By Package Type, 2017-2025 ($Million)
Table 46.France Pharmaceutical Packaging Equipment Market, By Product, 2017-2025 ($Million)
Table 47.France Pharmaceutical Packaging Equipment Market, By Package Type, 2017-2025 ($Million)
Table 48.UK Pharmaceutical Packaging Equipment Market, By Product, 2017-2025 ($Million)
Table 49.UK Pharmaceutical Packaging Equipment Market, By Package Type, 2017-2025 ($Million)
Table 50.Italy Pharmaceutical Packaging Equipment Market, By Product, 2017-2025 ($Million)
Table 51.Italy Pharmaceutical Packaging Equipment Market, By Package Type, 2017-2025 ($Million)
Table 52.Spain Pharmaceutical Packaging Equipment Market, By Product, 2017-2025 ($Million)
Table 53.Spain Pharmaceutical Packaging Equipment Market, By Package Type, 2017-2025 ($Million)
Table 54.Rest of Europe Pharmaceutical Packaging Equipment Market, By Product, 2017-2025 ($Million)
Table 55.Rest of Europe Pharmaceutical Packaging Equipment Market, By Package Type, 2017-2025 ($Million)
Table 56.Asia-Pacific Pharmaceutical Packaging Equipment Market, By Country, 2017-2025 ($Million)
Table 57.Asia-Pacific Pharmaceutical Packaging Equipment Market, By Product, 2017-2025 ($Million)
Table 58.Asia-Pacific Pharmaceutical Packaging Equipment Market, By Package Type, 2017-2025 ($Million)
Table 59.Japan Pharmaceutical Packaging Equipment Market, By Product, 2017-2025 ($Million)
Table 60.Japan Pharmaceutical Packaging Equipment Market, By Package Type, 2017-2025 ($Million)
Table 61.China Pharmaceutical Packaging Equipment Market, By Product, 2017-2025 ($Million)
Table 62.China Pharmaceutical Packaging Equipment Market, By Package Type, 2017-2025 ($Million)
Table 63.Australia Pharmaceutical Packaging Equipment Market, By Product, 2017-2025 ($Million)
Table 64.Australia Pharmaceutical Packaging Equipment Market, By Package Type, 2017-2025 ($Million)
Table 65.India Pharmaceutical Packaging Equipment Market, By Product, 2017-2025 ($Million)
Table 66.India Pharmaceutical Packaging Equipment Market, By Package Type, 2017-2025 ($Million)
Table 67.South Korea Pharmaceutical Packaging Equipment Market, By Product, 2017-2025 ($Million)
Table 68.South Korea Pharmaceutical Packaging Equipment Market, By Package Type, 2017-2025 ($Million)
Table 69.Taiwan Pharmaceutical Packaging Equipment Market, By Product, 2017-2025 ($Million)
Table 70.Taiwan Pharmaceutical Packaging Equipment Market, By Package Type, 2017-2025 ($Million)
Table 71.Rest of Asia-Pacific Pharmaceutical Packaging Equipment Market, By Product, 2017-2025 ($Million)
Table 72.Rest of Asia-Pacific Pharmaceutical Packaging Equipment Market, By Package Type, 2017-2025 ($Million)
Table 73.Rest of the World Pharmaceutical Packaging Equipment Market, By Country, 2017-2025 ($Million)
Table 74.Rest of the World Pharmaceutical Packaging Equipment Market, By Product, 2017-2025 ($Million)
Table 75.Rest of the World Pharmaceutical Packaging Equipment Market, By Package Type, 2017-2025 ($Million)
Table 76.Brazil Pharmaceutical Packaging Equipment Market, By Product, 2017-2025 ($Million)
Table 77.Brazil Pharmaceutical Packaging Equipment Market, By Package Type, 2017-2025 ($Million)
Table 78.Turkey Pharmaceutical Packaging Equipment Market, By Product, 2017-2025 ($Million)
Table 79.Turkey Pharmaceutical Packaging Equipment Market, By Package Type, 2017-2025 ($Million)
Table 80.Saudi Arabia Pharmaceutical Packaging Equipment Market, By Product, 2017-2025 ($Million)
Table 81.Saudi Arabia Pharmaceutical Packaging Equipment Market, By Package Type, 2017-2025 ($Million)
Table 82.South Africa Pharmaceutical Packaging Equipment Market, By Product, 2017-2025 ($Million)
Table 83.South Africa Pharmaceutical Packaging Equipment Market, By Package Type, 2017-2025 ($Million)
Table 84.United Arab Emirates Pharmaceutical Packaging Equipment Market, By Product, 2017-2025 ($Million)
Table 85.UAE Pharmaceutical Packaging Equipment Market, By Package Type, 2017-2025 ($Million)
Table 86.Other Pharmaceutical Packaging Equipment Market, By Product, 2017-2025 ($Million)
Table 87.Other Pharmaceutical Packaging Equipment Market, By Package Type, 2017-2025 ($Million)
Table 88.Körber Ag: Key Strategic Developments, 2017-2017
Table 89.Uhlmann-Group: Key Strategic Developments, 2017-2017
Table 90.Romaco Pharmatechnik GmbH: Key Strategic Developments, 2017-2017
Table 91.I.M.A. Industria Macchine Automatiche S.p.A.: Key Strategic Developments, 2017-2017
Table 92.MULTIVAC: Key Strategic Developments, 2017-2017
Table 93.Marchesini Group S.p.A.: Key Strategic Developments, 2017-2017
Table 94.Robert Bosch Gmbh: Key Strategic Developments, 2017-2017
Table 95.MG2 s.r.l: Key Strategic Developments, 2017-2017
Table 96.OPTIMA packaging group GmbH: Key Strategic Developments, 2017-2017
Table 97.Bausch & Ströbel Maschinenfabrik ilshofen Gmbh Co. Kg.: Key Strategic Developments, 2017-2017
List of Figures
Figure 1.Global Pharmaceutical Packaging Equipment Market Share, By Product, 2017 & 2025
Figure 2.Global Pharmaceutical Packaging Equipment Market, By Package Type, 2017, ($Million)
Figure 3.Pharmaceutical Packaging Equipment Market, By Region, 2017, ($Million)
Figure 4.Körber Ag: Net Revenues, 2017-2017 ($Million)
Figure 5.Körber Ag: Net Revenue Share, By Segment, 2017
Figure 6.Körber Ag: Net Revenue Share, By Geography, 2017
Figure 7.Uhlmann-Group: Net Revenues, 2017-2017 ($Million)
Figure 8.Uhlmann-Group: Net Revenue Share, By Segment 2017
Figure 9.Uhlmann-Group: Net Revenue Share, By Geography, 2017
Figure 10.Romaco Pharmatechnik GmbH: Net Revenues, 2017-2017 ($Million)
Figure 11.Romaco Pharmatechnik GmbH: Net Revenue Share, By Segment, 2017
Figure 12.Romaco Pharmatechnik GmbH: Net Revenue Share, By Geography, 2017
Figure 13.I.M.A. Industria Macchine Automatiche S.p.A.: Net Revenues, 2017-2017 ($Million)
Figure 14.I.M.A. Industria Macchine Automatiche S.p.A.: Net Revenue Share, By Segment, 2017
Figure 15.I.M.A. Industria Macchine Automatiche S.p.A.: Net Revenue Share, By Geography, 20s16
Figure 16.MULTIVAC: Net Revenues, 2017-2017 ($Million)
Figure 17.MULTIVAC: Net Revenue Share, By Segment, 2017
Figure 18.MULTIVAC: Net Revenue Share, By Geography, 2017
Figure 19.Marchesini Group S.p.A.: Net Revenues, 2017-2017 ($Million)
Figure 20.Marchesini Group S.p.A.: Net Revenue Share, By Segment, 2017
Figure 21.Marchesini Group S.p.A.: Net Revenue Share, By Geography, 2017
Figure 22.Robert Bosch Gmbh: Net Revenues, 2017-2017 ($Million)
Figure 23.Robert Bosch Gmbh: Net Revenue Share, By Segment, 2017
Figure 24.Robert Bosch Gmbh: Net Revenue Share, By Geography, 2017
Figure 25.MG2 s.r.l: Net Revenues, 2017-2017 ($Million)
Figure 26.MG2 s.r.l: Net Revenue Share, By Segment, 2017
Figure 27.MG2 s.r.l: Net Revenue Share, By Geography, 2017
Figure 28.OPTIMA packaging group GmbH: Net Revenues, 2017-2017 ($Million)
Figure 29 OPTIMA packaging group GmbH: Net Revenue Share, By Segment, 2017
Figure 30.OPTIMA packaging group GmbH: Net Revenue Share, By Geography, 2017
Figure 31.Bausch & Ströbel Maschinenfabrik ilshofen Gmbh Co. Kg.: Net Revenues, 2017-2017 ($Million)
Figure 32.Bausch & Ströbel Maschinenfabrik ilshofen Gmbh Co. Kg.: Net Revenue Share, By Segment, 2017
Figure 33.Bausch & Ströbel Maschinenfabrik ilshofen Gmbh Co. Kg.: Net Revenue Share, By Geography, 2017
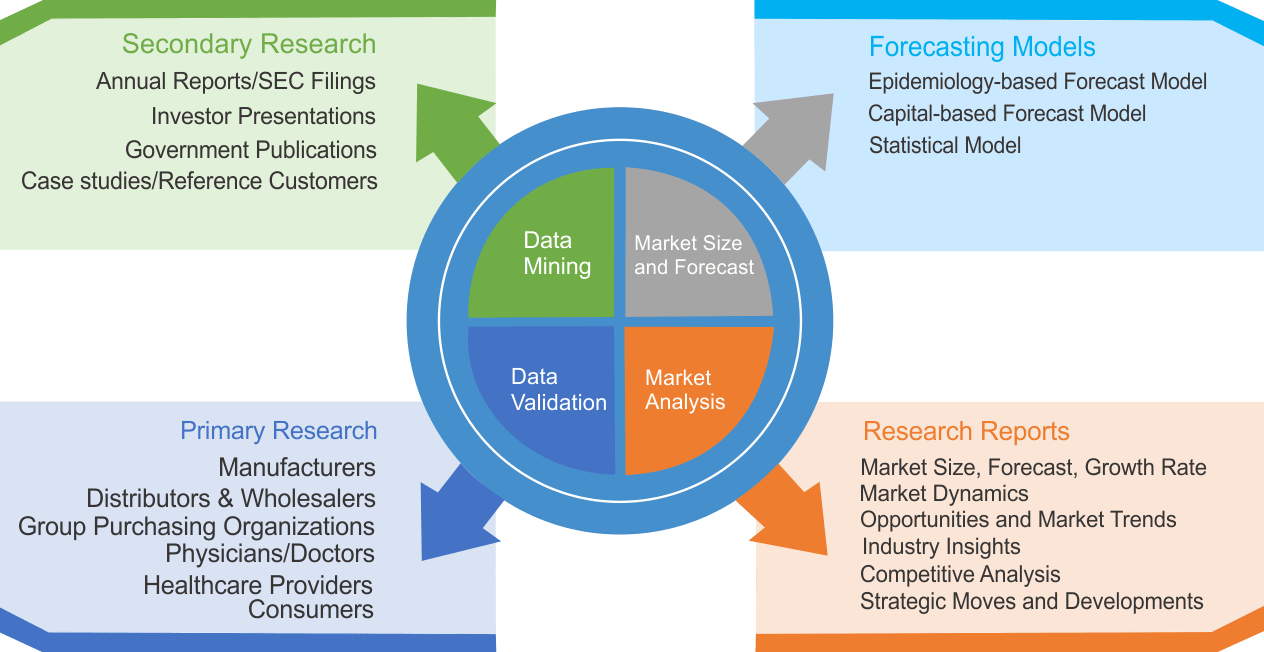
Research Methodology
We use both primary as well as secondary research for our market surveys, estimates and for developing forecast. Our research process commence by analyzing the problem which enable us to design the scope for our research study. Our research process is uniquely designed with enough flexibility to adjust according to changing nature of products and markets, while retaining core element to ensure reliability and accuracy in research findings. We understand both macro and micro-economic factors to evaluate and forecast different market segments.
Data Mining
Data is extensively collected through various secondary sources such as annual reports, investor presentations, SEC filings, and other corporate publications. We also refer trade magazines, technical journals, paid databases such as Factiva and Bloomberg, industry trade journals, scientific journals, and social media data to understand market dynamics and industry trends. Further, we also conduct primary research to understand market drivers, restraints, opportunities, challenges, and competitive scenario to build our analysis.
Data Collection Matrix
|
Data Collection Matrix |
Supply Side |
Demand Side |
|
Primary Data Sources |
|
|
|
Secondary Data Sources |
|
|
Market Modeling and Forecasting
We use epidemiology and capital equipment-based models to forecast market size of different segments at country and regional level.
- Epidemiology-based Forecasting Model: This method uses epidemiology data gathered through various publications and from physicians to estimate population of patients, flow of treatment of individual disease and therapies. The data collected through this method includes statics on incidence of disease, population suffering from disease, and treatment population. This method is used to understand:
- Number of patients for particular device or medical procedure and
- Repeated use of particular device depending on health and condition of patient
- Capital-based Forecasting Model: This method of forecasting is based on number of replacements, installed-based and new sales of capital equipment used in various healthcare and diagnostic centers. These three parameters are calculated and forecast is developed. Installation base is calculated as average number of units per facility; while sales for particular year is calculated from number of new and replace units. Secondary data is collected through various supply chain intermediaries and opinion leaders to arrive at installation and sales rate. These techniques help our analysts in validating market and developed market estimates and forecast.
We do forecast on basis of several parameters such as market drivers, market opportunities, industry trends government regulations, raw materials supply and trade dynamics to ensure relevance of forecast with market scenario. With increasing need to granulized information, we used bottom-up methodology for forecasting where we evaluate each regional segment differently and combined all forecast to develop final market forecast.
Data Validation
We believe primary research is a very important tool in analyzing and forecasting different markets. In order to make sure accuracy of our findings, our team conducts primary interviews at every stage of research to gain deep insights into current business environment and future trends and key developments in market. This includes use of various methods such as telephonic interviews, focus groups, face to face interviews and questionnaires to validate our research from all aspects. We validate our data through primary research from key industry leaders such as CEO, product managers, marketing managers, suppliers, distributors, and consumers are frequently interviewed. These interviews provide valuable insights which help us to have better market understanding besides validating our estimates and forecast.
Data Triangulation
Industry Analysis
|
Qualitative Data |
Quantitative Data (2017-2025) |
|
|