.png)
Fumaric Acid Market by Application - Global Industry Analysis and Forecast to 2027
Published On : September 2017 Pages : 102 Category: Nutraceuticals & Functional Foods Report Code : CM09220
SEGMENTS & REGIONS:
- Regions: North America, Europe, Asia- Pacific, Latin America, Middle East & Africa
Industry Trend Analysis
The global fumaric acid market was valued around USD billion in 2017 and is expected to reach roughly USD billion by the end of 2027 while registering itself at a compound annual growth rate (CAGR) of % during the forecast period, owing to the rise in popularity of processed food together with availability of ready-to-drink beverages. Fumaric acid plays the role of a food additive (acidulant) and renders pH adjustment, flavor improvement, and preservation in beverages & food. Increasing economic development together with living standard particularly in developing countries such as India, China is expected to boost the consumption of processed beverages & food which will consecutively augment the growth of the global market. The change in trend for dietary consumption joined with rising health consciousness amongst customers is anticipated to boost the demand of processed beverages & food. This factor is probable to drive the growth of the fumaric acid market during the forecast years. The launching of a wide range of flavors including ethnic and exotic flavors in beverages & food market is anticipated to strengthen the global demand of fumaric acid. Growing remodeling & construction activities in emerging countries of Latin America and Asia Pacific is anticipated to impel the demand of unsaturated polyester resin (UPR) and paints demand which in turn is anticipated to fuel the growth of global fumaric acid market. Fumaric acid is used in the making of alkyd resins and unsaturated polyester resin (UPR). Global augment in automotive production is expected to positively impact fumaric acid industry worldwide. Unsaturated polyester resin (UPR) containing fumaric acid is used in body panel fabrication of light and heavy duty vehicles. Rising fumaric acid uses in pharma applications is projected to augment the growth of global market. Fumaric acid is boasted as a latent alternate for artificial organic acids like tartaric acid and citric acid for using in snacks and fruit syrup. Consecutively it is expected to boost the growth of the global fumaric acid market. Strict government regulations due to increasing ecological concern to trim down carbon footprints into the environment are expected to hamper the growth of global market. Increasing funding for research and development for bio-based fumaric acid is predicted to offer major opportunities for market participants. The innovation of nutritional supplements such as bars and cereals is also projected to provide profitable opportunities to market players. Fumaric acid can be utilized as a medium in the bio-based polymer’s production and potentially substitute maleic anhydride in several applications. Market participants have vast opportunities to take advantage due to factor that is mentioned above.
Application Outlook and Trend Analysis
Beverage and foods were the important application section for fumaric acid market over the precedent few years. Fumaric acid is utilized for flavor enhancement and preservation in Beverage and foods. Increasing convenience food demand is anticipated to fuel Beverage and foods application demand. The launching of energy bars and drinks is expected to boost the demand of fumaric acid for Beverage and foods application. In the year 2017, rosin paper sizing were the subsequent largest application segment. This application section is likely to weaken as a result of its increasing replacement with alkaline papermaking. Unsaturated polyester resins (UPR) are predicted to show fair growth rate during the forecast years. The growing uses of unsaturated polyester resins (UPR) in various industries like marine, aerospace, and pipes & tank are likely to augment the growth of the fumaric acid market over the next few years. Other applications of fumaric acid involve pharmaceuticals, feed additives, lacquers, lubricating oil, and plasticizers.
Regional Outlook and Trend Analysis
In 2017, Asia Pacific region was the top market concerning demand of fumaric acid and is anticipated to persist its supremacy during the forecast period. Rising demand of convenience food together with a rise in middle-class disposable earning as well as population growth is anticipated to drive the demand of fumaric acid in this region. Increasing remodeling and construction in Asia Pacific region is also projected to fuel the growth of the regional market. Growing automobile industry in developing countries of Asia Pacific like Indonesia and Thailand are estimated to boost the market growth of fumaric acid in the area. North America region was the subsequent largest market for the fumaric acid; however it is said to observe a declination in demand during the forecast years due to strict government regulations about the utilization of alkyd resins. After North America, Europe is also anticipated to experience a turn down in demand of fumaric acid due to saturation of the market in various industries.
Competitive Outlook and Trend Analysis
The global fumaric acid market is reasonably dominated by and concentrated in few key players such as Prinova LLC, Bartek Ingredients, Fuso Chemicals and Polynt S.P.A. Other key market players include Thirumalai Chemicals, Dastech International Inc., Xilong Chemical Company Ltd, The Chemical Company, Tianjin Bohai Chemicals, Changzhou Yabang Chemical Co. Ltd, Nippon Shokubai Co. Ltd, U.S. Chemicals LLC, and Wego Chemicals & Mineral Corp. The big players are involved in wide R&D and improvement to extend the scope of application and get across regional markets.
The fumaric acid market is segmented as follows -
By Application
- Food & Beverages
- Rosin Paper Sizes
- Unsaturated Polyester Resins (UPR)
- Alkyd Resins
- Other Applications
By regions
- North America
- U.S
- Canada
- Mexico
- Europe
- Germany
- France
- UK
- Italy
- Spain
- Rest of Europe
- Asia-Pacific
- Japan
- China
- Australia
- India
- South Korea
- Rest of Asia Pacific
- Rest of the World
- Brazil
- South Africa
- Saudi Arabia
- United Arab Emirates
- Others
Some of the key questions answered by the report are:
- What was the market size in 2017 and forecast from 2022 to 2027?
- What will be the industry market growth from 2022 to 2027?
- What are the major drivers, restraints, opportunities, challenges, and industry trends and their impact on the market forecast?
- What are the major segments leading the market growth and why?
- Which are the leading players in the market and what are the major strategies adopted by them to sustain the market competition?
Market Classification
- Fumaric Acid Market, By Application, Estimates and Forecast, 2017-2027 ($Million)
- Food & Beverages
- Rosin Paper Sizes
- Unsaturated Polyester Resins (UPR)
- Alkyd Resins
- Other Applications
- Fumaric Acid Market, By Region, Estimates and Forecast, 2017-2027 ($Million)
- North America
- North America Fumaric Acid Market, By Country
- North America Fumaric Acid Market, By Application
- U.S. Fumaric Acid Market, By Application
- Canada Fumaric Acid Market, By Application
- Mexico Fumaric Acid Market, By Application
-
- Europe
- Europe Fumaric Acid Market, By Country
- Europe Fumaric Acid Market, By Application
- Germany Fumaric Acid Market, By Application
- France Fumaric Acid Market, By Application
- UK Fumaric Acid Market, By Application
- Italy Fumaric Acid Market, By Application
- Spain Fumaric Acid Market, By Application
- Rest of Europe Fumaric Acid Market, By Application
-
- Asia-Pacific
- Asia-Pacific Fumaric Acid Market, By Country
- Asia-Pacific Fumaric Acid Market, By Application
- Japan Fumaric Acid Market, By Application
- Australia Fumaric Acid Market, By Application
- India Fumaric Acid Market, By Application
- South Korea Fumaric Acid Market, By Application
- Rest of Asia-Pacific Fumaric Acid Market, By Application
- Asia-Pacific
-
- Rest of the World
- Rest of the World Fumaric Acid Market, By Country
- Rest of the World Fumaric Acid Market, By Application
- Brazil Fumaric Acid Market, By Application
- South Africa Fumaric Acid Market, By Application
- Saudi Arabia Fumaric Acid Market, By Application
- Turkey Fumaric Acid Market, By Application
- United Arab Emirates Fumaric Acid Market, By Application
- Others Fumaric Acid Market, By Application
- Rest of the World
Table of Contents
1.Introduction
1.1.Report Description
1.2.Research Methodology
1.2.1. Secondary Research
1.2.2. Primary Research
2.Executive Summary
2.1.Key Highlights
3.Market Overview
3.1.Introduction
3.1.1. Market Definition
3.1.2. Market Segmentation
3.2.Market Share Analysis
3.3.Market Dynamics
3.3.1. Drivers
3.3.1.1.Development of construction industry
3.3.1.2.Growing convenience demand of food & beverages
3.3.2. Restraints
3.3.2.1.Strict government regulations
3.3.3. Opportunities
3.3.3.1.Rising investments in research to build bio-based fumaric acid
3.4.Industry Trends
4.Fumaric Acid Market, By Application
4.1.Introduction
4.2.Fumaric Acid Market Assessment and Forecast, By Application, 2017-2027
4.3.Food & Beverages
4.3.1.1.Market Assessment and Forecast, By Region, 2017-2027 ($Million)
4.4.Rosin Paper Sizes
4.4.1.1.Market Assessment and Forecast, By Region, 2017-2027 ($Million)
4.5.Unsaturated Polyester Resins (UPR)
4.5.1.1.Market Assessment and Forecast, By Region, 2017-2027 ($Million)
4.6.Alkyd Resins
4.6.1.1.Market Assessment and Forecast, By Region, 2017-2027 ($Million)
4.7.Other Applications
4.7.1.1.Market Assessment and Forecast, By Region, 2017-2027 ($Million)
5.Fumaric Acid Market, By Region
5.1.Introduction
5.2.Fumaric Acid Market Assessment and Forecast, By Region, 2017-2027 ($Million)
5.3.North America
5.3.1. Market Assessment and Forecast, By Country, 2017-2027 ($Million)
5.3.2. Market Assessment and Forecast, By Application, 2017-2027 ($Million)
5.3.2.1.U.S.
5.3.2.1.1.Market Assessment and Forecast, By Application, 2017-2027 ($Million)
5.3.2.1.2.
5.3.2.2.Canada
5.3.2.2.1.Market Assessment and Forecast, By Application, 2017-2027 ($Million)
5.3.2.3.Mexico
5.3.2.3.1.Market Assessment and Forecast, By Application, 2017-2027 ($Million)
5.4.Europe
5.4.1. Market Assessment and Forecast, By Country, 2017-2027 ($Million)
5.4.2. Market Assessment and Forecast, By Application, 2017-2027 ($Million)
5.4.2.1.Germany
5.4.2.1.1.Market Assessment and Forecast, By Application, 2017-2027 ($Million)
5.4.2.2.France
5.4.2.2.1.Market Assessment and Forecast, By Application, 2017-2027 ($Million)
5.4.2.3.UK
5.4.2.3.1.Market Assessment and Forecast, By Application, 2017-2027 ($Million)
5.4.2.4.Italy
5.4.2.4.1.Market Assessment and Forecast, By Application, 2017-2027 ($Million)
5.4.2.5.Spain
5.4.2.5.1.Market Assessment and Forecast, By Application, 2017-2027 ($Million)
5.4.2.6.Russia
5.4.2.6.1.Market Assessment and Forecast, By Application, 2017-2027 ($Million)
5.4.2.7.Rest of Europe
5.4.2.7.1.Market Assessment and Forecast, By Application, 2017-2027 ($Million)
5.5.Asia-Pacific
5.5.1. Market Assessment and Forecast, By Country, 2017-2027 ($Million)
5.5.2. Market Assessment and Forecast, By Application, 2017-2027 ($Million)
5.5.2.1.Japan
5.5.2.1.1.Market Assessment and Forecast, By Application, 2017-2027 ($Million)
5.5.2.2.China
5.5.2.2.1.Market Assessment and Forecast, By Application, 2017-2027 ($Million)
5.5.2.3.Australia
5.5.2.3.1.Market Assessment and Forecast, By Application, 2017-2027 ($Million)
5.5.2.4.India
5.5.2.4.1.Market Assessment and Forecast, By Application, 2017-2027 ($Million)
5.5.2.5.South Korea
5.5.2.5.1.Market Assessment and Forecast, By Application, 2017-2027 ($Million)
5.5.2.6.Taiwan
5.5.2.6.1.Market Assessment and Forecast, By Application, 2017-2027 ($Million)
5.5.2.7.Rest of Asia-Pacific
5.5.2.7.1.Market Assessment and Forecast, By Application, 2017-2027 ($Million)
5.6.Rest of the World
5.6.1. Market Assessment and Forecast, By Country, 2017-2027 ($Million)
5.6.2. Market Assessment and Forecast, By Application, 2017-2027 ($Million)
5.6.2.1.Brazil
5.6.2.1.1.Market Assessment and Forecast, By Application, 2017-2027 ($Million)
5.6.2.2.Turkey
5.6.2.2.1.Market Assessment and Forecast, By Application, 2017-2027 ($Million)
5.6.2.3.Saudi Arabia
5.6.2.3.1.Market Assessment and Forecast, By Application, 2017-2027 ($Million)
5.6.2.4.South Africa
5.6.2.4.1.Market Assessment and Forecast, By Application, 2017-2027 ($Million)
5.6.2.5.United Arab Emirates
5.6.2.5.1.Market Assessment and Forecast, By Application, 2017-2027 ($Million)
5.6.2.6.Others
5.6.2.6.1.Market Assessment and Forecast, By Application, 2017-2027 ($Million)
6.Company Profiles
6.1.Thirumalai Chemicals
6.1.1. Business Overview
6.1.2. Product Portfolio
6.1.3. Key Financials
6.1.4. Strategic Developments
6.2.Polynt S.P.A
6.2.1. Business Overview
6.2.2. Product Portfolio
6.2.3. Key Financials
6.2.4. Strategic Developments
6.3.Bartek Ingredients
6.3.1. Business Overview
6.3.2. Product Portfolio
6.3.3. Strategic Developments
6.4.Prinova LLC
6.4.1. Business Overview
6.4.2. Product Portfolio
6.4.3. Strategic Developments
6.5.Fuso Chemicals
6.5.1. Business Overview
6.5.2. Product Portfolio
6.5.3. Strategic Developments
6.6.Tianjin Bohai Chemicals
6.6.1. Business Overview
6.6.2. Product Portfolio
6.6.3. Strategic Developments
6.7.Nippon Shokubai Co. Ltd.
6.7.1. Business Overview
6.7.2. Product Portfolio
6.7.3. Key Financials
6.7.4. Strategic Developments
6.8.The Chemical Company
6.8.1. Business Overview
6.8.2. Product Portfolio
6.8.3. Strategic Developments
6.9.Wego Chemicals & Mineral Corp.
6.9.1. Business Overview
6.9.2. Product Portfolio
6.9.3. Strategic Developments
6.10.U.S. Chemicals LLC
6.10.1.Business Overview
6.10.2.Product Portfolio
6.10.3.Strategic Developments
6.11.Changzhou Yabang Chemical Co. Ltd.
6.11.1.Business Overview
6.11.2.Product Portfolio
6.11.3.Strategic Developments
List of Tables
Table 1.Fumaric Acid Market, By Application ($Million), 2017-2025
Table 2.Food & Beverages Market, By Region ($Million), 2017-2025
Table 3.Rosin Paper Sizes Market, By Region ($Million), 2017-2025
Table 4.Unsaturated Polyester Resins (UPR) Market, By Region ($Million), 2017-2025
Table 5.Alkyd Resins Market, By Region ($Million), 2017-2025
Table 6.Other Applications Market, By Region ($Million), 2017-2025
Table 7.Fumaric Acid Market, By Region ($Million), 2017-2025
Table 8.North America Fumaric Acid Market, By Country, 2017-2025 ($Million)
Table 10.North America Fumaric Acid Market, By Application, 2017-2025 ($Million)
Table 12.U.S. Fumaric Acid Market, By Application, 2017-2025 ($Million)
Table147.Canada Fumaric Acid Market, By Application, 2017-2025 ($Million)
Table 16.Mexico Fumaric Acid Market, By Application, 2017-2025 ($Million)
Table 17.Europe Fumaric Acid Market, By Country, 2017-2025 ($Million)
Table 19.Europe Fumaric Acid Market, By Application, 2017-2025 ($Million)
Table 21.Germany Fumaric Acid Market, By Application, 2017-2025 ($Million)
Table 23.France Fumaric Acid Market, By Application, 2017-2025 ($Million)
Table 25.UK Fumaric Acid Market, By Application, 2017-2025 ($Million)
Table 27.Italy Fumaric Acid Market, By Application, 2017-2025 ($Million)
Table 29.Spain Fumaric Acid Market, By Application, 2017-2025 ($Million)
Table 31.Russia Fumaric Acid Market, By Application, 2017-2025 ($Million)
Table 33.Rest of Europe Fumaric Acid Market, By Application, 2017-2025 ($Million)
Table 34.Asia-Pacific Fumaric Acid Market, By Country, 2017-2025 ($Million)
Table 36.Asia-Pacific Fumaric Acid Market, By Application, 2017-2025 ($Million)
Table 38.Japan Fumaric Acid Market, By Application, 2017-2025 ($Million)
Table 40.China Fumaric Acid Market, By Application, 2017-2025 ($Million)
Table 42.Australia Fumaric Acid Market, By Application, 2017-2025 ($Million)
Table 44.India Fumaric Acid Market, By Application, 2017-2025 ($Million)
Table 46.South Korea Fumaric Acid Market, By Application, 2017-2025 ($Million)
Table 48.Taiwan Fumaric Acid Market, By Application, 2017-2025 ($Million)
Table 50.Rest of Asia-Pacific Fumaric Acid Market, By Application, 2017-2025 ($Million)
Table 51.Rest of the World Fumaric Acid Market, By Country, 2017-2025 ($Million)
Table 53.Rest of the World Fumaric Acid Market, By Application, 2017-2025 ($Million)
Table 55.Brazil Fumaric Acid Market, By Application, 2017-2025 ($Million)
Table 57.Turkey Fumaric Acid Market, By Application, 2017-2025 ($Million)
Table 59.Saudi Arabia Fumaric Acid Market, By Application, 2017-2025 ($Million)
Table 61.South Africa Fumaric Acid Market, By Application, 2017-2025 ($Million)
Table 63.United Arab Emirates Fumaric Acid Market, By Application, 2017-2025 ($Million)
Table 65.Others Fumaric Acid Market, By Application, 2017-2025 ($Million)
Table 66.Thirumalai Chemicals: Key Strategic Developments, 2017-2017
Table 67.Polynt S.P.A: Key Strategic Developments, 2017-2017
Table 68.Bartek Ingredients: Key Strategic Developments, 2017-2017
Table 69.Prinova LLC: Key Strategic Developments, 2017-2017
Table 70.Fuso Chemicals: Key Strategic Developments, 2017-2017
Table 71.Tianjin Bohai Chemicals: Key Strategic Developments, 2017-2017
Table 72.Nippon Shokubai Co. Ltd.: Key Strategic Developments, 2017-2017
Table 73.The Chemical Company: Key Strategic Developments, 2017-2017
Table 74.Wego Chemicals & Mineral Corp.: Key Strategic Developments, 2017-2017
Table 75.U.S. Chemicals LLC: Key Strategic Developments, 2017-2017
Table 76.Changzhou Yabang Chemical Co. Ltd.: Key Strategic Developments, 2017-2017
List of Figures
Figure 1.Fumaric Acid Market, By Application, 2017 & 2025 ($Million)
Figure 2.Fumaric Acid Market, By Region, 2017, ($Million)
Figure 3.Thirumalai Chemicals: Net Revenues, 2017-2017 ($Million)
Figure 4.Thirumalai Chemicals: Net Revenue Share, By Segment, 2017
Figure 5.Thirumalai Chemicals: Net Revenue Share, By Geography, 2017
Figure 6.Polynt S.P.A: Net Revenues, 2017-2017 ($Million)
Figure 7.Polynt S.P.A: Net Revenue Share, By Segment, 2017
Figure 8.Polynt S.P.A: Net Revenue Share, By Geography, 2017
Figure 9.Nippon Shokubai Co. Ltd.: Net Revenues, 2017-2017 ($Million)
Figure 10.Nippon Shokubai Co. Ltd.: Net Revenue Share, By Segment, 2017
Figure 11.Nippon Shokubai Co. Ltd.: Net Revenue Share, By Geography, 2017
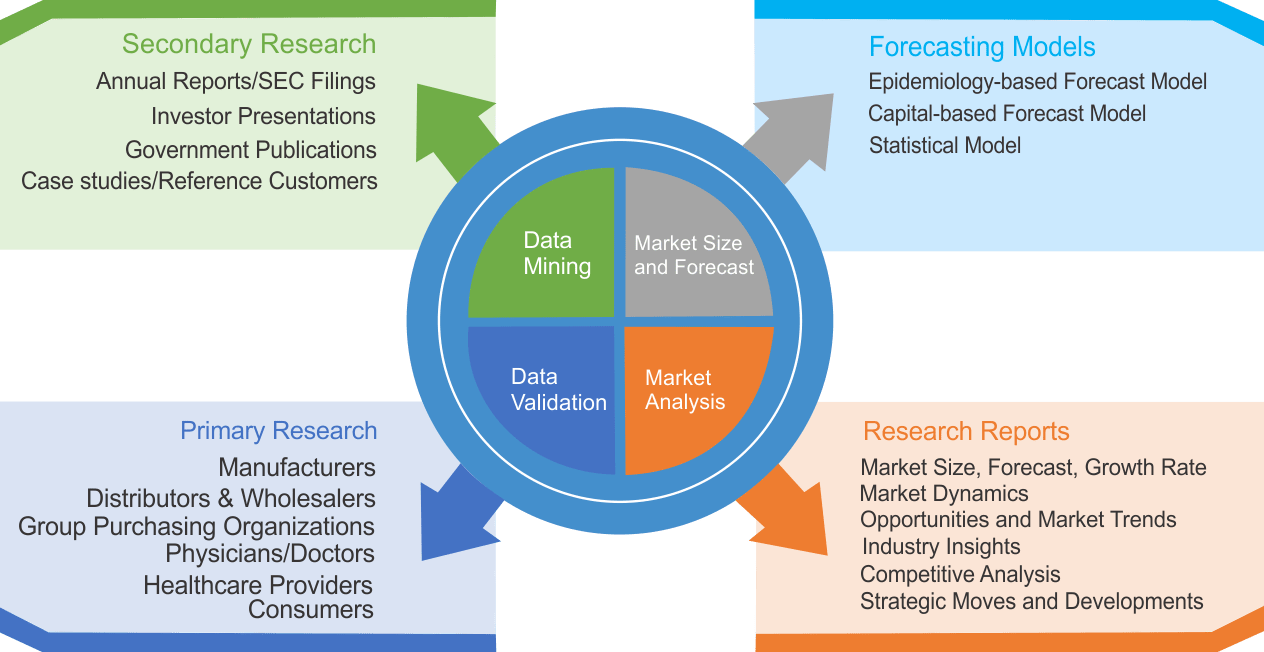
Research Methodology
We use both primary as well as secondary research for our market surveys, estimates and for developing forecast. Our research process commence by analyzing the problem which enable us to design the scope for our research study. Our research process is uniquely designed with enough flexibility to adjust according to changing nature of products and markets, while retaining core element to ensure reliability and accuracy in research findings. We understand both macro and micro-economic factors to evaluate and forecast different market segments.
Data Mining
Data is extensively collected through various secondary sources such as annual reports, investor presentations, SEC filings, and other corporate publications. We also refer trade magazines, technical journals, paid databases such as Factiva and Bloomberg, industry trade journals, scientific journals, and social media data to understand market dynamics and industry trends. Further, we also conduct primary research to understand market drivers, restraints, opportunities, challenges, and competitive scenario to build our analysis.
Data Collection Matrix
|
Data Collection Matrix |
Supply Side |
Demand Side |
|
Primary Data Sources |
|
|
|
Secondary Data Sources |
|
|
Market Modeling and Forecasting
We use epidemiology and capital equipment-based models to forecast market size of different segments at country and regional level.
- Epidemiology-based Forecasting Model: This method uses epidemiology data gathered through various publications and from physicians to estimate population of patients, flow of treatment of individual disease and therapies. The data collected through this method includes statics on incidence of disease, population suffering from disease, and treatment population. This method is used to understand:
- Number of patients for particular device or medical procedure and
- Repeated use of particular device depending on health and condition of patient
- Capital-based Forecasting Model: This method of forecasting is based on number of replacements, installed-based and new sales of capital equipment used in various healthcare and diagnostic centers. These three parameters are calculated and forecast is developed. Installation base is calculated as average number of units per facility; while sales for particular year is calculated from number of new and replace units. Secondary data is collected through various supply chain intermediaries and opinion leaders to arrive at installation and sales rate. These techniques help our analysts in validating market and developed market estimates and forecast.
We do forecast on basis of several parameters such as market drivers, market opportunities, industry trends government regulations, raw materials supply and trade dynamics to ensure relevance of forecast with market scenario. With increasing need to granulized information, we used bottom-up methodology for forecasting where we evaluate each regional segment differently and combined all forecast to develop final market forecast.
Data Validation
We believe primary research is a very important tool in analyzing and forecasting different markets. In order to make sure accuracy of our findings, our team conducts primary interviews at every stage of research to gain deep insights into current business environment and future trends and key developments in market. This includes use of various methods such as telephonic interviews, focus groups, face to face interviews and questionnaires to validate our research from all aspects. We validate our data through primary research from key industry leaders such as CEO, product managers, marketing managers, suppliers, distributors, and consumers are frequently interviewed. These interviews provide valuable insights which help us to have better market understanding besides validating our estimates and forecast.
Data Triangulation
Industry Analysis
|
Qualitative Data |
Quantitative Data (2017-2025) |
|
|