.png)
Food Additives Market by Product - Global Industry Analysis and Forecast to 2022
Published On : October 2017 Pages : 127 Category: Food and Beverages Report Code : FB10304
SEGMENTS & REGIONS:
- Regions: North America, Europe, Asia- Pacific, Latin America, Middle East & Africa
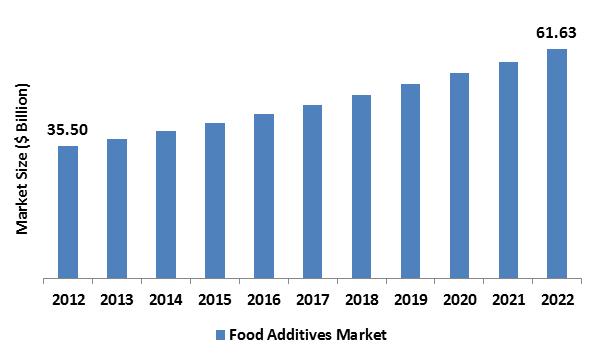
Industry Trend Analysis
In 2017, the global food additives market was valued around USD billion and is anticipated to reach approximately USD billion while maintaining a compound annual growth rate (CAGR) of % during the forecast period owing to growing consumption of beverages and food products with high nutrients and the enhanced visual appeal is predicted to fuel market demand over the forecast period. The global food additives industry is expected to witness rise due to varying customer interests and tastes about nutritional value and quality of the product. Increasing awareness levels among consumers regarding different types of tastes is also projected to act as crucial growth driving factor. An additive is integrated into a finished product to amend safety against hazardous germs and other types of microorganisms to extend shelf life. It also enhances properties like taste, color, and flavor in food products and enhances its nutritionary content. Increasing packaged products demand counting frozen meals, appetizers and ready-to-eat meals are projected to cause producers boosting their production output and hence increase demand. Increasing demand by consumers for high-value nutritional products and the exotic taste is encouraging manufacturers to expand elements that would augment the customer experience.
Product Outlook and Trend Analysis
In 2017, enhancers and flavors were top product segment, producing revenues around USD billion. Rising customer demand for sugar-free and low salt products due to their health benefits is anticipated to fuel the market growth. Natural flavors section is projected to grow at a compound annual growth rate of % over next few years. Increasing awareness levels among consumers about the benefits of neem and herbs as natural flavors are boosting the market growth. Moreover, governmental support intended to improve the production yield of naturally derived products is estimated to boost its significance during the forecast period. Sweeteners are mainly used to render a sweet taste in manufacturing food and beverages products. Additionally, growing health concerns about diarrhea, tooth decay and diabetes and growing the significance of low-calorie products are anticipated to strengthen the sugar substitutes’ demand such as high fructose corn syrup (HFCS) and high-intensity sugars (HIS). The section is projected to grow at a compound annual growth rate of % during the forecast years.
Regional Outlook and Trend Analysis
In 2017, European regional food additives market reported for around % of global market owing to rising significance of functional elements for incorporating characteristics like the extension of shelf life, emulsification, and flavor. Growing meat products production, especially beef in Russia is anticipated to encourage the additives market growth in the future. In 2017, Asia Pacific regional market reported for around % and is projected to experience significant growth during the next few years. Governmental initiatives to boost production yield in developing countries such as China and India are bestowing towards expansion, and this is predicted to persist during the forecast years. Indian market is estimated to grow at a compound annual growth rate of % over the projected period. Increasing requirement to impart conventional taste and increasing awareness regarding high nutritional diet are acting as major demand drivers. The Middle East region is prone to be a market with high prospective due to rising domestic consumption along with administrational support to draw new funds. Increasing red meat consumption especially beef in Middle East nations like Saudi Arabia is anticipated to encourage the growth of the market during the forecast years.
Competitive Outlook and Trend Analysis
Global food additives market was ruled by market players like E. I. du Pont de Nemours and Company, Archer Daniels Midland Company, Novozymes, and Ingredion Incorporated. Other major market players are Tate & Lyle PLC, Chr. Hansen A/S, Koninklijke DSM N.V., Cargill, Ajinomoto Co., Inc., BASF SE, Adani Wilmar ltd., Bio Springer S.A., Lonza Group, Givaudan and Kerry Group. Many manufacturers are following the strategy to enhance their presence in the value chain by forward and backward integration. Chr. Hansen accomplished the purchase of its Turkey-based subsidiary, Peyma Chr. Hansen A.S., to reinforce and enlarge its activities in this region in August 2017. Ingredion Inc. inked a deal with Alliance Grain Traders for distribution of AGT’s bran ingredients, pulse flours, and protein.
The global food additives market is segmented as follows :
By Product
- Sweeteners
- HIS
- HFCS
- Other Sweeteners
- Flavors & Enhancers
- Natural flavors
- Artificial Flavor & Enhancers
- Enzymes
- Fat Replacers
- Protein
- Starch
- Other Fat Replacers
- Shelf- life stabilizers
- Emulsifiers
- Mono, Di-Glycerides & Derivatives
- Lecithin
- Stearoyl Lactylates
- Sorbitan Esters
- Other Emulsifiers
- Other Products
By Region
- North America
- U.S
- Canada
- Mexico
- Europe
- Germany
- France
- UK
- Italy
- Spain
- Rest of Europe
- Asia-Pacific
- Japan
- China
- Australia
- India
- South Korea
- Rest of Asia Pacific
- Rest of the World
- Brazil
- South Africa
- Saudi Arabia
- United Arab Emirates
- Others
Some of the key questions answered by the report are:
- What was the market size in 2017 and forecast from 2017 to 2022?
- What will be the industry market growth from 2017 to 2022?
- What are the major drivers, restraints, opportunities, challenges, and industry trends and their impact on the market forecast?
- What are the major segments leading the market growth and why?
- Which are the leading players in the market and what are the major strategies adopted by them to sustain the market competition?
Market Classification
- Food Additives Market, By Product, Estimates and Forecast, 2012-2022 ($Million)
- Sweeteners
- HIS
- HFCS
- Other Sweeteners
- Flavors & Enhancers
- Natural flavors
- Artificial Flavor & Enhancers
- Enzymes
- Fat Replacers
- Protein
- Starch
- Other Fat Replacers
- Shelf- life stabilizers
- Emulsifiers
- Mono, Di-Glycerides & Derivatives
- Lecithin
- Stearoyl Lactylates
- Sorbitan Esters
- Other Emulsifiers
- Other Products
- Food Additives Market, By Region, Estimates and Forecast, 2012-2022 ($Million)
- North America
- North America Food Additives Market, By Country
- North America Food Additives Market, By Product
- U.S. Food Additives Market, By Product
- Canada Food Additives Market, By Product
- Mexico Food Additives Market, By Product
-
- Europe
- Europe Food Additives Market, By Country
- Europe Food Additives Market, By Product
- Germany Food Additives Market, By Product
- France Food Additives Market, By Product
- UK Food Additives Market, By Product
- Italy Food Additives Market, By Product
- Spain Food Additives Market, By Product
- Rest of Europe Food Additives Market, By Product
-
- Asia-Pacific
- Asia-Pacific Food Additives Market, By Country
- Asia-Pacific Food Additives Market, By Product
- Japan Food Additives Market, By Product
- China Food Additives Market, By Product
- Australia Food Additives Market, By Product
- India Food Additives Market, By Product
- South Korea Food Additives Market, By Product
- Rest of Asia-Pacific Food Additives Market, By Product
- Asia-Pacific
-
- Rest of the World
- Rest of the World Food Additives Market, By Country
- Rest of the World Food Additives Market, By Product
- Brazil Food Additives Market, By Product
- South Africa Food Additives Market, By Product
- Saudi Arabia Food Additives Market, By Product
- Turkey Food Additives Market, By Product
- United Arab Emirates Food Additives Market, By Product
- Others Food Additives Market, By Product
- Rest of the World
Table of Contents
1. Introduction
1.1. Report Description
1.2. Research Methodology
1.2.1. Secondary Research
1.2.2. Primary Research
2. Executive Summary
2.1. Key Highlights
3. Market Overview
3.1. Introduction
3.1.1. Market Definition
3.1.2. Market Segmentation
3.2. Market Dynamics
3.2.1. Drivers
3.2.1.1. Growth in Food & beverage industry
3.2.1.2. Increasing demand of packaged foods
3.2.2. Restraints
3.2.2.1. Growth of Organic Food Market
3.2.3. Opportunities
3.2.3.1. Development of Advanced packaged food
4. Food Additives Market, By Product
4.1. Introduction
4.2. Food Additives Market Assessment and Forecast, By Product, 2012-2022
4.3. Sweeteners
4.3.1. Market Assessment and Forecast, By Type, 2012-2022 ($Million)
4.3.2. Market Assessment and Forecast, By Region, 2012-2022 ($Million)
4.3.3. HIS
4.3.3.1. Market Assessment and Forecast, By Region, 2012-2022 ($Million)
4.3.4. HFCS
4.3.4.1. Market Assessment and Forecast, By Region, 2012-2022 ($Million)
4.3.5. Other Sweeteners
4.3.5.1. Market Assessment and Forecast, By Region, 2012-2022 ($Million)
4.4. Flavors & Enhancers
4.4.1. Market Assessment and Forecast, By Type, 2012-2022 ($Million)
4.4.2. Market Assessment and Forecast, By Region, 2012-2022 ($Million)
4.4.3. Natural flavors
4.4.3.1. Market Assessment and Forecast, By Region, 2012-2022 ($Million)
4.4.4. Artificial Flavor & Enhancers
4.4.4.1. Market Assessment and Forecast, By Region, 2012-2022 ($Million)
4.5. Enzymes
4.5.1. Market Assessment and Forecast, By Region, 2012-2022 ($Million)
4.6. Fat Replacers
4.6.1. Market Assessment and Forecast, By Type, 2012-2022 ($Million)
4.6.2. Market Assessment and Forecast, By Region, 2012-2022 ($Million)
4.6.3. Protein
4.6.3.1. Market Assessment and Forecast, By Region, 2012-2022 ($Million)
4.6.4. Starch
4.6.4.1. Market Assessment and Forecast, By Region, 2012-2022 ($Million)
4.6.5. Other Fat Replacers
4.6.5.1. Market Assessment and Forecast, By Region, 2012-2022 ($Million)
4.7. Shelf- life stabilizers
4.7.1. Market Assessment and Forecast, By Region, 2012-2022 ($Million)
4.8. Emulsifiers
4.8.1. Market Assessment and Forecast, By Type, 2012-2022 ($Million)
4.8.2. Market Assessment and Forecast, By Region, 2012-2022 ($Million)
4.8.3. Mono, Di-Glycerides & Derivatives
4.8.3.1. Market Assessment and Forecast, By Region, 2012-2022 ($Million)
4.8.4. Lecithin
4.8.4.1. Market Assessment and Forecast, By Region, 2012-2022 ($Million)
4.8.5. Stearoyl Lactylates
4.8.5.1. Market Assessment and Forecast, By Region, 2012-2022 ($Million)
4.8.6. Sorbitan Esters
4.8.6.1. Market Assessment and Forecast, By Region, 2012-2022 ($Million)
4.8.7. Other Emulsifiers
4.8.7.1. Market Assessment and Forecast, By Region, 2012-2022 ($Million)
4.8.8. Other Products
4.8.8.1. Market Assessment and Forecast, By Region, 2012-2022 ($Million)
5. Food Additives Market, By Region
5.1. Introduction
5.2. Food Additives Market Assessment and Forecast, By Region, 2012-2022 ($Million)
5.3. North America
5.3.1. Market Assessment and Forecast, By Country, 2012-2022 ($Million)
5.3.2. Market Assessment and Forecast, By Product, 2012-2022 ($Million)
5.3.2.1. U.S.
5.3.2.1.1. Market Assessment and Forecast, By Product, 2012-2022 ($Million)
5.3.2.2. Canada
5.3.2.2.1. Market Assessment and Forecast, By Product, 2012-2022 ($Million)
5.3.2.3. Mexico
5.3.2.3.1. Market Assessment and Forecast, By Product, 2012-2022 ($Million)
5.4. Europe
5.4.1. Market Assessment and Forecast, By Country, 2012-2022 ($Million)
5.4.2. Market Assessment and Forecast, By Product, 2012-2022 ($Million)
5.4.2.1. Germany
5.4.2.1.1. Market Assessment and Forecast, By Product, 2012-2022 ($Million)
5.4.2.2. France
5.4.2.2.1. Market Assessment and Forecast, By Product, 2012-2022 ($Million)
5.4.2.3. UK
5.4.2.3.1. Market Assessment and Forecast, By Product, 2012-2022 ($Million)
5.4.2.4. Italy
5.4.2.4.1. Market Assessment and Forecast, By Product, 2012-2022 ($Million)
5.4.2.5. Spain
5.4.2.5.1. Market Assessment and Forecast, By Product, 2012-2022 ($Million)
5.4.2.6. Rest of Europe
5.4.2.6.1. Market Assessment and Forecast, By Product, 2012-2022 ($Million)
5.5. Asia-Pacific
5.5.1. Market Assessment and Forecast, By Country, 2012-2022 ($Million)
5.5.2. Market Assessment and Forecast, By Product, 2012-2022 ($Million)
5.5.2.1. Japan
5.5.2.1.1. Market Assessment and Forecast, By Product, 2012-2022 ($Million)
5.5.2.2. China
5.5.2.2.1. Market Assessment and Forecast, By Product, 2012-2022 ($Million)
5.5.2.3. Australia
5.5.2.3.1. Market Assessment and Forecast, By Product, 2012-2022 ($Million)
5.5.2.4. India
5.5.2.4.1. Market Assessment and Forecast, By Product, 2012-2022 ($Million)
5.5.2.5. South Korea
5.5.2.5.1. Market Assessment and Forecast, By Product, 2012-2022 ($Million)
5.5.2.6. Rest of Asia-Pacific
5.5.2.6.1. Market Assessment and Forecast, By Product, 2012-2022 ($Million)
5.6. Rest of the World
5.6.1. Market Assessment and Forecast, By Country, 2012-2022 ($Million)
5.6.2. Market Assessment and Forecast, By Product, 2012-2022 ($Million)
5.6.2.1. Brazil
5.6.2.1.1. Market Assessment and Forecast, By Product, 2012-2022 ($Million)
5.6.2.2. Turkey
5.6.2.2.1. Market Assessment and Forecast, By Product, 2012-2022 ($Million)
5.6.2.3. Saudi Arabia
5.6.2.3.1. Market Assessment and Forecast, By Product, 2012-2022 ($Million)
5.6.2.4. South Africa
5.6.2.4.1. Market Assessment and Forecast, By Product, 2012-2022 ($Million)
5.6.2.5. United Arab Emirates
5.6.2.5.1. Market Assessment and Forecast, By Product, 2012-2022 ($Million)
5.6.2.6. Others
5.6.2.6.1. Market Assessment and Forecast, By Product, 2012-2022 ($Million)
6. Company Profiles
6.1. DuPont
6.1.1. Business Overview
6.1.2. Product Portfolio
6.1.3. Key Financials
6.1.4. Strategic Developments
6.2. Archer Daniels Midland Company
6.2.1. Business Overview
6.2.2. Product Portfolio
6.2.3. Key Financials
6.2.4. Strategic Developments
6.3. Ingredion Incorporated
6.3.1. Business Overview
6.3.2. Product Portfolio
6.3.3. Strategic Developments
6.4. Novozymes A/S
6.4.1. Business Overview
6.4.2. Product Portfolio
6.4.3. Strategic Developments
6.5. Koninklijke DSM N.V.
6.5.1. Business Overview
6.5.2. Product Portfolio
6.5.3. Key Financials
6.5.4. Strategic Developments
6.6. Ajinomoto Co., Inc.
6.6.1. Business Overview
6.6.2. Product Portfolio
6.6.3. Strategic Developments
6.7. Cargill Inc.
6.7.1. Business Overview
6.7.2. Product Portfolio
6.7.3. Key Financials
6.7.4. Strategic Developments
6.8. Mitsubishi International Food Ingredients, Inc.
6.8.1. Business Overview
6.8.2. Product Portfolio
6.8.3. Strategic Developments
6.9. BASF SE
6.9.1. Business Overview
6.9.2. Product Portfolio
6.9.3. Key Financials
6.9.4. Strategic Developments
6.10. Adani Wilmar Ltd.
6.10.1. Business Overview
6.10.2. Product Portfolio
6.10.3. Key Financials
6.10.4. Strategic Developments
6.11. Sensient Technologies
6.11.1. Business Overview
6.11.2. Product Portfolio
6.11.3. Key Financials
6.11.4. Strategic Developments
6.12. Corbion
6.12.1. Business Overview
6.12.2. Product Portfolio
6.12.3. Strategic Developments
6.13. Eastman Chemical Company
6.13.1. Business Overview
6.13.2. Product Portfolio
6.13.3. Key Financials
6.13.4. Strategic Developments
6.14. Givaudan S.A.
6.14.1. Business Overview
6.14.2. Product Portfolio
6.14.3. Strategic Developments
List of Tables
Table 1.Food Additives Market, By Product ($Million), 2012-2022
Table 2.Sweeteners Market, By Region ($Million), 2012-2022
Table 3.HIS Market, By Region ($Million), 2012-2022
Table 4.HFCS Market, By Region ($Million), 2012-2022
Table 5.Other Sweeteners Market, By Region ($Million), 2012-2022
Table 6.Flavors & Enhancers Market, By Region ($Million), 2012-2022
Table 7.Natural flavors Market, By Region ($Million), 2012-2022
Table 8.Enzymes Market, By Region ($Million), 2012-2022
Table 9.Fat Replacers Market, By Region ($Million), 2012-2022
Table 10.Starch Market, By Region ($Million), 2012-2022
Table 11.Other Fat Replacers Market, By Region ($Million), 2012-2022
Table 12.Shelf- life stabilizers Market, By Region ($Million), 2012-2022
Table 13.Emulsifiers Market, By Region ($Million), 2012-2022
Table 14.Mono, Di-Glycerides & Derivatives Market, By Region ($Million), 2012-2022
Table 15.Lecithin Market, By Region ($Million), 2012-2022
Table 16.Stearoyl Lactylates Market, By Region ($Million), 2012-2022
Table 17.Sorbitan Esters Market, By Region ($Million), 2012-2022
Table 18.Other Products Market, By Region ($Million), 2012-2022
Table 19.Food Additives Market, By Region ($Million), 2012-2022
Table 20.North America Food Additives Market, By Country, 2012-2022 ($Million)
Table 21.North America Food Additives Market, By Product, 2012-2022 ($Million)
Table 22.U.S. Food Additives Market, By Product, 2012-2022 ($Million)
Table 23.Canada Food Additives Market, By Product, 2012-2022 ($Million)
Table 24.Mexico Food Additives Market, By Product, 2012-2022 ($Million)
Table 25.Europe Food Additives Market, By Country, 2012-2022 ($Million)
Table 26.Europe Food Additives Market, By Product, 2012-2022 ($Million)
Table 27.Germany Food Additives Market, By Product, 2012-2022 ($Million)
Table 28.France Food Additives Market, By Product, 2012-2022 ($Million)
Table 29.UK Food Additives Market, By Product, 2012-2022 ($Million)
Table 30.Italy Food Additives Market, By Product, 2012-2022 ($Million)
Table 31.Spain Food Additives Market, By Product, 2012-2022 ($Million)
Table 32.Rest of Europe Food Additives Market, By Product, 2012-2022 ($Million)
Table 33.Asia-Pacific Food Additives Market, By Country, 2012-2022 ($Million)
Table 34.Asia-Pacific Food Additives Market, By Product, 2012-2022 ($Million)
Table 35.Japan Food Additives Market, By Product, 2012-2022 ($Million)
Table 36.China Food Additives Market, By Product, 2012-2022 ($Million)
Table 37.Australia Food Additives Market, By Product, 2012-2022 ($Million)
Table 38.India Food Additives Market, By Product, 2012-2022 ($Million)
Table 39.South Korea Food Additives Market, By Product, 2012-2022 ($Million)
Table 40.Rest of Asia-Pacific Food Additives Market, By Product, 2012-2022 ($Million)
Table 41.Rest of the World Food Additives Market, By Country, 2012-2022 ($Million)
Table 42.Rest of the World Food Additives Market, By Product, 2012-2022 ($Million)
Table 43.Brazil Food Additives Market, By Product, 2012-2022 ($Million)
Table 44.Turkey Food Additives Market, By Product, 2012-2022 ($Million)
Table 45.Saudi Arabia Food Additives Market, By Product, 2012-2022 ($Million)
Table 46.South Africa Food Additives Market, By Product, 2012-2022 ($Million)
Table 47.United Arab Emirates Food Additives Market, By Product, 2012-2022 ($Million)
Table 48.Others Food Additives Market, By Product, 2012-2022 ($Million)
Table 49.Others Food Additives Market, By Application, 2012-2022 ($Million)
Table 51.DuPont: Key Strategic Developments, 2017-2017
Table 52.Archer Daniels Midland Company: Key Strategic Developments, 2017-2017
Table 53.Ingredion Incorporated: Key Strategic Developments, 2017-2017
Table 54.Novozymes A/S: Key Strategic Developments, 2017-2017
Table 55.Koninklijke DSM N.V.: Key Strategic Developments, 2017-2017
Table 56.Ajinomoto Co., Inc.: Key Strategic Developments, 2017-2017
Table 57.Cargill Inc.: Key Strategic Developments, 2017-2017
Table 58.Mitsubishi International Food Ingredients, Inc.: Key Strategic Developments, 2017-2017
Table 59.BASF SE: Key Strategic Developments, 2017-2017
Table 60.Adani Wilmar Ltd.: Key Strategic Developments, 2017-2017
Table 61.Sensient Technologies: Key Strategic Developments, 2017-2017
Table 62.Corbion: Key Strategic Developments, 2017-2017
Table 63.Eastman Chemical Company: Key Strategic Developments, 2017-2017
Table 64.Givaudan S.A.: Key Strategic Developments, 2017-2017
List of Figures
Figure 1.Food Additives Market Share, By Product, 2012 & 2022 ($Million)
Figure 4.Food Additives Market, By Region, 2017, ($Million)
Figure 5.DuPont: Net Revenues, 2017-2017 ($Million)
Figure 6.DuPont: Net Revenue Share, By Segment, 2017
Figure 7.DuPont: Net Revenue Share, By Geography, 2017
Figure 8.Archer Daniels Midland Company: Net Revenues, 2017-2017 ($Million)
Figure 9.Archer Daniels Midland Company: Net Revenue Share, By Segment, 2017
Figure 10.Archer Daniels Midland Company: Net Revenue Share, By Geography, 2017
Figure 11.Cargill Inc.: Net Revenues, 2017-2017 ($Million)
Figure 12.Cargill Inc.: Net Revenue Share, By Segment, 2017
Figure 13.Cargill Inc.: Net Revenue Share, By Geography, 2017
Figure 14.BASF SE: Net Revenues, 2017-2017 ($Million)
Figure 15.BASF SE: Net Revenue Share, By Segment, 2017
Figure 16.BASF SE: Net Revenue Share, By Geography, 2017
Figure 17.Corbion: Net Revenues, 2017-2017 ($Million)
Figure 18.Corbion: Net Revenue Share, By Segment, 2017
Figure 19.Corbion: Net Revenue Share, By Geography, 2017
Research Methodology
We use both primary as well as secondary research for our market surveys, estimates and for developing forecast. Our research process commence by analyzing the problem which enable us to design the scope for our research study. Our research process is uniquely designed with enough flexibility to adjust according to changing nature of products and markets, while retaining core element to ensure reliability and accuracy in research findings. We understand both macro and micro-economic factors to evaluate and forecast different market segments.
Data Mining
Data is extensively collected through various secondary sources such as annual reports, investor presentations, SEC filings, and other corporate publications. We also refer trade magazines, technical journals, paid databases such as Factiva and Bloomberg, industry trade journals, scientific journals, and social media data to understand market dynamics and industry trends. Further, we also conduct primary research to understand market drivers, restraints, opportunities, challenges, and competitive scenario to build our analysis.
Data Collection Matrix
|
Data Collection Matrix |
Supply Side |
Demand Side |
|
Primary Data Sources |
|
|
|
Secondary Data Sources |
|
|
Market Modeling and Forecasting
We use epidemiology and capital equipment-based models to forecast market size of different segments at country and regional level.
- Epidemiology-based Forecasting Model: This method uses epidemiology data gathered through various publications and from physicians to estimate population of patients, flow of treatment of individual disease and therapies. The data collected through this method includes statics on incidence of disease, population suffering from disease, and treatment population. This method is used to understand:
- Number of patients for particular device or medical procedure and
- Repeated use of particular device depending on health and condition of patient
- Capital-based Forecasting Model: This method of forecasting is based on number of replacements, installed-based and new sales of capital equipment used in various healthcare and diagnostic centers. These three parameters are calculated and forecast is developed. Installation base is calculated as average number of units per facility; while sales for particular year is calculated from number of new and replace units. Secondary data is collected through various supply chain intermediaries and opinion leaders to arrive at installation and sales rate. These techniques help our analysts in validating market and developed market estimates and forecast.
We do forecast on basis of several parameters such as market drivers, market opportunities, industry trends government regulations, raw materials supply and trade dynamics to ensure relevance of forecast with market scenario. With increasing need to granulized information, we used bottom-up methodology for forecasting where we evaluate each regional segment differently and combined all forecast to develop final market forecast.
Data Validation
We believe primary research is a very important tool in analyzing and forecasting different markets. In order to make sure accuracy of our findings, our team conducts primary interviews at every stage of research to gain deep insights into current business environment and future trends and key developments in market. This includes use of various methods such as telephonic interviews, focus groups, face to face interviews and questionnaires to validate our research from all aspects. We validate our data through primary research from key industry leaders such as CEO, product managers, marketing managers, suppliers, distributors, and consumers are frequently interviewed. These interviews provide valuable insights which help us to have better market understanding besides validating our estimates and forecast.
Data Triangulation

Industry Analysis
|
Qualitative Data |
Quantitative Data (2017-2025) |
|
|