.png)
Coal Bed Methane (CBM) Market by Technology and Application - Global Industry Analysis and Forecast to 2027
Published On : September 2017 Pages : 90 Category: Conventional Energy Report Code : CM09211
SEGMENTS & REGIONS:
- Regions: North America, Europe, Asia- Pacific, Latin America, Middle East & Africa
Industry Trend Analysis
The global Coal Bed Methane (CBM) market was worth USD billion in the year of 2017 and is anticipated to reach approximately USD billion by 2027, while registering itself at a compound annual growth rate (CAGR) of % during the forecast period. The load on the national power grids of emerging countries will be less owing to the increased implementation of coal bed methane (CBM) as a substitute to electricity. Power breakdowns along with an inadequate approach to clean energy can be defeated by utilizing this technology. Biggest CBM stockpiles in Africa discovered by the South African Development Community (SADC), particularly Zimbabwe can certainly amend the economies and can also trim down imports thus boosting the coal bed methane market. CBM can be proficiently employed as a fertilizer with methane which is a source of ammonia utilized in half of the fertilizer market worldwide. Coal bed methane market is vital in supporting food production pace, thus meeting the rising population and its requirements. A CBM based company; Essar is presently rendering 1 million cubic meters of the essential gas to Matix Fertilizers and Chemicals. CBM can be promptly transformed into ethanol, petrol or diesel, retrievable CBM has the capability to be accumulated in canisters or be utilized as a household fuel. Fischer-Tropsch blend model has established to be a proficient method to change a mixture of hydrogen and carbon monoxide into numerous CBM by-products and liquid hydrocarbons. Featuring the potential to grip the requirement of fossil fuels, coal bed methane market is likely to demonstrate robust growth over the forecast period. Rising implementation of alternative energy sources due to the requirement of clean energy will establish to be an advantage for CBM. Coal bed methane (CBM) market has the perspective to present an alternative to the traditional energy sources and can help in trimming down the greenhouse emissions that can sequentially open new approaches for its business growth. For example, coal bed methane market has the possibility to transform Zimbabwe’s balance of sum by cutting down the import of fertilizers and petroleum products which calculates for % of the country’s total imports. Encouraging government initiatives promoting the use of alternative energy resources will drive the coal bed methane market over the forecast years. The government of China, on acknowledging the worth of CBM, initiated the progress of the Five-Year Plan that requires the country to manufacture 50 billion m3 of CBM by the end of 2021. Likewise, the Indian government has allotted 31 development blocks for the study and making of CBM thus driving the market industry. A considerable number of uncharted reserves will accelerate the coal bed methane market and propel the growth leading to an amplified production. Russia is considered to have 17 to 80 trillion m3 of overall resources but, market forces and political unsteadiness have confined full-scale production. Also, anticipated resources in Alaska’s embrace a potential of 30 trillion m3, however, are not yet fully inquired.
Application Outlook and Trend Analysis
Coal bed methane has several applications involving, producing liquefied petroleum gas, power generation, pharmaceutical industries, gas engine systems together with furnishing basis of plastics and propelling gas turbines. CBM with balanced amounts of methane gas may also be utilized to restore traditional natural gas along with determining its use as a propeller fuel in vehicles. In 2017, Petroleum and Explosives Safety Organization of India (PESO) released 7 licenses to distribute CBM as an automotive fuel in across the state. Rigorous dewatering is required to remove the gas linked with other characteristics of methane to behave as a greenhouse gas are prone to hinder the growth of coal bed methane market over the forecast period. Groundwater commotion and reduction of groundwater level due to insertion of additives and drawing of groundwater will further limit the industry growth. Coal bed methane market can be sectioned based on an application containing the commercial, industrial, residential, power generation and transportation.
Technology Outlook and Trend Analysis
Based on technology, the market industry is split into parallel boring and CO2 segregation and hydraulic breaking that guides the market, due to the technological innovations accomplished in this technique attached with its ease of utilization and will further balance the coal bed methane market during forecast years.
Regional Outlook and Trend Analysis
Coal bed methane market can be divided into the region as, Europe, Latin America, North America, Asia-Pacific, and MEA. North America guided by the United States is presently holding the highest share. The country has 10 main valleys and 48 producing states, furthermore, uncharted reserves of Alaska will preserve the status of North American industry over the forecast period. Europe and Asia-Pacific will experience high growth rates due to the huge unexplored stockpiles in Australia, Russia, India, and China. Latin America and MEA is predicted to testify a fair growth. Lack of suitable infrastructure could establish a hindrance to the growth of coal bed methane market.
Competitive Insights
The key market players for the global coal bed methane market are Reliance Power Limited, Essar Oil, Chevron, BP P.L.C., Royal Dutch Shell plc, Arrow Energy, Weatherford, Dart Energy Corporation, PetroChina International Co., Ltd., Santos Ltd., ConocoPhillips Co., Fortune Oil Corporation, and Encana Group, Green Dragon Gas Ltd., Sydney Gas Ltd., Black Diamond Energy, Inc., Pioneer Natural Resource Great Eastern Energy Petronas. Major companies have followed merger, expansion, and product development as their schemes to maintain the strong market competition.
The global coal bed methane market is segmented as follows-
By Technology
- Horizontal drilling and hydraulic fracturing
- Proppants
By Application
- Industrial
- Power Generation
- Transportation
- Commercial
- Residential
By Region
- North America
- U.S
- Canada
- Mexico
- Europe
- Germany
- France
- UK
- Italy
- Spain
- Rest of Europe
- Asia-Pacific
- Japan
- China
- Australia
- India
- South Korea
- Rest of Asia Pacific
- Rest of the World
- Brazil
- South Africa
- Saudi Arabia
- United Arab Emirates
- Others
Some of the key questions answered by the report are:
- What was the market size in 2017 and forecast from 2022 to 2027?
- What will be the industry market growth from 2022 to 2027?
- What are the major drivers, restraints, opportunities, challenges, and industry trends and their impact on the market forecast?
- What are the major segments leading the market growth and why?
- Which are the leading players in the market and what are the major strategies adopted by them to sustain the market competition?
Market Classification
- Coal Bed Methane (CBM) Market, By Technology, Estimates and Forecast, 2017-2027 ($Million)
- Horizontal drilling and hydraulic fracturing
- Proppants
- Coal Bed Methane (CBM) Market, By Application, Estimates and Forecast, 2017-2027 ($Million)
- Industrial
- Power Generation
- Transportation
- Commercial
- Residential
- Coal Bed Methane (CBM) Market, By Region, Estimates and Forecast, 2017-2027 ($Million)
- North America
- North America Coal Bed Methane (CBM) Market, By Country
- North America Coal Bed Methane (CBM) Market, By Technology
- North America Coal Bed Methane (CBM) Market, By Application
- U.S. Coal Bed Methane (CBM) Market, By Technology
- U.S. Coal Bed Methane (CBM) Market, By Application
- Canada Coal Bed Methane (CBM) Market, By Technology
- Canada Coal Bed Methane (CBM) Market, By Application
- Mexico Coal Bed Methane (CBM) Market, By Technology
- Mexico Coal Bed Methane (CBM) Market, By Application
-
- Europe
- Europe Coal Bed Methane (CBM) Market, By Country
- Europe Coal Bed Methane (CBM) Market, By Technology
- Europe Coal Bed Methane (CBM) Market, By Application
- Germany Coal Bed Methane (CBM) Market, By Technology
- Germany Coal Bed Methane (CBM) Market, By Application
- France Coal Bed Methane (CBM) Market, By Technology
- France Coal Bed Methane (CBM) Market, By Application
- UK Coal Bed Methane (CBM) Market, By Technology
- UK Coal Bed Methane (CBM) Market, By Application
- Italy Coal Bed Methane (CBM) Market, By Technology
- Italy Coal Bed Methane (CBM) Market, By Application
- Spain Coal Bed Methane (CBM) Market, By Technology
- Spain Coal Bed Methane (CBM) Market, By Application
- Rest of Europe Coal Bed Methane (CBM) Market, By Technology
- Rest of Europe Coal Bed Methane (CBM) Market, By Application
-
- Asia-Pacific
- Asia-Pacific Coal Bed Methane (CBM) Market, By Country
- Asia-Pacific Coal Bed Methane (CBM) Market, By Technology
- Asia-Pacific Coal Bed Methane (CBM) Market, By Application
- Japan Coal Bed Methane (CBM) Market, By Technology
- Japan Coal Bed Methane (CBM) Market, By Application
- Australia Coal Bed Methane (CBM) Market, By Technology
- Australia Coal Bed Methane (CBM) Market, By Application
- India Coal Bed Methane (CBM) Market, By Technology
- India Coal Bed Methane (CBM) Market, By Application
- South Korea Coal Bed Methane (CBM) Market, By Technology
- South Korea Coal Bed Methane (CBM) Market, By Application
- Rest of Asia-Pacific Coal Bed Methane (CBM) Market, By Technology
- Rest of Asia-Pacific Coal Bed Methane (CBM) Market, By Application
- Asia-Pacific
-
- Rest of the World
- Rest of the World Coal Bed Methane (CBM) Market, By Country
- Rest of the World Coal Bed Methane (CBM) Market, By Technology
- Rest of the World Coal Bed Methane (CBM) Market, By Application
- Brazil Coal Bed Methane (CBM) Market, By Technology
- Brazil Coal Bed Methane (CBM) Market, By Application
- South Africa Coal Bed Methane (CBM) Market, By Technology
- South Africa Coal Bed Methane (CBM) Market, By Application
- Saudi Arabia Coal Bed Methane (CBM) Market, By Technology
- Saudi Arabia Coal Bed Methane (CBM) Market, By Application
- Turkey Coal Bed Methane (CBM) Market, By Technology
- Turkey Coal Bed Methane (CBM) Market, By Application
- United Arab Emirates Coal Bed Methane (CBM) Market, By Technology
- United Arab Emirates Coal Bed Methane (CBM) Market, By Application
- Others Coal Bed Methane (CBM) Market, By Technology
- Others Coal Bed Methane (CBM) Market, By Application
- Rest of the World
Table of Contents
1.Introduction
1.1.Report Description
1.2.Research Methodology
1.2.1. Secondary Research
1.2.2. Primary Research
2.Executive Summary
2.1.Key Highlights
3.Market Overview
3.1.Introduction
3.1.1. Market Definition
3.1.2. Market Segmentation
3.2.Market Share Analysis
3.3.Market Dynamics
3.3.1. Drivers
3.3.1.1.Low price of other unconventional sources of natural gas
3.3.1.2.Regulatory support
3.3.1.3.High demand for eco-friendly fuels in the industrial sector
3.3.2. Restraints
3.3.2.1.Large initial capital investment
3.3.3. Opportunities
3.3.3.1.Utilization of Alternative sources for natural gas
3.4.Industry Trends
4.Coal Bed Methane (CBM) Market, By Technology
4.1.Introduction
4.2.Coal Bed Methane (CBM) Market Assessment and Forecast, By Technology, 2017-2027
4.3.Horizontal drilling and hydraulic fracturing
4.3.1. Market Assessment and Forecast, By Region, 2017-2027 ($Million)
4.4.Proppants
4.4.1. Market Assessment and Forecast, By Region, 2017-2027 ($Million)
5.Coal Bed Methane (CBM) Market, By Application
5.1.Introduction
5.2.Coal Bed Methane (CBM) Market Assessment and Forecast, By Application, 2017-2027
5.3.Industrial
5.3.1.1.Market Assessment and Forecast, By Region, 2017-2027 ($Million)
5.4.Power Generation
5.4.1.1.Market Assessment and Forecast, By Region, 2017-2027 ($Million)
5.5.Transportation
5.5.1.1.Market Assessment and Forecast, By Region, 2017-2027 ($Million)
5.6.Commercial
5.6.1.1.Market Assessment and Forecast, By Region, 2017-2027 ($Million)
5.7.Residential
5.7.1.1.Market Assessment and Forecast, By Region, 2017-2027 ($Million)
6.Coal Bed Methane (CBM) Market, By Region
6.1.Introduction
6.2.Coal Bed Methane (CBM) Market Assessment and Forecast, By Region, 2017-2027 ($Million)
6.3.North America
6.3.1. Market Assessment and Forecast, By Country, 2017-2027 ($Million)
6.3.2. Market Assessment and Forecast, By Technology, 2017-2027 ($Million)
6.3.3. Market Assessment and Forecast, By Application, 2017-2027 ($Million)
6.3.3.1.U.S.
6.3.3.1.1.Market Assessment and Forecast, By Technology, 2017-2027 ($Million)
6.3.3.1.2.Market Assessment and Forecast, By Application, 2017-2027 ($Million)
6.3.3.2.Canada
6.3.3.2.1.Market Assessment and Forecast, By Technology, 2017-2027 ($Million)
6.3.3.2.2.Market Assessment and Forecast, By Application, 2017-2027 ($Million)
6.3.3.3.Mexico
6.3.3.3.1.Market Assessment and Forecast, By Technology, 2017-2027 ($Million)
6.3.3.3.2.Market Assessment and Forecast, By Application, 2017-2027 ($Million)
6.4.Europe
6.4.1. Market Assessment and Forecast, By Country, 2017-2027 ($Million)
6.4.2. Market Assessment and Forecast, By Technology, 2017-2027 ($Million)
6.4.3. Market Assessment and Forecast, By Application, 2017-2027 ($Million)
6.4.3.1.Germany
6.4.3.1.1.Market Assessment and Forecast, By Technology, 2017-2027 ($Million)
6.4.3.1.2.Market Assessment and Forecast, By Application, 2017-2027 ($Million)
6.4.3.2.France
6.4.3.2.1.Market Assessment and Forecast, By Technology, 2017-2027 ($Million)
6.4.3.2.2.Market Assessment and Forecast, By Technology, 2017-2027 ($Million)
6.4.3.3.UK
6.4.3.3.1.Market Assessment and Forecast, By Technology, 2017-2027 ($Million)
6.4.3.3.2.Market Assessment and Forecast, By Application, 2017-2027 ($Million)
6.4.3.4.Italy
6.4.3.4.1.Market Assessment and Forecast, By Technology, 2017-2027 ($Million)
6.4.3.4.2.Market Assessment and Forecast, By Application, 2017-2027 ($Million)
6.4.3.5.Spain
6.4.3.5.1.Market Assessment and Forecast, By Technology, 2017-2027 ($Million)
6.4.3.5.2.Market Assessment and Forecast, By Application, 2017-2027 ($Million)
6.4.3.6.Russia
6.4.3.6.1.Market Assessment and Forecast, By Technology, 2017-2027 ($Million)
6.4.3.6.2.Market Assessment and Forecast, By Application, 2017-2027 ($Million)
6.4.3.7.Rest of Europe
6.4.3.7.1.Market Assessment and Forecast, By Technology, 2017-2027 ($Million)
6.4.3.7.2.Market Assessment and Forecast, By Application, 2017-2027 ($Million)
6.5.Asia-Pacific
6.5.1. Market Assessment and Forecast, By Country, 2017-2027 ($Million)
6.5.2. Market Assessment and Forecast, By Technology, 2017-2027 ($Million)
6.5.3. Market Assessment and Forecast, By Application, 2017-2027 ($Million)
6.5.3.1.Japan
6.5.3.1.1.Market Assessment and Forecast, By Technology, 2017-2027 ($Million)
6.5.3.1.2.Market Assessment and Forecast, By Application, 2017-2027 ($Million)
6.5.3.2.China
6.5.3.2.1.Market Assessment and Forecast, By Technology, 2017-2027 ($Million)
6.5.3.2.2.Market Assessment and Forecast, By Application, 2017-2027 ($Million)
6.5.3.3.Australia
6.5.3.3.1.Market Assessment and Forecast, By Technology, 2017-2027 ($Million)
6.5.3.3.2.Market Assessment and Forecast, By Application, 2017-2027 ($Million)
6.5.3.4.India
6.5.3.4.1.Market Assessment and Forecast, By Technology, 2017-2027 ($Million)
6.5.3.4.2.Market Assessment and Forecast, By Application, 2017-2027 ($Million)
6.5.3.5.South Korea
6.5.3.5.1.Market Assessment and Forecast, By Technology, 2017-2027 ($Million)
6.5.3.5.2.Market Assessment and Forecast, By Application, 2017-2027 ($Million)
6.5.3.6.Taiwan
6.5.3.6.1.Market Assessment and Forecast, By Technology, 2017-2027 ($Million)
6.5.3.6.2.Market Assessment and Forecast, By Application, 2017-2027 ($Million)
6.5.3.7.Rest of Asia-Pacific
6.5.3.7.1.Market Assessment and Forecast, By Technology, 2017-2027 ($Million)
6.5.3.7.2.Market Assessment and Forecast, By Application, 2017-2027 ($Million)
6.6.Rest of the World
6.6.1. Market Assessment and Forecast, By Country, 2017-2027 ($Million)
6.6.2. Market Assessment and Forecast, By Technology, 2017-2027 ($Million)
6.6.3. Market Assessment and Forecast, By Application, 2017-2027 ($Million)
6.6.3.1.Brazil
6.6.3.1.1.Market Assessment and Forecast, By Technology, 2017-2027 ($Million)
6.6.3.1.2.Market Assessment and Forecast, By Application, 2017-2027 ($Million)
6.6.3.2.Turkey
6.6.3.2.1.Market Assessment and Forecast, By Technology, 2017-2027 ($Million)
6.6.3.2.2.Market Assessment and Forecast, By Application, 2017-2027 ($Million)
6.6.3.3.Saudi Arabia
6.6.3.3.1.Market Assessment and Forecast, By Technology, 2017-2027 ($Million)
6.6.3.3.2.Market Assessment and Forecast, By Application, 2017-2027 ($Million)
6.6.3.4.South Africa
6.6.3.4.1.Market Assessment and Forecast, By Technology, 2017-2027 ($Million)
6.6.3.4.2.Market Assessment and Forecast, By Application, 2017-2027 ($Million)
6.6.3.5.United Arab Emirates
6.6.3.5.1.Market Assessment and Forecast, By Technology, 2017-2027 ($Million)
6.6.3.5.2.Market Assessment and Forecast, By Application, 2017-2027 ($Million)
6.6.3.6.Others
6.6.3.6.1.Market Assessment and Forecast, By Technology, 2017-2027 ($Million)
6.6.3.6.2.Market Assessment and Forecast, By Application, 2017-2027 ($Million)
7.Company Profiles
7.1.Royal Dutch Shell plc.
7.1.1. Business Overview
7.1.2. Product Portfolio
7.1.3. Key Financials
7.1.4. Strategic Developments
7.2.Arrow Energy Pty Ltd
7.2.1. Business Overview
7.2.2. Product Portfolio
7.2.3. Strategic Developments
7.3.Santos Ltd
7.3.1. Business Overview
7.3.2. Product Portfolio
7.3.3. Key Financials
7.3.4. Strategic Developments
7.4.Origin Energy Limited
7.4.1. Business Overview
7.4.2. Product Portfolio
7.4.3. Key Financials
7.4.4. Strategic Developments
7.5.Great Eastern Energy Corporation Ltd. (GEECL)
7.5.1. Business Overview
7.5.2. Product Portfolio
7.5.3. Key Financials
7.5.4. Strategic Developments
7.6.PetroChina Company Limited
7.6.1. Business Overview
7.6.2. Product Portfolio
7.6.3. Key Financials
7.6.4. Strategic Developments
7.7.Petroliam Nasional Berhad (PETRONAS)
7.7.1. Business Overview
7.7.2. Product Portfolio
7.7.3. Key Financials
7.7.4. Strategic Developments
7.8.Baker Hughes a GE Company
7.8.1. Business Overview
7.8.2. Product Portfolio
7.8.3. Key Financials
7.8.4. Strategic Developments
7.9.BP PLC
7.9.1. Business Overview
7.9.2. Product Portfolio
7.9.3. Key Financials
7.9.4. Strategic Developments
7.10.ConocoPhillips Company
7.10.1.Business Overview
7.10.2.Product Portfolio
7.10.3.Key Financials
7.10.4.Strategic Developments
7.11.Encana Corporation
7.11.1.Business Overview
7.11.2.Product Portfolio
7.11.3.Key Financials
7.11.4.Strategic Developments
7.12.Halliburton
7.12.1.Business Overview
7.12.2.Product Portfolio
7.12.3.Key Financials
7.12.4.Strategic Developments
7.13.Fortune Oil PLC
7.13.1.Business Overview
7.13.2.Product Portfolio
7.13.3.Strategic Developments
7.14.Metgasco Limited
7.14.1.Business Overview
7.14.2.Product Portfolio
7.14.3.Key Financials
7.14.4.Strategic Developments
List of Tables
Table 1.Coal Bed Methane (CBM) Market, By Technology ($Million), 2017-2025
Table 2.Horizontal drilling and hydraulic fracturing Market, By Region ($Million), 2017-2025
Table 3.Proppants Market, By Region ($Million), 2017-2025
Table 4.Coal Bed Methane (CBM) Market, By Application ($Million), 2017-2025
Table 5.Industrial Market, By Region ($Million), 2017-2025
Table 6.Power Generation Market, By Region ($Million), 2017-2025
Table 7.Transportation Market, By Region ($Million), 2017-2025
Table 8.Commercial Market, By Region ($Million), 2017-2025
Table 9.Residential Market, By Region ($Million), 2017-2025
Table 10.Coal Bed Methane (CBM) Market, By Region ($Million), 2017-2025
Table 11.North America Coal Bed Methane (CBM) Market, By Country, 2017-2025 ($Million)
Table 12.North America Coal Bed Methane (CBM) Market, By Technology, 2017-2025 ($Million)
Table 13.North America Coal Bed Methane (CBM) Market, By Application, 2017-2025 ($Million)
Table 14.U.S. Coal Bed Methane (CBM) Market, By Technology, 2017-2025 ($Million)
Table 15.U.S. Coal Bed Methane (CBM) Market, By Application, 2017-2025 ($Million)
Table 16.Canada Coal Bed Methane (CBM) Market, By Technology, 2017-2025 ($Million)
Table 17.Canada Coal Bed Methane (CBM) Market, By Application, 2017-2025 ($Million)
Table 18.Mexico Coal Bed Methane (CBM) Market, By Technology, 2017-2025 ($Million)
Table 19.Mexico Coal Bed Methane (CBM) Market, By Application, 2017-2025 ($Million)
Table 20.Europe Coal Bed Methane (CBM) Market, By Country, 2017-2025 ($Million)
Table 21.Europe Coal Bed Methane (CBM) Market, By Technology, 2017-2025 ($Million)
Table 22.Europe Coal Bed Methane (CBM) Market, By Application, 2017-2025 ($Million)
Table 23.Germany Coal Bed Methane (CBM) Market, By Technology, 2017-2025 ($Million)
Table 24.Germany Coal Bed Methane (CBM) Market, By Application, 2017-2025 ($Million)
Table 25.France Coal Bed Methane (CBM) Market, By Technology, 2017-2025 ($Million)
Table 26.France Coal Bed Methane (CBM) Market, By Application, 2017-2025 ($Million)
Table 27.UK Coal Bed Methane (CBM) Market, By Technology, 2017-2025 ($Million)
Table 28.UK Coal Bed Methane (CBM) Market, By Application, 2017-2025 ($Million)
Table 29.Italy Coal Bed Methane (CBM) Market, By Technology, 2017-2025 ($Million)
Table 30.Italy Coal Bed Methane (CBM) Market, By Application, 2017-2025 ($Million)
Table 31.Spain Coal Bed Methane (CBM) Market, By Technology, 2017-2025 ($Million)
Table 32.Spain Coal Bed Methane (CBM) Market, By Application, 2017-2025 ($Million)
Table 33.Russia Coal Bed Methane (CBM) Market, By Technology, 2017-2025 ($Million)
Table 34.Russia Coal Bed Methane (CBM) Market, By Application, 2017-2025 ($Million)
Table 36.Rest of Europe Coal Bed Methane (CBM) Market, By Technology, 2017-2025 ($Million)
Table 37.Rest of Europe Coal Bed Methane (CBM) Market, By Application, 2017-2025 ($Million)
Table 38.Asia-Pacific Coal Bed Methane (CBM) Market, By Country, 2017-2025 ($Million)
Table 39.Asia-Pacific Coal Bed Methane (CBM) Market, By Technology, 2017-2025 ($Million)
Table 40.Asia-Pacific Coal Bed Methane (CBM) Market, By Application, 2017-2025 ($Million)
Table 41.Japan Coal Bed Methane (CBM) Market, By Technology, 2017-2025 ($Million)
Table 42.Japan Coal Bed Methane (CBM) Market, By Application, 2017-2025 ($Million)
Table 43.China Coal Bed Methane (CBM) Market, By Technology, 2017-2025 ($Million)
Table 44.China Coal Bed Methane (CBM) Market, By Application, 2017-2025 ($Million)
Table 45.Australia Coal Bed Methane (CBM) Market, By Technology, 2017-2025 ($Million)
Table 46.Australia Coal Bed Methane (CBM) Market, By Application, 2017-2025 ($Million)
Table 47.India Coal Bed Methane (CBM) Market, By Technology, 2017-2025 ($Million)
Table 48.India Coal Bed Methane (CBM) Market, By Application, 2017-2025 ($Million)
Table 49.South Korea Coal Bed Methane (CBM) Market, By Technology, 2017-2025 ($Million)
Table 50.South Korea Coal Bed Methane (CBM) Market, By Application, 2017-2025 ($Million)
Table 51.Taiwan Coal Bed Methane (CBM) Market, By Technology, 2017-2025 ($Million)
Table 52.Taiwan Coal Bed Methane (CBM) Market, By Application, 2017-2025 ($Million)
Table 53.Rest of Asia-Pacific Coal Bed Methane (CBM) Market, By Technology, 2017-2025 ($Million)
Table 54.Rest of Asia-Pacific Coal Bed Methane (CBM) Market, By Application, 2017-2025 ($Million)
Table 55.Rest of the World Coal Bed Methane (CBM) Market, By Country, 2017-2025 ($Million)
Table 56.Rest of the World Coal Bed Methane (CBM) Market, By Technology, 2017-2025 ($Million)
Table 57.Rest of the World Coal Bed Methane (CBM) Market, By Application, 2017-2025 ($Million)
Table 58.Brazil Coal Bed Methane (CBM) Market, By Technology, 2017-2025 ($Million)
Table 59.Brazil Coal Bed Methane (CBM) Market, By Application, 2017-2025 ($Million)
Table 60.Turkey Coal Bed Methane (CBM) Market, By Technology, 2017-2025 ($Million)
Table 61.Turkey Coal Bed Methane (CBM) Market, By Application, 2017-2025 ($Million)
Table 62.Saudi Arabia Coal Bed Methane (CBM) Market, By Technology, 2017-2025 ($Million)
Table 63.Saudi Arabia Coal Bed Methane (CBM) Market, By Application, 2017-2025 ($Million)
Table 64.South Africa Coal Bed Methane (CBM) Market, By Technology, 2017-2025 ($Million)
Table 65.South Africa Coal Bed Methane (CBM) Market, By Application, 2017-2025 ($Million)
Table 66.United Arab Emirates Coal Bed Methane (CBM) Market, By Technology, 2017-2025 ($Million)
Table 67.United Arab Emirates Coal Bed Methane (CBM) Market, By Application, 2017-2025 ($Million)
Table 68.Others Coal Bed Methane (CBM) Market, By Technology, 2017-2025 ($Million)
Table 69.Others Coal Bed Methane (CBM) Market, By Application, 2017-2025 ($Million)
Table 70.Royal Dutch Shell plc.: Key Strategic Developments, 2017-2017
Table 71.Arrow Energy Pty Ltd: Key Strategic Developments, 2017-2017
Table 72.Santos Ltd: Key Strategic Developments, 2017-2017
Table 73.Origin Energy Limited: Key Strategic Developments, 2017-2017
Table 74.Great Eastern Energy Corporation Ltd. (GEECL): Key Strategic Developments, 2017-2017
Table 75.PetroChina Company Limited: Key Strategic Developments, 2017-2017
Table 76.Petroliam Nasional Berhad (PETRONAS: Key Strategic Developments, 2017-2017
Table 77.Baker Hughes a GE Company: Key Strategic Developments, 2017-2017
Table 78.BP PLC: Key Strategic Developments, 2017-2017
Table 79.ConocoPhillips Company: Key Strategic Developments, 2017-2017
Table 80.Encana Corporation: Key Strategic Developments, 2017-2017
Table 81.Halliburton: Key Strategic Developments, 2017-2017
Table 82.Fortune Oil PLC: Key Strategic Developments, 2017-2017
Table 83.Metgasco Limited: Key Strategic Developments, 2017-2017
List of Figures
Figure 1.Coal Bed Methane (CBM) Market Share, By Technology, 2017 & 2025 ($Million)
Figure 2.Coal Bed Methane (CBM) Market, By Application, 2017 & 2025 ($Million)
Figure 3.Coal Bed Methane (CBM) Market, By Region, 2017, ($Million)
Figure 4.Royal Dutch Shell plc.: Net Revenues, 2017-2017 ($Million)
Figure 5.Royal Dutch Shell plc.: Net Revenue Share, By Segment, 2017
Figure 6.Royal Dutch Shell plc.: Net Revenue Share, By Geography, 2017
Figure 7.Santos Ltd: Net Revenues, 2017-2017 ($Million)
Figure 8.Santos Ltd: Net Revenue Share, By Segment, 2017
Figure 9.Santos Ltd: Net Revenue Share, By Geography, 2017
Figure 10.Origin Energy Limited: Net Revenues, 2017-2017 ($Million)
Figure 11.Origin Energy Limited: Net Revenue Share, By Segment, 2017
Figure 12.Origin Energy Limited: Net Revenue Share, By Geography, 2017
Figure 13.Great Eastern Energy Corporation Ltd. (GEECL): Net Revenues, 2017-2017 ($Million)
Figure 14.Great Eastern Energy Corporation Ltd. (GEECL): Net Revenue Share, By Segment, 2017
Figure 15.Great Eastern Energy Corporation Ltd. (GEECL): Net Revenue Share, By Geography, 2017
Figure 16.PetroChina Company Limited: Net Revenues, 2017-2017 ($Million)
Figure 17.PetroChina Company Limited: Net Revenue Share, By Segment, 2017
Figure 18.PetroChina Company Limited: Net Revenue Share, By Geography, 2017
Figure 19.Petroliam Nasional Berhad (PETRONAS): Net Revenues, 2017-2017 ($Million)
Figure 20.Petroliam Nasional Berhad (PETRONAS): Net Revenue Share, By Segment, 2017
Figure 21.Petroliam Nasional Berhad (PETRONAS): Net Revenue Share, By Geography, 2017
Figure 22.Baker Hughes a GE Company: Net Revenues, 2017-2017 ($Million)
Figure 23.Baker Hughes a GE Company: Net Revenue Share, By Segment, 2017
Figure 24.Baker Hughes a GE Company: Net Revenue Share, By Geography, 2017
Figure 25.BP PLC: Net Revenues, 2017-2017 ($Million)
Figure 26.BP PLC: Net Revenue Share, By Segment, 2017
Figure 27.BP PLC: Net Revenue Share, By Geography, 2017
Figure 28.ConocoPhillips Company: Net Revenues, 2017-2017 ($Million)
Figure 29.ConocoPhillips Company: Net Revenue Share, By Segment, 2017
Figure 30.ConocoPhillips Company: Net Revenue Share, By Geography, 2017
Figure 31.Encana Corporation: Net Revenues, 2017-2017 ($Million)
Figure 32.Encana Corporation: Net Revenue Share, By Segment, 2017
Figure 33.Encana Corporation: Net Revenue Share, By Geography, 2017
Figure 34.Halliburton: Net Revenues, 2017-2017 ($Million)
Figure 35.Halliburton: Net Revenue Share, By Segment, 2017
Figure 36.Halliburton: Net Revenue Share, By Geography, 2017
Figure 37.Metgasco Limited: Net Revenues, 2017-2017 ($Million)
Figure 38.Metgasco Limited: Net Revenue Share, By Segment, 2017
Figure 39.Metgasco Limited: Net Revenue Share, By Geography, 2017
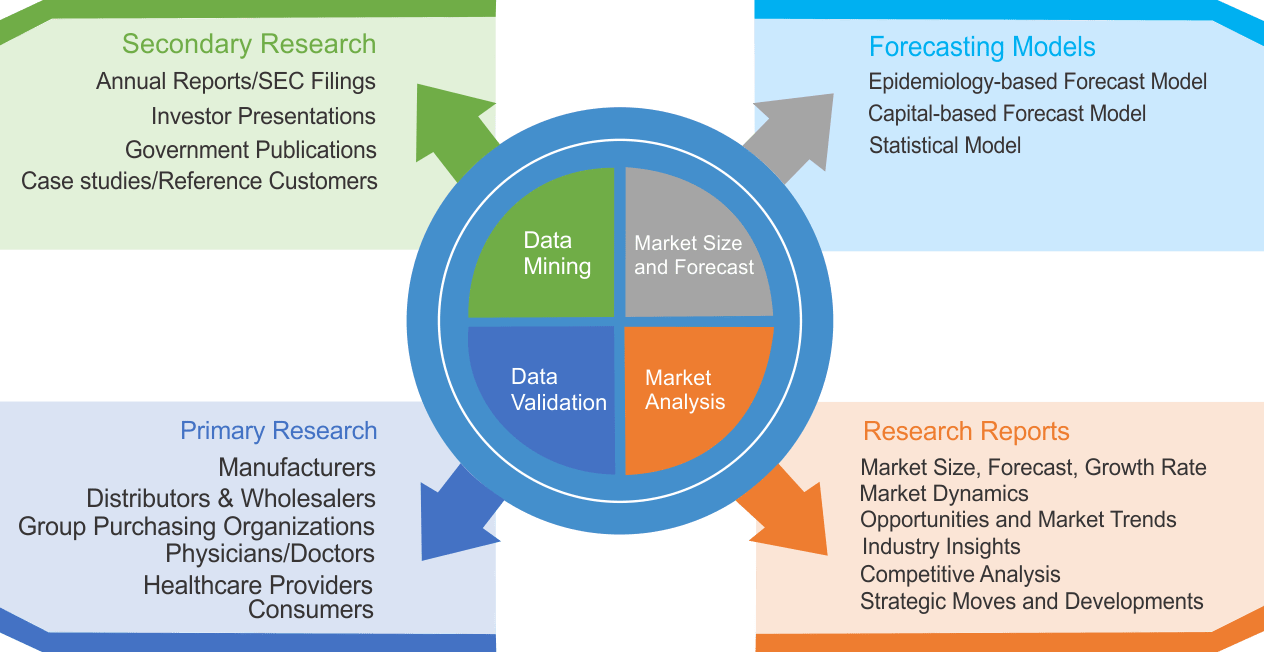
Research Methodology
We use both primary as well as secondary research for our market surveys, estimates and for developing forecast. Our research process commence by analyzing the problem which enable us to design the scope for our research study. Our research process is uniquely designed with enough flexibility to adjust according to changing nature of products and markets, while retaining core element to ensure reliability and accuracy in research findings. We understand both macro and micro-economic factors to evaluate and forecast different market segments.
Data Mining
Data is extensively collected through various secondary sources such as annual reports, investor presentations, SEC filings, and other corporate publications. We also refer trade magazines, technical journals, paid databases such as Factiva and Bloomberg, industry trade journals, scientific journals, and social media data to understand market dynamics and industry trends. Further, we also conduct primary research to understand market drivers, restraints, opportunities, challenges, and competitive scenario to build our analysis.
Data Collection Matrix
|
Data Collection Matrix |
Supply Side |
Demand Side |
|
Primary Data Sources |
|
|
|
Secondary Data Sources |
|
|
Market Modeling and Forecasting
We use epidemiology and capital equipment-based models to forecast market size of different segments at country and regional level.
- Epidemiology-based Forecasting Model: This method uses epidemiology data gathered through various publications and from physicians to estimate population of patients, flow of treatment of individual disease and therapies. The data collected through this method includes statics on incidence of disease, population suffering from disease, and treatment population. This method is used to understand:
- Number of patients for particular device or medical procedure and
- Repeated use of particular device depending on health and condition of patient
- Capital-based Forecasting Model: This method of forecasting is based on number of replacements, installed-based and new sales of capital equipment used in various healthcare and diagnostic centers. These three parameters are calculated and forecast is developed. Installation base is calculated as average number of units per facility; while sales for particular year is calculated from number of new and replace units. Secondary data is collected through various supply chain intermediaries and opinion leaders to arrive at installation and sales rate. These techniques help our analysts in validating market and developed market estimates and forecast.
We do forecast on basis of several parameters such as market drivers, market opportunities, industry trends government regulations, raw materials supply and trade dynamics to ensure relevance of forecast with market scenario. With increasing need to granulized information, we used bottom-up methodology for forecasting where we evaluate each regional segment differently and combined all forecast to develop final market forecast.
Data Validation
We believe primary research is a very important tool in analyzing and forecasting different markets. In order to make sure accuracy of our findings, our team conducts primary interviews at every stage of research to gain deep insights into current business environment and future trends and key developments in market. This includes use of various methods such as telephonic interviews, focus groups, face to face interviews and questionnaires to validate our research from all aspects. We validate our data through primary research from key industry leaders such as CEO, product managers, marketing managers, suppliers, distributors, and consumers are frequently interviewed. These interviews provide valuable insights which help us to have better market understanding besides validating our estimates and forecast.
Data Triangulation
Industry Analysis
|
Qualitative Data |
Quantitative Data (2017-2025) |
|
|