.png)
Biosurfactants Market by Product and Application - Global Industry Analysis and Forecast to 2027
Published On : September 2017 Pages : 180 Category: Renewable Chemicals Report Code : CM09208
SEGMENTS & REGIONS:
- Regions: North America, Europe, Asia- Pacific, Latin America, Middle East & Africa
Industry Outlook and Trend Analysis
The global biosurfactants market was worth USD billion in the year of 2017 and is foreseen to garner roughly USD billion by 2027, while registering itself at a compound annual growth rate (CAGR) of % during the forecast period. Surfactants are compounds amphiphilic organic that contain both hydrophilic groups that are known as the head and hydrophobic group that are known as the tail. Surfactants in which one of the groups is derived from plants are known as biosurfactants, hence they are not 100 percent derived from plants. Surfactants allow chemicals to blend more conveniently as they decrease the surface tension of liquids. Biosurfactants are made up by utilizing oleochemical raw materials that include oils derived from plants such as coconut oil and palm oil, plant carbohydrates like sucrose, glucose and sorbitol or from tallow -which is an animal fat. Biosurfactants act as extremely beneficial stabilizers like synthetic surfactants and contain foaming and wetting elements that are of immense value in various applications such as cosmetic industry and household detergents. Rising concerns in the environment that are related to the utilization of surfactants that are synthetic such as less degradability is said to be a factor that influences the growth of this market. Surfactants that are synthetic have less degradability unlike biosurfactants that have high degradability and less toxicity. Furthermore, increasing utilization of products that are bio-based is said to spur the growth of this market in the coming years. However, the concern of traditional surfactants being cost competitive may inhibit the growth of this market. Additionally, increased prices and low availability of feedstock due to requirement in various applications like downstream renewable chemicals and biofuels are anticipated to be factors that may restrict the growth of biosurfactants.
Product Outlook and Trend Analysis
The surfactant that was consumed widely was Methyl Ester Ketone (MES) that registered 33 percent of the total share in the market in the year 2017. Methyl Ester Ketone is taken from palm and coconut and is a significant alternative to surfactants that are synthetic utilized in detergents. The second largest biosurfactant to be consumed was Alkyl Polyglucoside that accounted 2 percent of the demand globally, in the year 2017. Alkyl Polyglycoside is produced for sugars and fatty alcohols and contains elements that are extremely beneficial for industrial applications. It also contains exceptional foaming elements that provide high stability. Other major products in the market were Sucrose esters and Sorbitan esters that accounted a share of 8 percent in the year 2017.
Application Outlook and Trend Analysis
The major application of biosurfactants was household detergent that held a share of 44.6 percent in the year 2017. Rising concerns in the environment regarding utilization of synthetic surfactants in detergents is anticipated to boost the utilization of biosurfactants as they give out less toxicity. Furthermore, biosurfactants contain exceptional foaming properties in contrast to synthetic surfactants that are beneficial in use of detergents. The second largest consumption of biosurfactants was is in personal care sector that accounted more than 10 percent of the share in the year 2017. The developing market for personal care products in upcoming economies along with rising awareness of the advantages of bio-based products is anticipated to fuel the requirement of biosurfactants. Food processing and industrial applications of biosurfactants held a combined share of 11 percent of the market in the year 2017. Biosurfactants are chemically stable in nature and possess an exceptional cleaning ability, owing to this they are extensively utilized as oil field chemicals.
Regional Outlook and Trend Analysis
The largest consumer of biosurfactants was Europe that accounted 50 percent of the global utilization in the year 2017. Such a high amount of biosurfactants in Europe was due to the rising awareness regarding health issues that are caused due to synthetic surfactants among consumers. Additionally, strict regulations imposed in the region promote the utilization of bio-based products instead of instead of using petroleum based products. The second largest consumer of biosurfactants was North America that accounted for a share of more than a quarter in the year 2017. The requirement of biosurfactants in the personal care products is said to fuel the demand in that region. Asia Pacific is anticipated to witness significant growth over the forecast period due to increasing applications.
Competitive Insights
The global biosurfactant market consists of various major players. The top players are Ecover and BASF Cognis. Other prominent players in the market are Urumqi Unite Bio-Technology Co. Ltd., Saraya Co. Ltd. and Mg Intobio Co., Ltd. The largest manufacturer in the year 2017 was BASF Cogins accounting a share of 20 percent.
The global Biosurfactants market is segmented as follows-
By Product
- Rhamnose Lipids
- Glycolipids
- Polysaccharides
- Sophorolipids
- Lipopeptides
- Phospholipids
- Other Products
By Application
- Agrochemicals
- Food Industry
- Healthcare
- Personal Care
- Household Detergents
- Textile
- Cosmetics
- Other Applications
By region
- North America
- U.S
- Canada
- Mexico
- Europe
- Germany
- France
- UK
- Italy
- Spain
- Rest of Europe
- Asia-Pacific
- Japan
- China
- Australia
- India
- South Korea
- Rest of Asia Pacific
- Rest of the World
- Brazil
- South Africa
- Saudi Arabia
- United Arab Emirates
- Others
Some of the key questions answered by the report are:
- What was the market size in 2017 and forecast from 2022 to 2027?
- What will be the industry market growth from 2022 to 2027?
- What are the major drivers, restraints, opportunities, challenges, and industry trends and their impact on the market forecast?
- What are the major segments leading the market growth and why?
- Which are the leading players in the market and what are the major strategies adopted by them to sustain the market competition?
Market Classification
- Biosurfactants Market, By Product, Estimates and Forecast, 2017-2027 ($Million)
- Rhamnose Lipids
- Glycolipids
- Polysaccharides
- Sophorolipids
- Lipopeptides
- Phospholipids
- Other Products
- Biosurfactants Market, By Application, Estimates and Forecast, 2017-2027 ($Million)
- Agrochemicals
- Food Industry
- Healthcare
- Personal Care
- Household Detergents
- Textile
- Cosmetics
- Other Applications
- Biosurfactants Market, By Region, Estimates and Forecast, 2017-2027 ($Million)
- North America
- North America Biosurfactants Market, By Country
- North America Biosurfactants Market, By Product
- North America Biosurfactants Market, By Application
- U.S. Biosurfactants Market, By Product
- U.S. Biosurfactants Market, By Application
- Canada Biosurfactants Market, By Product
- Canada Biosurfactants Market, By Application
- Mexico Biosurfactants Market, By Product
- Mexico Biosurfactants Market, By Application
-
- Europe
- Europe Biosurfactants Market, By Country
- Europe Biosurfactants Market, By Product
- Europe Biosurfactants Market, By Application
- Germany Biosurfactants Market, By Product
- Germany Biosurfactants Market, By Application
- France Biosurfactants Market, By Product
- France Biosurfactants Market, By Application
- UK Biosurfactants Market, By Product
- UK Biosurfactants Market, By Application
- Italy Biosurfactants Market, By Product
- Italy Biosurfactants Market, By Application
- Spain Biosurfactants Market, By Product
- Spain Biosurfactants Market, By Application
- Rest of Europe Biosurfactants Market, By Product
- Rest of Europe Biosurfactants Market, By Application
-
- Asia-Pacific
- Asia-Pacific Biosurfactants Market, By Country
- Asia-Pacific Biosurfactants Market, By Product
- Asia-Pacific Biosurfactants Market, By Application
- Japan Biosurfactants Market, By Product
- Japan Biosurfactants Market, By Application
- Australia Biosurfactants Market, By Product
- Australia Biosurfactants Market, By Application
- India Biosurfactants Market, By Product
- India Biosurfactants Market, By Application
- South Korea Biosurfactants Market, By Product
- South Korea Biosurfactants Market, By Application
- Rest of Asia-Pacific Biosurfactants Market, By Product
- Rest of Asia-Pacific Biosurfactants Market, By Application
- Asia-Pacific
-
- Rest of the World
- Rest of the World Biosurfactants Market, By Country
- Rest of the World Biosurfactants Market, By Product
- Rest of the World Biosurfactants Market, By Application
- Brazil Biosurfactants Market, By Product
- Brazil Biosurfactants Market, By Application
- South Africa Biosurfactants Market, By Product
- South Africa Biosurfactants Market, By Application
- Saudi Arabia Biosurfactants Market, By Product
- Saudi Arabia Biosurfactants Market, By Application
- Turkey Biosurfactants Market, By Product
- Turkey Biosurfactants Market, By Application
- United Arab Emirates Biosurfactants Market, By Product
- United Arab Emirates Biosurfactants Market, By Application
- Others Biosurfactants Market, By Product
- Others Biosurfactants Market, By Application
- Rest of the World
Table of Contents
1.Introduction
1.1.Report Description
1.2.Research Methodology
1.2.1. Secondary Research
1.2.2. Primary Research
2.Executive Summary
2.1.Key Highlights
3.Market Overview
3.1.Introduction
3.1.1. Market Definition
3.1.2. Market Segmentation
3.2.Market Share Analysis
3.3.Market Dynamics
3.3.1. Drivers
3.3.1.1.Amplified consumer preference toward the usage of bio products
3.3.1.2.Increasing personal care industry in developing countries
3.3.1.3.Ecological concerns regarding the utilization of synthetic surfactants
3.3.2. Restraints
3.3.2.1.Cost competency in comparison to synthetic surfactants
3.3.3. Opportunities
3.3.3.1.Advancement in the production of Eco-friendly products for future need
3.4.Industry Trends
4.Biosurfactants Market, By Product
4.1.Introduction
4.2.Biosurfactants Market Assessment and Forecast, By Product, 2017-2027
4.3.Rhamnose Lipids
4.3.1. Market Assessment and Forecast, By Region, 2017-2027 ($Million)
4.4.Glycolipids
4.4.1. Market Assessment and Forecast, By Region, 2017-2027 ($Million)
4.5.Polysaccharides
4.5.1. Market Assessment and Forecast, By Region, 2017-2027 ($Million)
4.6.Sophorolipids
4.6.1. Market Assessment and Forecast, By Region, 2017-2027 ($Million)
4.7.Lipopeptides
4.7.1. Market Assessment and Forecast, By Region, 2017-2027 ($Million)
4.8.Phospholipids
4.8.1. Market Assessment and Forecast, By Region, 2017-2027 ($Million)
4.9.Other Products
4.9.1. Market Assessment and Forecast, By Region, 2017-2027 ($Million)
5.Biosurfactants Market, By Application
5.1.Introduction
5.2.Biosurfactants Market Assessment and Forecast, By Application, 2017-2027
5.3.Agrochemicals
5.3.1.1.Market Assessment and Forecast, By Region, 2017-2027 ($Million)
5.4.Food Industry
5.4.1.1.Market Assessment and Forecast, By Region, 2017-2027 ($Million)
5.5.Healthcare
5.5.1.1.Market Assessment and Forecast, By Region, 2017-2027 ($Million)
5.6.Personal Care
5.6.1.1.Market Assessment and Forecast, By Region, 2017-2027 ($Million)
5.7.Household Detergents
5.7.1. Market Assessment and Forecast, By Region, 2017-2027 ($Million)
5.8.Textile
5.8.1. Market Assessment and Forecast, By Region, 2017-2027 ($Million)
5.9.Cosmetics
5.9.1. Market Assessment and Forecast, By Region, 2017-2027 ($Million)
5.10.Other Applications
5.10.1.1.Market Assessment and Forecast, By Region, 2017-2027 ($Million)
6.Biosurfactants Market, By Region
6.1.Introduction
6.2.Biosurfactants Market Assessment and Forecast, By Region, 2017-2027 ($Million)
6.3.North America
6.3.1. Market Assessment and Forecast, By Country, 2017-2027 ($Million)
6.3.2. Market Assessment and Forecast, By Product, 2017-2027 ($Million)
6.3.3. Market Assessment and Forecast, By Application, 2017-2027 ($Million)
6.3.3.1.U.S.
6.3.3.1.1.Market Assessment and Forecast, By Product, 2017-2027 ($Million)
6.3.3.1.2.Market Assessment and Forecast, By Application, 2017-2027 ($Million)
6.3.3.2.Canada
6.3.3.2.1.Market Assessment and Forecast, By Product, 2017-2027 ($Million)
6.3.3.2.2.Market Assessment and Forecast, By Application, 2017-2027 ($Million)
6.3.3.3.Mexico
6.3.3.3.1.Market Assessment and Forecast, By Product, 2017-2027 ($Million)
6.3.3.3.2.Market Assessment and Forecast, By Application, 2017-2027 ($Million)
6.4.Europe
6.4.1. Market Assessment and Forecast, By Country, 2017-2027 ($Million)
6.4.2. Market Assessment and Forecast, By Product, 2017-2027 ($Million)
6.4.3. Market Assessment and Forecast, By Application, 2017-2027 ($Million)
6.4.3.1.Germany
6.4.3.1.1.Market Assessment and Forecast, By Product, 2017-2027 ($Million)
6.4.3.1.2.Market Assessment and Forecast, By Application, 2017-2027 ($Million)
6.4.3.2.France
6.4.3.2.1.Market Assessment and Forecast, By Product, 2017-2027 ($Million)
6.4.3.2.2.Market Assessment and Forecast, By Product, 2017-2027 ($Million)
6.4.3.3.UK
6.4.3.3.1.Market Assessment and Forecast, By Product, 2017-2027 ($Million)
6.4.3.3.2.Market Assessment and Forecast, By Application, 2017-2027 ($Million)
6.4.3.4.Italy
6.4.3.4.1.Market Assessment and Forecast, By Product, 2017-2027 ($Million)
6.4.3.4.2.Market Assessment and Forecast, By Application, 2017-2027 ($Million)
6.4.3.5.Spain
6.4.3.5.1.Market Assessment and Forecast, By Product, 2017-2027 ($Million)
6.4.3.5.2.Market Assessment and Forecast, By Application, 2017-2027 ($Million)
6.4.3.6.Russia
6.4.3.6.1.Market Assessment and Forecast, By Product, 2017-2027 ($Million)
6.4.3.6.2.Market Assessment and Forecast, By Application, 2017-2027 ($Million)
6.4.3.7.Rest of Europe
6.4.3.7.1.Market Assessment and Forecast, By Product, 2017-2027 ($Million)
6.4.3.7.2.Market Assessment and Forecast, By Application, 2017-2027 ($Million)
6.5.Asia-Pacific
6.5.1. Market Assessment and Forecast, By Country, 2017-2027 ($Million)
6.5.2. Market Assessment and Forecast, By Product, 2017-2027 ($Million)
6.5.3. Market Assessment and Forecast, By Application, 2017-2027 ($Million)
6.5.3.1.Japan
6.5.3.1.1.Market Assessment and Forecast, By Product, 2017-2027 ($Million)
6.5.3.1.2.Market Assessment and Forecast, By Application, 2017-2027 ($Million)
6.5.3.2.China
6.5.3.2.1.Market Assessment and Forecast, By Product, 2017-2027 ($Million)
6.5.3.2.2.Market Assessment and Forecast, By Application, 2017-2027 ($Million)
6.5.3.3.Australia
6.5.3.3.1.Market Assessment and Forecast, By Product, 2017-2027 ($Million)
6.5.3.3.2.Market Assessment and Forecast, By Application, 2017-2027 ($Million)
6.5.3.4.India
6.5.3.4.1.Market Assessment and Forecast, By Product, 2017-2027 ($Million)
6.5.3.4.2.Market Assessment and Forecast, By Application, 2017-2027 ($Million)
6.5.3.5.South Korea
6.5.3.5.1.Market Assessment and Forecast, By Product, 2017-2027 ($Million)
6.5.3.5.2.Market Assessment and Forecast, By Application, 2017-2027 ($Million)
6.5.3.6.Taiwan
6.5.3.6.1.Market Assessment and Forecast, By Product, 2017-2027 ($Million)
6.5.3.6.2.Market Assessment and Forecast, By Application, 2017-2027 ($Million)
6.5.3.7.Rest of Asia-Pacific
6.5.3.7.1.Market Assessment and Forecast, By Product, 2017-2027 ($Million)
6.5.3.7.2.Market Assessment and Forecast, By Application, 2017-2027 ($Million)
6.6.Rest of the World
6.6.1. Market Assessment and Forecast, By Country, 2017-2027 ($Million)
6.6.2. Market Assessment and Forecast, By Product, 2017-2027 ($Million)
6.6.3. Market Assessment and Forecast, By Application, 2017-2027 ($Million)
6.6.3.1.Brazil
6.6.3.1.1.Market Assessment and Forecast, By Product, 2017-2027 ($Million)
6.6.3.1.2.Market Assessment and Forecast, By Application, 2017-2027 ($Million)
6.6.3.2.Turkey
6.6.3.2.1.Market Assessment and Forecast, By Product, 2017-2027 ($Million)
6.6.3.2.2.Market Assessment and Forecast, By Application, 2017-2027 ($Million)
6.6.3.3.Saudi Arabia
6.6.3.3.1.Market Assessment and Forecast, By Product, 2017-2027 ($Million)
6.6.3.3.2.Market Assessment and Forecast, By Application, 2017-2027 ($Million)
6.6.3.4.South Africa
6.6.3.4.1.Market Assessment and Forecast, By Product, 2017-2027 ($Million)
6.6.3.4.2.Market Assessment and Forecast, By Application, 2017-2027 ($Million)
6.6.3.5.United Arab Emirates
6.6.3.5.1.Market Assessment and Forecast, By Product, 2017-2027 ($Million)
6.6.3.5.2.Market Assessment and Forecast, By Application, 2017-2027 ($Million)
6.6.3.6.Others
6.6.3.6.1.Market Assessment and Forecast, By Product, 2017-2027 ($Million)
6.6.3.6.2.Market Assessment and Forecast, By Application, 2017-2027 ($Million)
7.Company Profiles
7.1.BASF SE
7.1.1. Business Overview
7.1.2. Product Portfolio
7.1.3. Key Financials
7.1.4. Strategic Developments
7.2.Ecover
7.2.1. Business Overview
7.2.2. Product Portfolio
7.2.3. Strategic Developments
7.3.Kao Corporation
7.3.1. Business Overview
7.3.2. Product Portfolio
7.3.3. Key Financials
7.3.4. Strategic Developments
7.4.Akzo Nobel N.V.
7.4.1. Business Overview
7.4.2. Product Portfolio
7.4.3. Key Financials
7.4.4. Strategic Developments
7.5.Galaxy Surfactants Ltd.
7.5.1. Business Overview
7.5.2. Product Portfolio
7.5.3. Key Financials
7.5.4. Strategic Developments
7.6.Evonik Industries AG
7.6.1. Business Overview
7.6.2. Product Portfolio
7.6.3. Key Financials
7.6.4. Strategic Developments
List of Tables
Table 1.Biosurfactants Market, By Product ($Million), 2017-2025
Table 2.Rhamnose Lipids Market, By Region ($Million), 2017-2025
Table 3.Glycolipids Market, By Region ($Million), 2017-2025
Table 4.Polysaccharides Market, By Region ($Million), 2017-2025
Table 5.Sophorolipids Market, By Region ($Million), 2017-2025
Table 6.Lipopeptides Market, By Region ($Million), 2017-2025
Table 7.Phospholipids Market, By Region ($Million), 2017-2025
Table 8.Other Products Market, By Region ($Million), 2017-2025
Table 9.Biosurfactants Market, By Application ($Million), 2017-2025
Table 10.Agrochemicals Market, By Region ($Million), 2017-2025
Table 11.Food Industry Market, By Region ($Million), 2017-2025
Table 12.Healthcare Market, By Region ($Million), 2017-2025
Table 13.Personal Care Market, By Region ($Million), 2017-2025
Table 14.Household Detergents Market, By Region ($Million), 2017-2025
Table 15.Textile Market, By Region ($Million), 2017-2025
Table 16.Cosmetics Market, By Region ($Million), 2017-2025
Table 17.Other Applications Market, By Region ($Million), 2017-2025
Table 18.Biosurfactants Market, By Region ($Million), 2017-2025
Table 19.North America Biosurfactants Market, By Country, 2017-2025 ($Million)
Table 20.North America Biosurfactants Market, By Product, 2017-2025 ($Million)
Table 21.North America Biosurfactants Market, By Application, 2017-2025 ($Million)
Table 22.U.S. Biosurfactants Market, By Product, 2017-2025 ($Million)
Table 23.U.S. Biosurfactants Market, By Application, 2017-2025 ($Million)
Table 24.Canada Biosurfactants Market, By Product, 2017-2025 ($Million)
Table 25.Canada Biosurfactants Market, By Application, 2017-2025 ($Million)
Table 26.Mexico Biosurfactants Market, By Product, 2017-2025 ($Million)
Table 27.Mexico Biosurfactants Market, By Application, 2017-2025 ($Million)
Table 28.Europe Biosurfactants Market, By Country, 2017-2025 ($Million)
Table 29.Europe Biosurfactants Market, By Product, 2017-2025 ($Million)
Table 30.Europe Biosurfactants Market, By Application, 2017-2025 ($Million)
Table 31.Germany Biosurfactants Market, By Product, 2017-2025 ($Million)
Table 32.Germany Biosurfactants Market, By Application, 2017-2025 ($Million)
Table 33.France Biosurfactants Market, By Product, 2017-2025 ($Million)
Table 34.France Biosurfactants Market, By Application, 2017-2025 ($Million)
Table 35.UK Biosurfactants Market, By Product, 2017-2025 ($Million)
Table 36.UK Biosurfactants Market, By Application, 2017-2025 ($Million)
Table 37.Italy Biosurfactants Market, By Product, 2017-2025 ($Million)
Table 38.Italy Biosurfactants Market, By Application, 2017-2025 ($Million)
Table 39.Spain Biosurfactants Market, By Product, 2017-2025 ($Million)
Table 40.Spain Biosurfactants Market, By Application, 2017-2025 ($Million)
Table 41.Russia Biosurfactants Market, By Product, 2017-2025 ($Million)
Table 42.Russia Biosurfactants Market, By Application, 2017-2025 ($Million)
Table 43.Rest of Europe Biosurfactants Market, By Product, 2017-2025 ($Million)
Table 44.Rest of Europe Biosurfactants Market, By Application, 2017-2025 ($Million)
Table 45.Asia-Pacific Biosurfactants Market, By Country, 2017-2025 ($Million)
Table 46.Asia-Pacific Biosurfactants Market, By Product, 2017-2025 ($Million)
Table 47.Asia-Pacific Biosurfactants Market, By Application, 2017-2025 ($Million)
Table 48.Japan Biosurfactants Market, By Product, 2017-2025 ($Million)
Table 49.Japan Biosurfactants Market, By Application, 2017-2025 ($Million)
Table 50.China Biosurfactants Market, By Product, 2017-2025 ($Million)
Table 51.China Biosurfactants Market, By Application, 2017-2025 ($Million)
Table 52.Australia Biosurfactants Market, By Product, 2017-2025 ($Million)
Table 53.Australia Biosurfactants Market, By Application, 2017-2025 ($Million)
Table 54.India Biosurfactants Market, By Product, 2017-2025 ($Million)
Table 55.India Biosurfactants Market, By Application, 2017-2025 ($Million)
Table 56.South Korea Biosurfactants Market, By Product, 2017-2025 ($Million)
Table 57.South Korea Biosurfactants Market, By Application, 2017-2025 ($Million)
Table 58.Taiwan Biosurfactants Market, By Product, 2017-2025 ($Million)
Table 59.Taiwan Biosurfactants Market, By Application, 2017-2025 ($Million)
Table 60.Rest of Asia-Pacific Biosurfactants Market, By Product, 2017-2025 ($Million)
Table 61.Rest of Asia-Pacific Biosurfactants Market, By Application, 2017-2025 ($Million)
Table 62.Rest of the World Biosurfactants Market, By Country, 2017-2025 ($Million)
Table 63.Rest of the World Biosurfactants Market, By Product, 2017-2025 ($Million)
Table 64.Rest of the World Biosurfactants Market, By Application, 2017-2025 ($Million)
Table 65.Brazil Biosurfactants Market, By Product, 2017-2025 ($Million)
Table 66.Brazil Biosurfactants Market, By Application, 2017-2025 ($Million)
Table 67.Turkey Biosurfactants Market, By Product, 2017-2025 ($Million)
Table 68.Turkey Biosurfactants Market, By Application, 2017-2025 ($Million)
Table 69.Saudi Arabia Biosurfactants Market, By Product, 2017-2025 ($Million)
Table 70.Saudi Arabia Biosurfactants Market, By Application, 2017-2025 ($Million)
Table 71.South Africa Biosurfactants Market, By Product, 2017-2025 ($Million)
Table 72.South Africa Biosurfactants Market, By Application, 2017-2025 ($Million)
Table 73.United Arab Emirates Biosurfactants Market, By Product, 2017-2025 ($Million)
Table 74.United Arab Emirates Biosurfactants Market, By Application, 2017-2025 ($Million)
Table 75.Others Biosurfactants Market, By Product, 2017-2025 ($Million)
Table 76.Others Biosurfactants Market, By Application, 2017-2025 ($Million)
Table 77.BASF SE: Key Strategic Developments, 2017-2017
Table 78.Ecover: Key Strategic Developments, 2017-2017
Table 79.Kao Corporation: Key Strategic Developments, 2017-2017
Table 80.Akzo Nobel N.V.: Key Strategic Developments, 2017-2017
Table 81.Galaxy Surfactants Ltd.: Key Strategic Developments, 2017-2017
Table 82.Evonik Industries AG: Key Strategic Developments, 2017-2017
List of Figures
Figure 1.Biosurfactants Market Share, By Product, 2017 & 2025 ($Million)
Figure 2.Biosurfactants Market, By Application, 2017 & 2025 ($Million)
Figure 4.Biosurfactants Market, By Region, 2017, ($Million)
Figure 5.BASF SE: Net Revenues, 2017-2017 ($Million)
Figure 6.BASF SE: Net Revenue Share, By Segment, 2017
Figure 7.BASF SE: Net Revenue Share, By Geography, 2017
Figure 8.Kao Corporation: Net Revenues, 2017-2017 ($Million)
Figure 9.Kao Corporation: Net Revenue Share, By Segment, 2017
Figure 10.Kao Corporation: Net Revenue Share, By Geography, 2017
Figure 11.Akzo Nobel N.V.: Net Revenues, 2017-2017 ($Million)
Figure 12.Akzo Nobel N.V.: Net Revenue Share, By Segment, 2017
Figure 13.Akzo Nobel N.V.: Net Revenue Share, By Geography, 2017
Figure 14.Galaxy Surfactants Ltd.: Net Revenues, 2017-2017 ($Million)
Figure 15.Galaxy Surfactants Ltd.: Net Revenue Share, By Segment, 2017
Figure 16.Galaxy Surfactants Ltd.: Net Revenue Share, By Geography, 2017
Figure 17.Knowles Electronics, LLC.: Net Revenues, 2017-2017 ($Million)
Figure 18.Knowles Electronics, LLC.: Net Revenue Share, By Segment, 2017
Figure 19.Knowles Electronics, LLC.: Net Revenue Share, By Geography, 2017
Figure 20.Evonik Industries AG: Net Revenues, 2017-2017 ($Million)
Figure 21.Evonik Industries AG: Net Revenue Share, By Segment, 2017
Figure 22.Evonik Industries AG: Net Revenue Share, By Geography, 2017
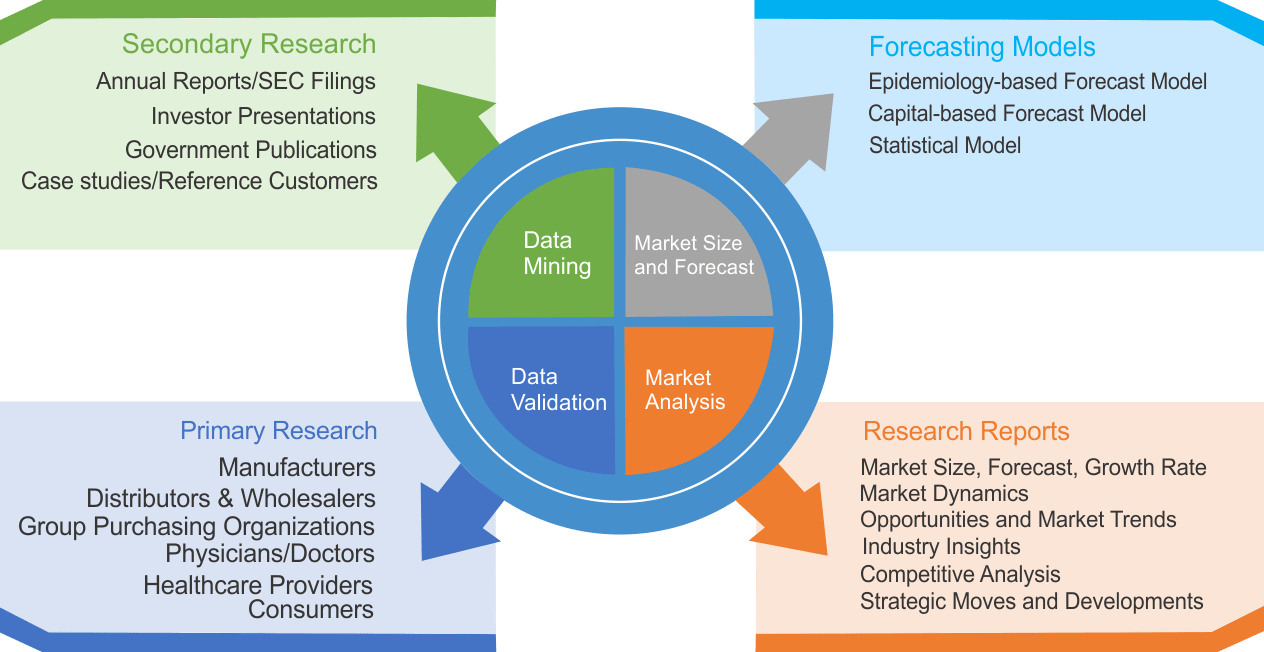
Research Methodology
We use both primary as well as secondary research for our market surveys, estimates and for developing forecast. Our research process commence by analyzing the problem which enable us to design the scope for our research study. Our research process is uniquely designed with enough flexibility to adjust according to changing nature of products and markets, while retaining core element to ensure reliability and accuracy in research findings. We understand both macro and micro-economic factors to evaluate and forecast different market segments.
Data Mining
Data is extensively collected through various secondary sources such as annual reports, investor presentations, SEC filings, and other corporate publications. We also refer trade magazines, technical journals, paid databases such as Factiva and Bloomberg, industry trade journals, scientific journals, and social media data to understand market dynamics and industry trends. Further, we also conduct primary research to understand market drivers, restraints, opportunities, challenges, and competitive scenario to build our analysis.
Data Collection Matrix
|
Data Collection Matrix |
Supply Side |
Demand Side |
|
Primary Data Sources |
|
|
|
Secondary Data Sources |
|
|
Market Modeling and Forecasting
We use epidemiology and capital equipment-based models to forecast market size of different segments at country and regional level.
- Epidemiology-based Forecasting Model: This method uses epidemiology data gathered through various publications and from physicians to estimate population of patients, flow of treatment of individual disease and therapies. The data collected through this method includes statics on incidence of disease, population suffering from disease, and treatment population. This method is used to understand:
- Number of patients for particular device or medical procedure and
- Repeated use of particular device depending on health and condition of patient
- Capital-based Forecasting Model: This method of forecasting is based on number of replacements, installed-based and new sales of capital equipment used in various healthcare and diagnostic centers. These three parameters are calculated and forecast is developed. Installation base is calculated as average number of units per facility; while sales for particular year is calculated from number of new and replace units. Secondary data is collected through various supply chain intermediaries and opinion leaders to arrive at installation and sales rate. These techniques help our analysts in validating market and developed market estimates and forecast.
We do forecast on basis of several parameters such as market drivers, market opportunities, industry trends government regulations, raw materials supply and trade dynamics to ensure relevance of forecast with market scenario. With increasing need to granulized information, we used bottom-up methodology for forecasting where we evaluate each regional segment differently and combined all forecast to develop final market forecast.
Data Validation
We believe primary research is a very important tool in analyzing and forecasting different markets. In order to make sure accuracy of our findings, our team conducts primary interviews at every stage of research to gain deep insights into current business environment and future trends and key developments in market. This includes use of various methods such as telephonic interviews, focus groups, face to face interviews and questionnaires to validate our research from all aspects. We validate our data through primary research from key industry leaders such as CEO, product managers, marketing managers, suppliers, distributors, and consumers are frequently interviewed. These interviews provide valuable insights which help us to have better market understanding besides validating our estimates and forecast.
Data Triangulation
Industry Analysis
|
Qualitative Data |
Quantitative Data (2017-2025) |
|
|