.png)
Biosimulation Market by Product, Application, and End User - Global Industry Analysis and Forecast to 2027
Published On : May 2022 Pages : 97 Category: Medical Devices Report Code : HC0637
SEGMENTS & REGIONS:
- Regions: North America, Europe, Asia- Pacific, Latin America, Middle East & Africa
Industry Trend Analysis
The biosimulation market is expected to be around $4 billion by 2027. This growth can be attributed to number of factors such as rise in incidence of chronic diseases such as diabetes, rise in aging population, high rate of drug resistance and failure. Moreover, unavailability of drugs to treat diseases such as AIDS and cancer is expected to further drive the global market. Further, rise in disposable income of the people and technological advancements such as use of micro assays for gene sequencing and analysis is set to contribute to the market growth. However, lack of standard method for biosimulation, lack of knowledge and unavailability of skilled professionals will restraint the market growth.
Product Outlook and Trend Analysis
Software segment accounted for the largest share of the global biosimulation market in 2017, as software being crucial component of the process. The onset of high end in silico software is expected to open up new pathway for improved personalized medicines and enable better disease care management through improved drug designing and medication.
Application Outlook and Trend Analysis
Drug development segment accounted for the largest share of the overall market in 2017 and is projected to witness robust growth during the forecast period, due to advancements in software for new drug development. The inclusion of high end software’s in drug designing will facilitate enhanced disease care through development of novel drugs especially in the field of personalized medicine.
End User Outlook and Trend Analysis
Pharmaceutical and biotechnology companies segment occupied major share of the global market in 2017 owing to rise in adoption rate of high end in silico software’s for developing new and advanced drugs for various diseases such as cancer and diabetes.
Regional Outlook and Trend Analysis
North America dominated the global market in 2017. This can be attributed to number of factors such as developed healthcare infrastructure, technological innovations such as development of biochips and advanced cell assay methods, and increase in number of patent files for many drugs and search for new drug entity. Asia-Pacific market is expected to grow at highest rate over the forecast period, owing to various factors such as increase disposable income of people, rapid healthcare infrastructure development and increasing need for integrating IT software in healthcare systems.
Competitive Analysis
Some of the major players in biosimulation market include Rhenovia Pharma Ltd., Dassault Systemes SA, Chemical Computing Group, Inc., Advanced Chemistry Development, Inc., Certara USA, Inc., Simulation Plus, Inc., Schrodinger, Inc., Entelos, Inc., Physiomics PLC, and Genedata AG. The major strategies adopted by them to sustain the market competition are increasing collaborations and partnerships, patient medication, mergers and acquisitions, drug repositioning, modeling and simulations in pediatrics drug development and new product launches. For instance, in December 2017, Chemical Computing Group, Inc. launched new version of its protein structure database system - PSILO 2017.10 with easy access to protein structural information leading to quick discovery of drugs.
Market Opportunities
There is a continuous rise in the demand for advanced software programs, which will provide ample growth opportunities for players operating in the global market. Technological advancements such as gene analysis, sequencing and coding, development of advanced mathematical model for biological assays and new methods of cell-based assays are expected to provide profitable market growth in coming years.
Biosimulation market is segmented as follows:
By Product:
- Services
- In-house Services
- Contract Services
- Software
By Application:
- Drug Discovery
- Drug Development
- Others
By End User:
- Regulatory Authorities
- Pharmaceutical & Biotechnology Companies
- Academic Research Institutions
- CROs
By Region:
- North America
- U.S
- Canada
- Mexico
- Europe
- Germany
- France
- UK
- Italy
- Spain
- Rest of Europe
- Asia-Pacific
- Japan
- China
- Australia
- India
- South Korea
- Rest of Asia-Pacific
- Rest of the World
- Brazil
- South Africa
- Saudi Arabia
- Turkey
- United Arab Emirates
- Others
Some of the key questions answered by the report are:
- What was the market size in 2017 and forecast from 2022 to 2027?
- What will be the industry market growth from 2022 to 2027?
- What are the major drivers, restraints, opportunities, challenges, and industry trends and their impact on the market forecast?
- What are the major segments leading the market growth and why?
- Which are the leading players in the market and what are the major strategies adopted by them to sustain the market competition?
Market Classification
- Biosimulation Market, By Product, Estimates and Forecast, 2017-2027 ($Million)
- Services
- In-house Services
- Contract Services
- Software
- Biosimulation Market, By Application, Estimates and Forecast, 2017-2027 ($Million)
- Drug Discovery
- Drug Development
- Others
- Biosimulation Market, By End User, Estimates and Forecast, 2017-2027 ($Million)
- Regulatory Authorities
- Pharmaceutical & Biotechnology Companies
- Academic Research Institutions
- CROs
- Biosimulation Market, By Region, Estimates and Forecast, 2017-2027 ($Million)
- North America
- North America Biosimulation Market, By Country
- North America Biosimulation Market, By Product
- North America Biosimulation Market, By Application
- North America Biosimulation Market, By End User
- U.S. Biosimulation Market, By Product
- U.S. Biosimulation Market, By Application
- U.S. Biosimulation Market, By End User
- Canada Biosimulation Market, By Product
- Canada Biosimulation Market, By Application
- Canada Biosimulation Market, By End User
- Mexico Biosimulation Market, By Product
- Mexico Biosimulation Market, By Application
- Mexico Biosimulation Market, By End User
-
- Europe
- Europe Biosimulation Market, By Country
- Europe Biosimulation Market, By Product
- Europe Biosimulation Market, By Application
- Europe Biosimulation Market, By End User
- Germany Biosimulation Market, By Product
- Germany Biosimulation Market, By Application
- Germany Biosimulation Market, By End User
- France Biosimulation Market, By Product
- France Biosimulation Market, By Application
- France Biosimulation Market, By End User
- UK Biosimulation Market, By Product
- UK Biosimulation Market, By Application
- UK Biosimulation Market, By End User
- Italy Biosimulation Market, By Product
- Italy Biosimulation Market, By Application
- Italy Biosimulation Market, By End User
- Spain Biosimulation Market, By Product
- Spain Biosimulation Market, By Application
- Spain Biosimulation Market, By End User
- Rest of Europe Biosimulation Market, By Product
- Rest of Europe Biosimulation Market, By Application
- Rest of Europe Biosimulation Market, By End User
-
- Asia-Pacific
- Asia-Pacific Biosimulation Market, By Country
- Asia-Pacific Biosimulation Market, By Product
- Asia-Pacific Biosimulation Market, By Application
- Asia-Pacific Biosimulation Market, By End User
- Japan Biosimulation Market, By Product
- Japan Biosimulation Market, By Application
- Japan Biosimulation Market, By End User
- China Biosimulation Market, By Product
- China Biosimulation Market, By Application
- China Biosimulation Market, By End User
- Australia Biosimulation Market, By Product
- Australia Biosimulation Market, By Application
- Australia Biosimulation Market, By End User
- India Biosimulation Market, By Product
- India Biosimulation Market, By Application
- India Biosimulation Market, By End User
- South Korea Biosimulation Market, By Product
- South Korea Biosimulation Market, By Application
- South Korea Biosimulation Market, By End User
- Rest of Asia-Pacific Biosimulation Market, By Product
- Rest of Asia-Pacific Biosimulation Market, By Application
- Rest of Asia-Pacific Biosimulation Market, By End User
-
- Rest of the World
- Rest of the World Biosimulation Market, By Country
- Rest of the World Biosimulation Market, By Product
- Rest of the World Biosimulation Market, By Application
- Rest of the World Biosimulation Market, By End User
- Brazil Biosimulation Market, By Product
- Brazil Biosimulation Market, By Application
- Brazil Biosimulation Market, By End User
- South Africa Biosimulation Market, By Product
- South Africa Biosimulation Market, By Application
- South Africa Biosimulation Market, By End User
- Saudi Arabia Biosimulation Market, By Product
- Saudi Arabia Biosimulation Market, By Application
- Saudi Arabia Biosimulation Market, By End User
- Turkey Biosimulation Market, By Product
- Turkey Biosimulation Market, By Application
- Turkey Biosimulation Market, By End User
- United Arab Emirates Biosimulation Market, By Product
- United Arab Emirates Biosimulation Market, By Application
- United Arab Emirates Biosimulation Market, By End User
- Other Biosimulation Market, By Product
- Other Biosimulation Market, By Application
- Other Biosimulation Market, By End User
Table of Contents
1. Introduction
1.1. Report Description
1.2. Research Methodology
1.2.1. Secondary Research
1.2.2. Primary Research
2. Executive Summary
2.1. Key Highlights
3. Market Overview
3.1. Introduction
3.1.1. Market Definition
3.1.2. Market Segmentation
3.2. Market Share Analysis
3.3. Market Dynamics
3.3.1. Drivers
3.3.1.1. Rise in Incidence of Diabetes
3.3.1.2. Rise in Aging Population
3.3.1.3. High Rate of Drug Resistance
3.3.2. Restraints
3.3.2.1. Lack of Standard Method for Biosimulation
3.3.2.2. Lack of Knowledge and Unavailability of Skilled Professionals
3.3.3. Opportunities
3.3.3.1. Continuous Rise in Demand for Advanced Software Programs
3.3.3.2. Technological Advancements
3.4. Industry Trends
4. Biosimulation Market, By Product
4.1. Introduction
4.2. The Biosimulation Market Assessment and Forecast, By Product, 2017-2027
4.3. Services
4.3.1. Market Assessment and Forecast, By Type, 2017-2027 ($Million)
4.3.2. Market Assessment and Forecast, By Region, 2017-2027 ($Million)
4.3.3. In-house Services
4.3.3.1. Market Assessment and Forecast, By Region, 2017-2027 ($Million)
4.3.4. Contract Services
4.3.4.1. Market Assessment and Forecast, By Region, 2017-2027 ($Million)
4.4. Services
4.4.1. Market Assessment and Forecast, By Region, 2017-2027 ($Million)
5. Biosimulation Market, By Application
5.1. Introduction
5.2. Biosimulation Market Assessment and Forecast, By Application, 2017-2027
5.3. Drug Discovery
5.3.1. Market Assessment and Forecast, By Region, 2017-2027 ($Million)
5.4. Drug Development
5.4.1. Market Assessment and Forecast, By Region, 2017-2027 ($Million)
5.5. Others
5.5.1. Market Assessment and Forecast, By Region, 2017-2027 ($Million)
6. Biosimulation Market, By End User
6.1. Introduction
6.2. Biosimulation Market Assessment and Forecast, By End User, 2017-2027
6.3. Regulatory Authorities
6.3.1. Market Assessment and Forecast, By Region, 2017-2027 ($Million)
6.4. Pharmaceutical & Biotechnology Companies
6.4.1. Market Assessment and Forecast, By Region, 2017-2027 ($Million)
6.5. Academic Research Institutions
6.5.1. Market Assessment and Forecast, By Region, 2017-2027 ($Million)
6.6. CROs
6.6.1. Market Assessment and Forecast, By Region, 2017-2027 ($Million)
7. Biosimulation Market, By Region
7.1. Introduction
7.2. Biosimulation Market Assessment and Forecast, By Product, 2017-2027 ($Million)
7.3. Biosimulation Market Assessment and Forecast, By Application, 2017-2027 ($Million)
7.4. Biosimulation Market Assessment and Forecast, By End User, 2017-2027 ($Million)
7.5. North America
7.5.1. Market Assessment and Forecast, By Country, 2017-2027 ($Million)
7.5.2. Market Assessment and Forecast, By Product, 2017-2027 ($Million)
7.5.3. Market Assessment and Forecast, By Application, 2017-2027 ($Million)
7.5.4. Market Assessment and Forecast, By End User, 2017-2027 ($Million)
7.5.4.1. U.S.
7.5.4.1.1. Market Assessment and Forecast, By Product, 2017-2027 ($Million)
7.5.4.1.2. Market Assessment and Forecast, By Application, 2017-2027 ($Million)
7.5.4.1.3. Market Assessment and Forecast, By End User, 2017-2027 ($Million)
7.5.4.2. Canada
7.5.4.2.1. Market Assessment and Forecast, By Product, 2017-2027 ($Million)
7.5.4.2.2. Market Assessment and Forecast, By Application, 2017-2027 ($Million)
7.5.4.2.3. Market Assessment and Forecast, By End User, 2017-2027 ($Million)
7.5.4.3. Mexico
7.5.4.3.1. Market Assessment and Forecast, By Product, 2017-2027 ($Million)
7.5.4.3.2. Market Assessment and Forecast, By Application, 2017-2027 ($Million)
7.5.4.3.3. Market Assessment and Forecast, By End User, 2017-2027 ($Million)
7.6. Europe
7.6.1. Market Assessment and Forecast, By Country, 2017-2027 ($Million)
7.6.2. Market Assessment and Forecast, By Product, 2017-2027 ($Million)
7.6.3. Market Assessment and Forecast, By Application, 2017-2027 ($Million)
7.6.4. Market Assessment and Forecast, By End User, 2017-2027 ($Million)
7.6.4.1. Germany
7.6.4.1.1. Market Assessment and Forecast, By Product, 2017-2027 ($Million)
7.6.4.1.2. Market Assessment and Forecast, By Application, 2017-2027 ($Million)
7.6.4.1.3. Market Assessment and Forecast, By End User, 2017-2027 ($Million)
7.6.4.2. France
7.6.4.2.1. Market Assessment and Forecast, By Product, 2017-2027 ($Million)
7.6.4.2.2. Market Assessment and Forecast, By Application, 2017-2027 ($Million)
7.6.4.2.3. Market Assessment and Forecast, By End User, 2017-2027 ($Million)
7.6.4.3. UK
7.6.4.3.1. Market Assessment and Forecast, By Product, 2017-2027 ($Million)
7.6.4.3.2. Market Assessment and Forecast, By Application, 2017-2027 ($Million)
7.6.4.3.3. Market Assessment and Forecast, By End User, 2017-2027 ($Million)
7.6.4.4. Italy
7.6.4.4.1. Market Assessment and Forecast, By Product, 2017-2027 ($Million)
7.6.4.4.2. Market Assessment and Forecast, By Application, 2017-2027 ($Million)
7.6.4.4.3. Market Assessment and Forecast, By End User, 2017-2027 ($Million)
7.6.4.5. Spain
7.6.4.5.1. Market Assessment and Forecast, By Product, 2017-2027 ($Million)
7.6.4.5.2. Market Assessment and Forecast, By Application, 2017-2027 ($Million)
7.6.4.5.3. Market Assessment and Forecast, By End User, 2017-2027 ($Million)
7.6.4.6. Russia
7.6.4.6.1. Market Assessment and Forecast, By Product, 2017-2027 ($Million)
7.6.4.6.2. Market Assessment and Forecast, By Application, 2017-2027 ($Million)
7.6.4.6.3. Market Assessment and Forecast, By End User, 2017-2027 ($Million)
7.6.4.7. Rest of Europe
7.6.4.7.1. Market Assessment and Forecast, By Product, 2017-2027 ($Million)
7.6.4.7.2. Market Assessment and Forecast, By Application, 2017-2027 ($Million)
7.6.4.7.3. Market Assessment and Forecast, By End User, 2017-2027 ($Million)
7.7. Asia-Pacific
7.7.1. Market Assessment and Forecast, By Country, 2017-2027 ($Million)
7.7.2. Market Assessment and Forecast, By Product, 2017-2027 ($Million)
7.7.3. Market Assessment and Forecast, By Application, 2017-2027 ($Million)
7.7.4. Market Assessment and Forecast, By End User, 2017-2027 ($Million)
7.7.4.1. Japan
7.7.4.1.1. Market Assessment and Forecast, By Product, 2017-2027 ($Million)
7.7.4.1.2. Market Assessment and Forecast, By Application, 2017-2027 ($Million)
7.7.4.1.3. Market Assessment and Forecast, By End User, 2017-2027 ($Million)
7.7.4.2. China
7.7.4.2.1. Market Assessment and Forecast, By Product, 2017-2027 ($Million)
7.7.4.2.2. Market Assessment and Forecast, By Application, 2017-2027 ($Million)
7.7.4.2.3. Market Assessment and Forecast, By End User, 2017-2027 ($Million)
7.7.4.3. Australia
7.7.4.3.1. Market Assessment and Forecast, By Product, 2017-2027 ($Million)
7.7.4.3.2. Market Assessment and Forecast, By Application, 2017-2027 ($Million)
7.7.4.3.3. Market Assessment and Forecast, By End User, 2017-2027 ($Million)
7.7.4.4. India
7.7.4.4.1. Market Assessment and Forecast, By Product, 2017-2027 ($Million)
7.7.4.4.2. Market Assessment and Forecast, By Application, 2017-2027 ($Million)
7.7.4.4.3. Market Assessment and Forecast, By End User, 2017-2027 ($Million)
7.7.4.5. South Korea
7.7.4.5.1. Market Assessment and Forecast, By Product, 2017-2027 ($Million)
7.7.4.5.2. Market Assessment and Forecast, By Application, 2017-2027 ($Million)
7.7.4.5.3. Market Assessment and Forecast, By End User, 2017-2027 ($Million)
7.7.4.6. Taiwan
7.7.4.6.1. Market Assessment and Forecast, By Product, 2017-2027 ($Million)
7.7.4.6.2. Market Assessment and Forecast, By Application, 2017-2027 ($Million)
7.7.4.6.3. Market Assessment and Forecast, By End User, 2017-2027 ($Million)
7.7.4.7. Rest of Asia-Pacific
7.7.4.7.1. Market Assessment and Forecast, By Product, 2017-2027 ($Million)
7.7.4.7.2. Market Assessment and Forecast, By End User, 2017-2027 ($Million)
7.7.4.7.3. Market Assessment and Forecast, By Application, 2017-2027 ($Million)
7.8. Rest of the World
7.8.1. Market Assessment and Forecast, By Country, 2017-2027 ($Million)
7.8.2. Market Assessment and Forecast, By Product, 2017-2027 ($Million)
7.8.3. Market Assessment and Forecast, By Application, 2017-2027 ($Million)
7.8.4. Market Assessment and Forecast, By End User, 2017-2027 ($Million)
7.8.4.1. Brazil
7.8.4.1.1. Market Assessment and Forecast, By Product, 2017-2027 ($Million)
7.8.4.1.2. Market Assessment and Forecast, By Application, 2017-2027 ($Million)
7.8.4.1.3. Market Assessment and Forecast, By End User, 2017-2027 ($Million)
7.8.4.2. Turkey
7.8.4.2.1. Market Assessment and Forecast, By Product, 2017-2027 ($Million)
7.8.4.2.2. Market Assessment and Forecast, By Application, 2017-2027 ($Million)
7.8.4.2.3. Market Assessment and Forecast, By End User, 2017-2027 ($Million)
7.8.4.3. Saudi Arabia
7.8.4.3.1. Market Assessment and Forecast, By Product, 2017-2027 ($Million)
7.8.4.3.2. Market Assessment and Forecast, By Application, 2017-2027 ($Million)
7.8.4.3.3. Market Assessment and Forecast, By End User, 2017-2027 ($Million)
7.8.4.4. South Africa
7.8.4.4.1. Market Assessment and Forecast, By Product, 2017-2027 ($Million)
7.8.4.4.2. Market Assessment and Forecast, By Application, 2017-2027 ($Million)
7.8.4.4.3. Market Assessment and Forecast, By End User, 2017-2027 ($Million)
7.8.4.5. United Arab Emirates
7.8.4.5.1. Market Assessment and Forecast, By Product, 2017-2027 ($Million)
7.8.4.5.2. Market Assessment and Forecast, By Application, 2017-2027 ($Million)
7.8.4.5.3. Market Assessment and Forecast, By End User, 2017-2027 ($Million)
7.8.4.6. Others
7.8.4.6.1. Market Assessment and Forecast, By Product, 2017-2027 ($Million)
7.8.4.6.2. Market Assessment and Forecast, By Application, 2017-2027 ($Million)
7.8.4.6.3. Market Assessment and Forecast, By End User, 2017-2027 ($Million)
8. Company Profiles
8.1. Certara USA, Inc.
8.1.1. Business Overview
8.1.2. Product Portfolio
8.1.3. Key Financials
8.1.4. Strategic Developments
8.2. Simulation Plus, Inc.
8.2.1. Business Overview
8.2.2. Product Portfolio
8.2.3. Key Financials
8.2.4. Strategic Developments
8.3. Dassault Systems SA
8.3.1. Business Overview
8.3.2. Product Portfolio
8.3.3. Key Financials
8.3.4. Strategic Developments
8.4. Schrodinger, Inc.
8.4.1. Business Overview
8.4.2. Product Portfolio
8.4.3. Strategic Developments
8.5. Advanced Chemistry Development, Inc.
8.5.1. Business Overview
8.5.2. Product Portfolio
8.5.3. Strategic Developments
8.6. Chemical Computing Group, Inc.
8.6.1. Business Overview
8.6.2. Product Portfolio
8.6.3. Key Financials
8.6.4. Strategic Developments
8.7. Physiomics PLC
8.7.1. Business Overview
8.7.2. Product Portfolio
8.7.3. Key Financials
8.7.4. Strategic Developments
8.8. Entelos, Inc.
8.8.1. Business Overview
8.8.2. Product Portfolio
8.8.3. Strategic Developments
8.9. Rhenovia Pharma Ltd.
8.9.1. Business Overview
8.9.2. Product Portfolio
8.9.3. Strategic Developments
8.10. Genedata AG
8.10.1. Business Overview
8.10.2. Product Portfolio
8.10.3. Key Financials
8.10.4. Strategic Developments
List of Tables
Table 1.Global Biosimulation Market, By Product, 2017-2025 ($Million)
Table 2.Services Market, By Type, 2017-2025 ($Million)
Table 3.Services Market, By Region, 2017-2025 ($Million)
Table 4.In-house Services Market, By Region, 2017-2025 ($Million)
Table 5.Contract Services Market, By Region, 2017-2025 ($Million)
Table 6.Software Market, By Region, 2017-2025 ($Million)
Table 7.Global Biosimulation Market, By Application, 2017-2025 ($Million)
Table 8.Drug Discovery Market, By Region, 2017-2025 ($Million)
Table 9.Drug Development Market, By Region, 2017-2025 ($Million)
Table 10.Other Market, By Region, 2017-2025 ($Million)
Table 11.Global Biosimulation Market, By End User, 2017-2025 ($Million)
Table 12.Regulatory Authorities Market, By Region, 2017-2025 ($Million)
Table 13.Pharmaceutical & Biotechnology Companies Market, By Region, 2017-2025 ($Million)
Table 14.Academic Research Institutions Market, By Region, 2017-2025 ($Million)
Table 15.CROs Market, By Region, 2017-2025 ($Million)
Table 16.North America Biosimulation Market, By Country, 2017-2025 ($Million)
Table 17.North America Biosimulation Market, By Product, 2017-2025 ($Million)
Table 18.North America Biosimulation Market, By Application, 2017-2025 ($Million)
Table 19.North America Biosimulation Market, By End User, 2017-2025 ($Million)
Table 20.U.S. Biosimulation Market, By Product, 2017-2025 ($Million)
Table 21.U.S. Biosimulation Market, By Application, 2017-2025 ($Million)
Table 22.U.S. Biosimulation Market, By End User, 2017-2025 ($Million)
Table 23.Canada Biosimulation Market, By Product, 2017-2025 ($Million)
Table 24.Canada Biosimulation Market, By Application, 2017-2025 ($Million)
Table 25.Canada Biosimulation Market, By End User, 2017-2025 ($Million)
Table 26.Mexico Biosimulation Market, By Product, 2017-2025 ($Million)
Table 27.Mexico Biosimulation Market, By Application, 2017-2025 ($Million)
Table 28.Mexico Biosimulation Market, By End User, 2017-2025 ($Million)
Table 29.Europe Biosimulation Market, By Country, 2017-2025 ($Million)
Table 30.Europe Biosimulation Market, By Product, 2017-2025 ($Million)
Table 31.Europe Biosimulation Market, By Application, 2017-2025 ($Million)
Table 32.Europe Biosimulation Market, By End User, 2017-2025 ($Million)
Table 33.Germany Biosimulation Market, By Product, 2017-2025 ($Million)
Table 34.Germany Biosimulation Market, By Application, 2017-2025 ($Million)
Table 35.Germany Biosimulation Market, By End User, 2017-2025 ($Million)
Table 36.France Biosimulation Market, By Product, 2017-2025 ($Million)
Table 37.France Biosimulation Market, By Application, 2017-2025 ($Million)
Table 38.France Biosimulation Market, By End User, 2017-2025 ($Million)
Table 39.UK Biosimulation Market, By Product, 2017-2025 ($Million)
Table 40.UK Biosimulation Market, By Application, 2017-2025 ($Million)
Table 41.UK Biosimulation Market, By End User, 2017-2025 ($Million)
Table 42.Italy Biosimulation Market, By Product, 2017-2025 ($Million)
Table 43.Italy Biosimulation Market, By Application, 2017-2025 ($Million)
Table 44.Italy Biosimulation Market, By End User, 2017-2025 ($Million)
Table 45.Spain Biosimulation Market, By Product, 2017-2025 ($Million)
Table 46.Spain Biosimulation Market, By Application, 2017-2025 ($Million)
Table 47.Spain Biosimulation Market, By End User, 2017-2025 ($Million)
Table 48.Russia Biosimulation Market, By Product, 2017-2025 ($Million)
Table 49.Russia Biosimulation Market, By Application, 2017-2025 ($Million)
Table 50.Russia Biosimulation Market, By End User, 2017-2025 ($Million)
Table 51.Rest of Europe Biosimulation Market, By Product, 2017-2025 ($Million)
Table 52.Rest of Europe Biosimulation Market, By Application, 2017-2025 ($Million)
Table 53.Rest of Europe Biosimulation Market, By End User, 2017-2025 ($Million)
Table 54.Asia-Pacific Biosimulation Market, By Country, 2017-2025 ($Million)
Table 55.Asia-Pacific Biosimulation Market, By Product, 2017-2025 ($Million)
Table 56.Asia-Pacific Biosimulation Market, By Application, 2017-2025 ($Million)
Table 57.Asia-Pacific Biosimulation Market, By End User, 2017-2025 ($Million)
Table 58.Japan Biosimulation Market, By Product, 2017-2025 ($Million)
Table 59.Japan Biosimulation Market, By Application, 2017-2025 ($Million)
Table 60.Japan Biosimulation Market, By End User, 2017-2025 ($Million)
Table 61.China Biosimulation Market, By Product, 2017-2025 ($Million)
Table 62.China Biosimulation Market, By Application, 2017-2025 ($Million)
Table 63.China Biosimulation Market, By End User, 2017-2025 ($Million)
Table 64.Australia Biosimulation Market, By Product, 2017-2025 ($Million)
Table 65.Australia Biosimulation Market, By Application, 2017-2025 ($Million)
Table 66.Australia Biosimulation Market, By End User, 2017-2025 ($Million)
Table 67.India Biosimulation Market, By Product, 2017-2025 ($Million)
Table 68.India Biosimulation Market, By Application, 2017-2025 ($Million)
Table 69.India Biosimulation Market, By End User, 2017-2025 ($Million)
Table 70.South Korea Biosimulation Market, By Product, 2017-2025 ($Million)
Table 71.South Korea Biosimulation Market, By Application, 2017-2025 ($Million)
Table 72.South Korea Biosimulation Market, By End User, 2017-2025 ($Million)
Table 73.Taiwan Biosimulation Market, By Product, 2017-2025 ($Million)
Table 74.Taiwan Biosimulation Market, By Application, 2017-2025 ($Million)
Table 75.Taiwan Biosimulation Market, By End User, 2017-2025 ($Million)
Table 76.Rest of Asia-Pacific Biosimulation Market, By Product, 2017-2025 ($Million)
Table 77.Rest of Asia-Pacific Biosimulation Market, By Application, 2017-2025 ($Million)
Table 78.Rest of Asia-Pacific Biosimulation Market, By End User, 2017-2025 ($Million)
Table 79.Rest of the World Biosimulation Market, By Country, 2017-2025 ($Million)
Table 80.Rest of the World Biosimulation Market, By Product, 2017-2025 ($Million)
Table 81.Rest of the World Biosimulation Market, By Application, 2017-2025 ($Million)
Table 82.Rest of the World Biosimulation Market, By End User, 2017-2025 ($Million)
Table 83.Brazil Biosimulation Market, By Product, 2017-2025 ($Million)
Table 84.Brazil Biosimulation Market, By Application, 2017-2025 ($Million)
Table 85.Brazil Biosimulation Market, By End User, 2017-2025 ($Million)
Table 86.Turkey Biosimulation Market, By Product, 2017-2025 ($Million)
Table 87.Turkey Biosimulation Market, By Application, 2017-2025 ($Million)
Table 88.Turkey Biosimulation Market, By End User, 2017-2025 ($Million)
Table 89.Saudi Arabia Biosimulation Market, By Product, 2017-2025 ($Million)
Table 90.Saudi Arabia Biosimulation Market, By Application, 2017-2025 ($Million)
Table 91.Saudi Arabia Biosimulation Market, By End User, 2017-2025 ($Million)
Table 92.South Africa Biosimulation Market, By Product, 2017-2025 ($Million)
Table 93.South Africa Biosimulation Market, By Application, 2017-2025 ($Million)
Table 94.South Africa Biosimulation Market, By End User, 2017-2025 ($Million)
Table 95.United Arab Emirates Biosimulation Market, By Product, 2017-2025 ($Million)
Table 96.United Arab Emirates Biosimulation Market, By Application, 2017-2025 ($Million)
Table 97.United Arab Emirates Biosimulation Market, By End User, 2017-2025 ($Million)
Table 98.Others Biosimulation Market, By Product, 2017-2025 ($Million)
Table 99.Others Biosimulation Market, By Application, 2017-2025 ($Million)
Table 100.Others Biosimulation Market, By End User, 2017-2025 ($Million)
Table 101.Certara USA, Inc.: Key Strategic Developments, 2017-2017
Table 102.Simulation Plus, Inc.: Key Strategic Developments, 2017-2017
Table 103.Dassault Systems SA: Key Strategic Developments, 2017-2017
Table 104.Schrodinger, Inc.: Key Strategic Developments, 2017-2017
Table 105.Advanced Chemistry Development, Inc.: Key Strategic Developments, 2017-2017
Table 106.Chemical Computing Group, Inc.: Key Strategic Developments, 2017-2017
Table 107.Physiomics PLC: Key Strategic Developments, 2017-2017
Table 108.Entelos, Inc.: Key Strategic Developments, 2017-2017
Table 109.Rhenovia Pharma Ltd.: Key Strategic Developments, 2017-2017
Table 110.Genedata AG: Key Strategic Developments, 2017-2017
List of Figures
Figure 1.Global Biosimulation Market Share, By Product, 2017 & 2025
Figure 2.Global Biosimulation Market, By Application, 2017 ($Million)
Figure 3.Global Biosimulation Market, By End User, 2017 ($Million)
Figure 4.Biosimulation Market, By Region, 2017 ($Million)
Figure 5.Certara USA, Inc.: Net Revenues, 2017-2017 ($Million)
Figure 6.Certara USA, Inc.: Net Revenue Share, By Segment, 2017
Figure 7.Certara USA, Inc.: Net Revenue Share, By Geography, 2017
Figure 8.Simulation Plus, Inc.: Net Revenues, 2017-2017 ($Million)
Figure 9.Simulation Plus, Inc.: Net Revenue Share, By Segment, 2017
Figure 10.Simulation Plus, Inc.: Net Revenue Share, By Geography, 2017
Figure 11.Dassault Systems SA: Net Revenues, 2017-2017 ($Million)
Figure 12.Dassault Systems SA: Net Revenue Share, By Segment, 2017
Figure 13.Dassault Systems SA: Net Revenue Share, By Geography, 2017
Figure 14.Schrodinger, Inc.: Net Revenues, 2017-2017 ($Million)
Figure 15.Schrodinger, Inc.: Net Revenue Share, By Segment, 2017
Figure 16.Schrodinger, Inc.: Net Revenue Share, By Geography, 2017
Figure 17.Advanced Chemistry Development, Inc.: Net Revenues, 2017-2017 ($Million)
Figure 18.Advanced Chemistry Development, Inc.: Net Revenue Share, By Segment, 2017
Figure 19.Advanced Chemistry Development, Inc.: Net Revenue Share, By Geography, 2017
Figure 20.Chemical Computing Group, Inc.: Net Revenues, 2017-2017 ($Million)
Figure 21.Chemical Computing Group, Inc.: Net Revenue Share, By Segment, 2017
Figure 22.Chemical Computing Group, Inc.: Net Revenue Share, By Geography, 2017
Figure 23.Physiomics PLC: Net Revenues, 2017-2017 ($Million)
Figure 24.Physiomics PLC: Net Revenue Share, By Segment, 2017
Figure 25.Physiomics PLC: Net Revenue Share, By Geography, 2017
Figure 26.Entelos, Inc.: Net Revenues, 2017-2017 ($Million)
Figure 27.Entelos, Inc.: Net Revenue Share, By Segment, 2017
Figure 28.Entelos, Inc.: Net Revenue Share, By Geography, 2017
Figure 29.Rhenovia Pharma Ltd.: Net Revenues, 2017-2017 ($Million)
Figure 30.Rhenovia Pharma Ltd.: Net Revenue Share, By Segment, 2017
Figure 31.Rhenovia Pharma Ltd.: Net Revenue Share, By Geography, 2017
Figure 32.Genedata AG: Net Revenues, 2017-2017 ($Million)
Figure 33.Genedata AG: Net Revenue Share, By Segment, 2017
Figure 34.Genedata AG: Net Revenue Share, By Geography, 2017
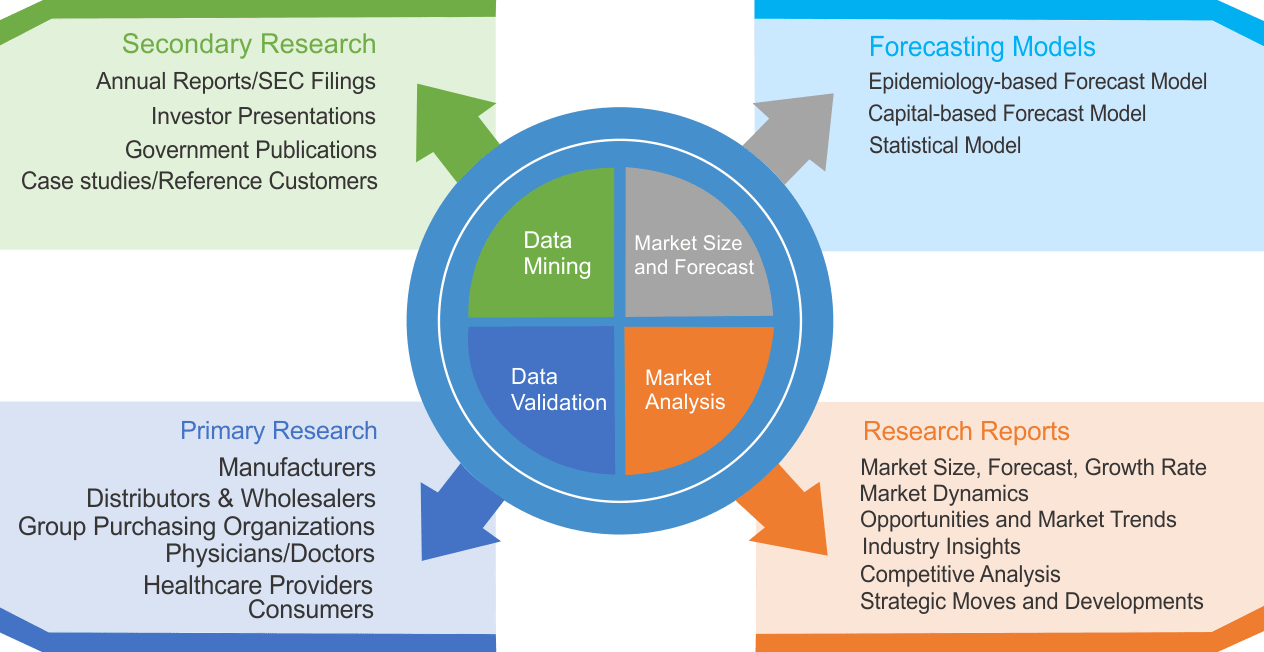
Research Methodology
We use both primary as well as secondary research for our market surveys, estimates and for developing forecast. Our research process commence by analyzing the problem which enable us to design the scope for our research study. Our research process is uniquely designed with enough flexibility to adjust according to changing nature of products and markets, while retaining core element to ensure reliability and accuracy in research findings. We understand both macro and micro-economic factors to evaluate and forecast different market segments.
Data Mining
Data is extensively collected through various secondary sources such as annual reports, investor presentations, SEC filings, and other corporate publications. We also refer trade magazines, technical journals, paid databases such as Factiva and Bloomberg, industry trade journals, scientific journals, and social media data to understand market dynamics and industry trends. Further, we also conduct primary research to understand market drivers, restraints, opportunities, challenges, and competitive scenario to build our analysis.
Data Collection Matrix
|
Data Collection Matrix |
Supply Side |
Demand Side |
|
Primary Data Sources |
|
|
|
Secondary Data Sources |
|
|
Market Modeling and Forecasting
We use epidemiology and capital equipment-based models to forecast market size of different segments at country and regional level.
- Epidemiology-based Forecasting Model: This method uses epidemiology data gathered through various publications and from physicians to estimate population of patients, flow of treatment of individual disease and therapies. The data collected through this method includes statics on incidence of disease, population suffering from disease, and treatment population. This method is used to understand:
- Number of patients for particular device or medical procedure and
- Repeated use of particular device depending on health and condition of patient
- Capital-based Forecasting Model: This method of forecasting is based on number of replacements, installed-based and new sales of capital equipment used in various healthcare and diagnostic centers. These three parameters are calculated and forecast is developed. Installation base is calculated as average number of units per facility; while sales for particular year is calculated from number of new and replace units. Secondary data is collected through various supply chain intermediaries and opinion leaders to arrive at installation and sales rate. These techniques help our analysts in validating market and developed market estimates and forecast.
We do forecast on basis of several parameters such as market drivers, market opportunities, industry trends government regulations, raw materials supply and trade dynamics to ensure relevance of forecast with market scenario. With increasing need to granulized information, we used bottom-up methodology for forecasting where we evaluate each regional segment differently and combined all forecast to develop final market forecast.
Data Validation
We believe primary research is a very important tool in analyzing and forecasting different markets. In order to make sure accuracy of our findings, our team conducts primary interviews at every stage of research to gain deep insights into current business environment and future trends and key developments in market. This includes use of various methods such as telephonic interviews, focus groups, face to face interviews and questionnaires to validate our research from all aspects. We validate our data through primary research from key industry leaders such as CEO, product managers, marketing managers, suppliers, distributors, and consumers are frequently interviewed. These interviews provide valuable insights which help us to have better market understanding besides validating our estimates and forecast.
Data Triangulation
Industry Analysis
|
Qualitative Data |
Quantitative Data (2017-2025) |
|
|