Bearings Market by Product and Application - Global Industry Analysis and Forecast to 2022
Published On : October 2017 Pages : 150 Category: Equipment Machine & Tooling Report Code : ME10285
Industry Trend Analysis
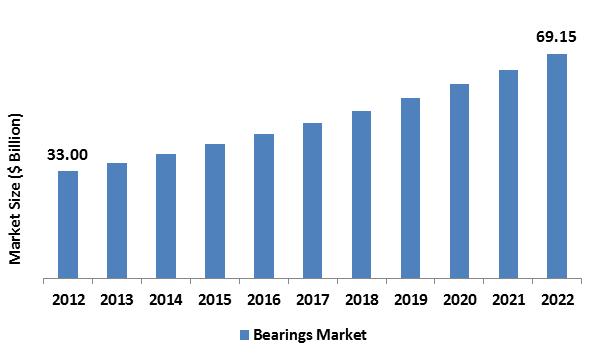
In 2017, the global bearings market was valued around USD 33.00 billion and is anticipated to reach approximately USD 69.15 billion while maintaining a compound annual growth rate (CAGR) of 6.89% during the forecast period owing to the growing manufacturing of heavy machinery. Moreover, the rising use of high capacity bearings in the manufacturing of wind turbines is expected to boost demand during the forecast years. Wind turbines use these products to improve turbine performance & reliability, reduce consumption of lubricant, and boost the production of energy. Technological innovations in seal technologies, lubrication technology, and the utilization of materials which are light in weight for producing high-performance products, are generating massive opportunities for players in the global market. Incorporation of electro-mechanical features into the bearings assists in reductions in cost and size and performance enhancement. The rise in the high-performance bearings demand has directed manufacturers to incorporate superior sensor units in the products. It helps in the digital supervising of rotation speed, deceleration, acceleration, load carrying capacity, and axial movement of the bearings.
Product Outlook and Trend Analysis
Bearings are widely segmented as roller and ball types. Ball bearings have lesser surface contacts, hence operate effortlessly, thus cutting down the friction. Ball bearings may also be employed with radial and thrust loadings, due to which, they are widely utilized in both four and two-wheeled vehicles. In the year 2017, ball bearings ruled the product section; though the roller type is anticipated to appear as the leading segment during the forecast years, as these products sustain axial and radial loads, cut down rotational friction, and as compared to ball bearings, they can support limited axial loads and heavy radial loads. The wide implementation of roller bearings by several industries, counting automobiles, home appliances, the aerospace, and capital equipment industry, is anticipated to impact the demand for product positively.
Application Outlook and Trend Analysis
In 2017, the automotive section ruled the global market. The expansion in the automotive production, around the world, is expected to drive their demand. The increasing demand for technologically advanced solutions integrated vehicles is resulting in a boost in vehicle production that demands instrumented products. Though, the aerospace & railway section is expected to be responsible for the fastest growing market, due to the attributed rise in a number of commuters traveling through public transportation. The accessibility of enhanced ways to aid local and worldwide transportation systems also presents market growth opportunities. Also, the demand in the railway sector is rising owing to the rapid construction of the railway in the developing nations.
Regional Outlook and Trend Analysis
Asia Pacific regional market is estimated to experience the fastest growth in sales by the end of 2022. China is among the key markets for sales of bearings in this region. The growth of the region is anticipated to rise during the approaching years; the growth is encouraged by the rapid growth of motor vehicle and machinery production, along with a robust aftermarket for motor vehicle repair and industrial equipment. Furthermore, the strong construction and mining equipment industry in India is expected to assist the growth of the global market. In the developed markets of Japan, Western Europe, and the United States, the demand is propelled by a strong rigid investment environment and the rebounding manufacturing of motor vehicles. In the African and Middle Eastern regions, the speedy expansion of urban infrastructures is regulating the global market growth.
Competitive Outlook and Trend Analysis
The major market players in the global bearings market include Schaeffler Group, NTN Corporation, SKF Group, NSK Global, JTEKT Corporation, and Timken. The market players are increasingly concentrating on research and development projects to produce application precise bearings and enhance their efficiency. Extreme competition has directed producers to spend more for product improvement to fulfill requirements of customers efficiently. For example, NTN Corporation has formulated high-speed deep groove ball bearing that is a grease lubrication type with superior rotational speed.
The global bearings market is segmented as follows :
By Product
- Ball Bearings
- Deep Groove bearings
- Others
- Roller Bearings
- Split bearings
- Tapered bearings
- Others
- Others
By Application
- Automotive
- Agriculture
- Electrical
- Mining & construction
- Railway & Aerospace
- Automotive Aftermarket
- Others
By Region
- North America
- U.S
- Canada
- Mexico
- Europe
- Germany
- France
- UK
- Italy
- Spain
- Rest of Europe
- Asia-Pacific
- Japan
- China
- Australia
- India
- South Korea
- Rest of Asia Pacific
- Rest of the World
- Brazil
- South Africa
- Saudi Arabia
- United Arab Emirates
- Others
Some of the key questions answered by the report are:
- What was the market size in 2017 and forecast from 2017 to 2022?
- What will be the industry market growth from 2017 to 2022?
- What are the major drivers, restraints, opportunities, challenges, and industry trends and their impact on the market forecast?
- What are the major segments leading the market growth and why?
- Which are the leading players in the market and what are the major strategies adopted by them to sustain the market competition?
Market Classification
- Bearings Market, By Product, Estimates and Forecast, 2012-2022 ($Million)
- Ball Bearings
- Deep Grove Bearings
- Others
- Roller Bearings
- Split Bearings
- Tapered Bearings
- Others
- Other Products
- Bearings Market, By Application, Estimates and Forecast, 2012-2022 ($Million)
- Automotive
- Agriculture
- Electrical
- Mining & construction
- Railway & Aerospace
- Automotive Aftermarket
- Other Application
- Bearings Market, By Region, Estimates and Forecast, 2012-2022 ($Million)
- North America
- North America Bearings Market, By Country
- North America Bearings Market, By Product
- North America Bearings Market, By Application
- U.S. Bearings Market, By Product
- U.S. Bearings Market, By Application
- Canada Bearings Market, By Product
- Canada Bearings Market, By Application
- Mexico Bearings Market, By Product
- Mexico Bearings Market, By Application
-
- Europe
- Europe Bearings Market, By Country
- Europe Bearings Market, By Product
- Europe Bearings Market, By Application
- Germany Bearings Market, By Product
- Germany Bearings Market, By Application
- France Bearings Market, By Product
- France Bearings Market, By Application
- UK Bearings Market, By Product
- UK Bearings Market, By Application
- Italy Bearings Market, By Product
- Italy Bearings Market, By Application
- Spain Bearings Market, By Product
- Spain Bearings Market, By Application
- Rest of Europe Bearings Market, By Product
- Rest of Europe Bearings Market, By Application
-
- Asia-Pacific
- Asia-Pacific Bearings Market, By Country
- Asia-Pacific Bearings Market, By Product
- Asia-Pacific Bearings Market, By Application
- Japan Bearings Market, By Product
- Japan Bearings Market, By Application
- Australia Bearings Market, By Product
- Australia Bearings Market, By Application
- India Bearings Market, By Product
- India Bearings Market, By Application
- South Korea Bearings Market, By Product
- South Korea Bearings Market, By Application
- Rest of Asia-Pacific Bearings Market, By Product
- Rest of Asia-Pacific Bearings Market, By Application
- Asia-Pacific
-
- Rest of the World
- Rest of the World Bearings Market, By Country
- Rest of the World Bearings Market, By Product
- Rest of the World Bearings Market, By Application
- Brazil Bearings Market, By Product
- Brazil Bearings Market, By Application
- South Africa Bearings Market, By Product
- South Africa Bearings Market, By Application
- Saudi Arabia Bearings Market, By Product
- Saudi Arabia Bearings Market, By Application
- Turkey Bearings Market, By Product
- Turkey Bearings Market, By Application
- United Arab Emirates Bearings Market, By Product
- United Arab Emirates Bearings Market, By Application
- Others Bearings Market, By Product
- Others Bearings Market, By Application
- Rest of the World
Table of Contents
1. Introduction
1.1. Report Description
1.2. Research Methodology
2. Executive Summary
2.1. Key Highlights
3. Market Overview
3.1. Introduction
3.1.1. Market Definition
3.1.2. Market Segmentation
3.2. Market Dynamics
3.2.1. Drivers
3.2.1.1. Rising Application Of High Capacity Bearings In Wind Turbines
3.2.1.2. Growing Demand for Bearing in Energy-Efficient Vehicles
3.2.2. Restraints
3.2.2.1. High Cost Of Raw Materials
3.2.2.2. Counterfeit Products
3.2.3. Opportunities
3.2.3.1. Emerging Markets to Offer Lucrative Growth Opportunities
4. Bearings Market, By Product
4.1. Introduction
4.2. Bearings Market Assessment and Forecast, By Product, 2012-2022
4.3. Ball Bearings
4.3.1. Market Assessment and Forecast, By Type, 2012-2022 ($Million)
4.3.2. Market Assessment and Forecast, By Region, 2012-2022 ($Million)
4.3.3. Deep Grove Bearings
4.3.3.1. Market Assessment and Forecast, By Region, 2012-2022 ($Million)
4.3.4. Other Types
4.3.4.1. Market Assessment and Forecast, By Region, 2012-2022 ($Million)
4.4. Roller Bearings
4.4.1. Market Assessment and Forecast, By Type, 2012-2022 ($Million)
4.4.2. Market Assessment and Forecast, By Region, 2012-2022 ($Million)
4.4.3. Split Bearings
4.4.3.1. Market Assessment and Forecast, By Region, 2012-2022 ($Million)
4.4.4. Tapered Bearings
4.4.4.1. Market Assessment and Forecast, By Region, 2012-2022 ($Million)
4.4.5. Other Types
4.4.5.1. Market Assessment and Forecast, By Region, 2012-2022 ($Million)
4.5. Other Product Types
4.5.1. Market Assessment and Forecast, By Region, 2012-2022 ($Million)
5. Bearings Market, By Application
5.1. Introduction
5.2. The Bearings Market Assessment and Forecast, By Application, 2012-2022
5.3. Automotive
5.3.1. Market Assessment and Forecast, By Region, 2012-2022 ($Million)
5.4. Agriculture
5.4.1. Market Assessment and Forecast, By Region, 2012-2022 ($Million)
5.5. Electrical
5.5.1. Market Assessment and Forecast, By Region, 2012-2022 ($Million)
5.6. Mining and Construction
5.6.1. Market Assessment and Forecast, By Region, 2012-2022 ($Million)
5.7. Railway and Aerospace
5.7.1. Market Assessment and Forecast, By Region, 2012-2022 ($Million)
5.8. Automotive Aftermarket
5.8.1. Market Assessment and Forecast, By Region, 2012-2022 ($Million)
5.9. Other Application
5.9.1. Market Assessment and Forecast, By Region, 2012-2022 ($Million)
6. Bearings Market, By Region
6.1. Introduction
6.2. Bearings Market Assessment and Forecast, By Product, 2012-2022 ($Million)
6.3. Bearings Market Assessment and Forecast, By Application , 2012-2022 ($Million)
6.4. North America
6.4.1. Market Assessment and Forecast, By Country, 2012-2022 ($Million)
6.4.2. Market Assessment and Forecast, By Product, 2012-2022 ($Million)
6.4.3. Market Assessment and Forecast, By Application, 2012-2022 ($Million)
6.4.4. U.S.
6.4.4.1. Market Assessment and Forecast, By Product, 2012-2022 ($Million)
6.4.4.2. Market Assessment and Forecast, By Application, 2012-2022 ($Million)
6.4.5. Canada
6.4.5.1. Market Assessment and Forecast, By Product, 2012-2022 ($Million)
6.4.5.2. Market Assessment and Forecast, By Application, 2012-2022 ($Million)
6.4.6. Mexico
6.4.6.1. Market Assessment and Forecast, By Product, 2012-2022 ($Million)
6.4.6.2. Market Assessment and Forecast, By Application, 2012-2022 ($Million)
6.5. Europe
6.5.1. Market Assessment and Forecast, By Country, 2012-2022 ($Million)
6.5.2. Market Assessment and Forecast, By Product, 2012-2022 ($Million)
6.5.3. Market Assessment and Forecast, By Application, 2012-2022 ($Million)
6.5.4. Germany
6.5.4.1. Market Assessment and Forecast, By Product, 2012-2022 ($Million)
6.5.4.2. Market Assessment and Forecast, By Application, 2012-2022 ($Million)
6.5.5. France
6.5.5.1. Market Assessment and Forecast, By Product, 2012-2022 ($Million)
6.5.5.2. Market Assessment and Forecast, By Application, 2012-2022 ($Million)
6.5.6. UK
6.5.6.1. Market Assessment and Forecast, By Product, 2012-2022 ($Million)
6.5.6.2. Market Assessment and Forecast, By Application, 2012-2022 ($Million)
6.5.7. Italy
6.5.7.1. Market Assessment and Forecast, By Product, 2012-2022 ($Million)
6.5.7.2. Market Assessment and Forecast, By Application, 2012-2022 ($Million)
6.5.8. Spain
6.5.8.1. Market Assessment and Forecast, By Product, 2012-2022 ($Million)
6.5.8.2. Market Assessment and Forecast, By Application, 2012-2022 ($Million)
6.5.9. Rest of Europe
6.5.9.1. Market Assessment and Forecast, By Product, 2012-2022 ($Million)
6.5.9.2. Market Assessment and Forecast, By Application, 2012-2022 ($Million)
6.6. Asia-Pacific
6.6.1. Market Assessment and Forecast, By Country, 2012-2022 ($Million)
6.6.2. Market Assessment and Forecast, By Product, 2012-2022 ($Million)
6.6.3. Market Assessment and Forecast, By Application, 2012-2022 ($Million)
6.6.4. Japan
6.6.4.1. Market Assessment and Forecast, By Product, 2012-2022 ($Million)
6.6.4.2. Market Assessment and Forecast, By Application, 2012-2022 ($Million)
6.6.5. China
6.6.5.1. Market Assessment and Forecast, By Product, 2012-2022 ($Million)
6.6.5.2. Market Assessment and Forecast, By Application, 2012-2022 ($Million)
6.6.6. Australia
6.6.6.1. Market Assessment and Forecast, By Product, 2012-2022 ($Million)
6.6.6.2. Market Assessment and Forecast, By Application, 2012-2022 ($Million)
6.6.7. India
6.6.7.1. Market Assessment and Forecast, By Product, 2012-2022 ($Million)
6.6.7.2. Market Assessment and Forecast, By Application, 2012-2022 ($Million)
6.6.8. South Korea
6.6.8.1. Market Assessment and Forecast, By Product, 2012-2022 ($Million)
6.6.8.2. Market Assessment and Forecast, By Application, 2012-2022 ($Million)
6.6.9. Rest of Asia-Pacific
6.6.9.1. Market Assessment and Forecast, By Product, 2012-2022 ($Million)
6.6.9.2. Market Assessment and Forecast, By Application, 2012-2022 ($Million)
6.7. Rest of the World
6.7.1. Market Assessment and Forecast, By Country, 2012-2022 ($Million)
6.7.2. Market Assessment and Forecast, By Product, 2012-2022 ($Million)
6.7.3. Market Assessment and Forecast, By Application, 2012-2022 ($Million)
6.7.4. Brazil
6.7.4.1. Market Assessment and Forecast, By Product, 2012-2022 ($Million)
6.7.4.2. Market Assessment and Forecast, By Application, 2012-2022 ($Million)
6.7.5. Turkey
6.7.5.1. Market Assessment and Forecast, By Product, 2012-2022 ($Million)
6.7.5.2. Market Assessment and Forecast, By Application, 2012-2022 ($Million)
6.7.6. Saudi Arabia
6.7.6.1. Market Assessment and Forecast, By Product, 2012-2022 ($Million)
6.7.6.2. Market Assessment and Forecast, By Application, 2012-2022 ($Million)
6.7.7. South Africa
6.7.7.1. Market Assessment and Forecast, By Product, 2012-2022 ($Million)
6.7.7.2. Market Assessment and Forecast, By Application, 2012-2022 ($Million)
6.7.8. United Arab Emirates
6.7.8.1. Market Assessment and Forecast, By Product, 2012-2022 ($Million)
6.7.8.2. Market Assessment and Forecast, By Application, 2012-2022 ($Million)
6.7.9. Others
6.7.9.1. Market Assessment and Forecast, By Product, 2012-2022 ($Million)
6.7.9.2. Market Assessment and Forecast, By Application, 2012-2022 ($Million)
7. Company Profiles
7.1. Brammer PLC
7.1.1. Business Overview
7.1.2. Product Portfolio
7.1.3. Key Financials
7.1.4. Strategic Developments
7.2. Harbin Bearing Manufacturing Co.Ltd.
7.2.1. Business Overview
7.2.2. Product Portfolio
7.2.3. Key Financials
7.2.4. Strategic Developments
7.3. HKT Bearings Ltd.
7.3.1. Business Overview
7.3.2. Product Portfolio
7.3.3. Strategic Developments
7.4. JTEKT Corporation
7.4.1. Business Overview
7.4.2. Product Portfolio
7.4.3. Key Financials
7.4.4. Strategic Developments
7.5. NSK Global
7.5.1. Business Overview
7.5.2. Product Portfolio
7.5.3. Key Financials
7.5.4. Strategic Developments
7.6. NTN Corporation
7.6.1. Business Overview
7.6.2. Product Portfolio
7.6.3. Key Financials
7.6.4. Strategic Developments
7.7. RBC Bearings Inc.
7.7.1. Business Overview
7.7.2. Product Portfolio
7.7.3. Key Financials
7.7.4. Strategic Developments
7.8. Rexnord Corporation
7.8.1. Business Overview
7.8.2. Product Portfolio
7.8.3. Key Financials
7.8.4. Strategic Developments
7.9. RHP Bearings
7.9.1. Business Overview
7.9.2. Product Portfolio
7.9.3. Strategic Developments
7.10. Schaeffler Group
7.10.1. Business Overview
7.10.2. Product Portfolio
7.10.3. Key Financials
7.10.4. Strategic Developments
List of Tables
Table 1.Global Bearings Market, By Product, 2012-2022 ($Million)
Table 2.Ball Bearings Market, By Type, 2012-2022 ($Million)
Table 3.Ball Bearings Market, By Region, 2012-2022 ($Million)
Table 4.Deep Grove Bearings Market, By Region, 2012-2022 ($Million)
Table 5.Other Types Market, By Region, 2012-2022 ($Million)
Table 6.Roller Bearings Market, By Type, 2012-2022 ($Million)
Table 7.Roller Bearings Market, By Region, 2012-2022 ($Million)
Table 8.Split Bearings Market, By Region, 2012-2022 ($Million)
Table 9.Tapered Bearings Market, By Region, 2012-2022 ($Million)
Table 10.Other Types Market, By Region, 2012-2022 ($Million)
Table 11.Other Products Market, By Region, 2012-2022 ($Million)
Table 12.Ball Bearings Market, By Application, 2012-2022 ($Million)
Table 13.Automotive Market, By Region, 2012-2022 ($Million)
Table 14.Agriculture Market, By Region, 2012-2022 ($Million)
Table 15.Electrical Market, By Region, 2012-2022 ($Million)
Table 16.Mining and Construction Market, By Region, 2012-2022 ($Million)
Table 17.Railway and Aerospace Market, By Region, 2012-2022 ($Million)
Table 18.Automotive Aftermarket Market, By Region, 2012-2022 ($Million)
Table 19.Other Application Market, By Region, 2012-2022 ($Million)
Table 20.North America Bearings Market, By Country, 2012-2022 ($Million)
Table 21.North America Bearings Market, By Product, 2012-2022 ($Million)
Table 22.North America Bearings Market, By Application, 2012-2022 ($Million)
Table 23.U.S. Bearings Market, By Product, 2012-2022 ($Million)
Table 24.U.S. Bearings Market, By Application, 2012-2022 ($Million)
Table 25.Canada Bearings Market, By Product, 2012-2022 ($Million)
Table 26.Canada Bearings Market, By Application, 2012-2022 ($Million)
Table 27.Mexico Bearings Market, By Product, 2012-2022 ($Million)
Table 28.Mexico Bearings Market, By Application, 2012-2022 ($Million)
Table 29.Europe Bearings Market, By Country, 2012-2022 ($Million)
Table 30.Europe Bearings Market, By Product, 2012-2022 ($Million)
Table 31.Europe Bearings Market, By Application, 2012-2022 ($Million)
Table 32.Germany Bearings Market, By Product, 2012-2022 ($Million)
Table 33.Germany Bearings Market, By Application, 2012-2022 ($Million)
Table 34.France Bearings Market, By Product, 2012-2022 ($Million)
Table 35.France Bearings Market, By Application, 2012-2022 ($Million)
Table 36.UK Bearings Market, By Product, 2012-2022 ($Million)
Table 37.UK Bearings Market, By Application, 2012-2022 ($Million)
Table 38.Italy Bearings Market, By Product, 2012-2022 ($Million)
Table 39.Italy Bearings Market, By Application, 2012-2022 ($Million)
Table 40.Spain Bearings Market, By Product, 2012-2022 ($Million)
Table 41.Spain Bearings Market, By Application, 2012-2022 ($Million)
Table 42.Rest of Europe Bearings Market, By Product, 2012-2022 ($Million)
Table 43.Rest of Europe Bearings Market, By Application, 2012-2022 ($Million)
Table 44.Asia-Pacific Bearings Market, By Country, 2012-2022 ($Million)
Table 45.Asia-Pacific Bearings Market, By Product, 2012-2022 ($Million)
Table 46.Asia-Pacific Bearings Market, By Application, 2012-2022 ($Million)
Table 47.Japan Bearings Market, By Product, 2012-2022 ($Million)
Table 48.Japan Bearings Market, By Application, 2012-2022 ($Million)
Table 49.China Bearings Market, By Product, 2012-2022 ($Million)
Table 50.China Bearings Market, By Application, 2012-2022 ($Million)
Table 51.Australia Bearings Market, By Product, 2012-2022 ($Million)
Table 52.Australia Bearings Market, By Application, 2012-2022 ($Million)
Table 53.India Bearings Market, By Product, 2012-2022 ($Million)
Table 54.India Bearings Market, By Application, 2012-2022 ($Million)
Table 55.South Korea Bearings Market, By Product, 2012-2022 ($Million)
Table 56.South Korea Bearings Market, By Application, 2012-2022 ($Million)
Table 57.Rest of Asia-Pacific Bearings Market, By Product, 2012-2022 ($Million)
Table 58.Rest of Asia-Pacific Bearings Market, By Application, 2012-2022 ($Million)
Table 59.Rest of the World Bearings Market, By Country, 2012-2022 ($Million)
Table 60.Rest of the World Bearings Market, By Product, 2012-2022 ($Million)
Table 61.Rest of the World Bearings Market, By Application, 2012-2022 ($Million)
Table 62.Brazil Bearings Market, By Product, 2012-2022 ($Million)
Table 63.Brazil Bearings Market, By Application, 2012-2022 ($Million)
Table 64.Turkey Bearings Market, By Product, 2012-2022 ($Million)
Table 65.Turkey Bearings Market, By Application, 2012-2022 ($Million)
Table 66.Saudi Arabia Bearings Market, By Product, 2012-2022 ($Million)
Table 67.Saudi Arabia Bearings Market, By Application, 2012-2022 ($Million)
Table 68.South Africa Bearings Market, By Product, 2012-2022 ($Million)
Table 69.South Africa Bearings Market, By Application, 2012-2022 ($Million)
Table 70.United Arab Emirates Bearings Market, By Product, 2012-2022 ($Million)
Table 71.United Arab Emirates Bearings Market, By Application, 2012-2022 ($Million)
Table 72.Others Bearings Market, By Product, 2012-2022 ($Million)
Table 73.Others Bearings Market, By Application, 2012-2022 ($Million)
Table 74.Brammer PLC: Key Strategic Developments, 2017-2017
Table 75.Harbin Bearing Manufacturing Co., Ltd.: Key Strategic Developments, 2017-2017
Table 76.HKT Bearings Ltd.: Key Strategic Developments, 2017-2017
Table 77.JTEKT Corporation: Key Strategic Developments, 2017-2017
Table 78.NSK Global: Key Strategic Developments, 2017-2017
Table 79.NTN Corporation: Key Strategic Developments, 2017-2017
Table 80.RBC Bearings Inc.: Key Strategic Developments, 2017-2017
Table 81.Rexnord Corporation: Key Strategic Developments, 2017-2017
Table 82.RHP Bearings: Key Strategic Developments, 2017-2017
Table 83.Schaeffler Group: Key Strategic Developments, 2017-2017
List of Figures
Figure 1.Global Bearings Market Share, By Product, 2017 & 2025
Figure 2.Global Bearings Market, By Application, 2017, ($Million)
Figure 3.Global Bearings Market, By Region, 2017, ($Million)
Figure 4.Brammer PLC: Net Revenues, 2017-2017 ($Million)
Figure 5.Brammer PLC: Net Revenue Share, By Segment, 2017
Figure 6.Brammer PLC: Net Revenue Share, By Geography, 2017
Figure 7.JTEKT Corporation Net Revenues, 2017-2017 ($Million)
Figure 8.JTEKT Corporation: Net Revenue Share, By Segment, 2017
Figure 9.JTEKT Corporation Net Revenue Share, By Geography, 2017
Figure 10.NSK Global: Net Revenues, 2017-2017 ($Million)
Figure 11.NSK Global: Net Revenue Share, By Segment, 2017
Figure 12.NSK Global: Net Revenue Share, By Geography, 2017
Figure 13.NTN Corporation: Net Revenues, 2017-2017 ($Million)
Figure 14.NTN Corporation: Net Revenue Share, By Segment, 2017
Figure 15.NTN Corporation: Net Revenue Share, By Geography, 2017
Figure 16.RBC Bearings Inc.: Net Revenues, 2017-2017 ($Million)
Figure 17.RBC Bearings Inc.: Net Revenue Share, By Segment, 2017
Figure 18.RBC Bearings Inc.: Net Revenue Share, By Geography, 2017
Figure 19.Rexnord Corporation: Net Revenues, 2017-2017 ($Million)
Figure 20.Rexnord Corporation: Net Revenue Share, By Segment, 2017
Research Methodology
We use both primary as well as secondary research for our market surveys, estimates and for developing forecast. Our research process commence by analyzing the problem which enable us to design the scope for our research study. Our research process is uniquely designed with enough flexibility to adjust according to changing nature of products and markets, while retaining core element to ensure reliability and accuracy in research findings. We understand both macro and micro-economic factors to evaluate and forecast different market segments.
Data Mining
Data is extensively collected through various secondary sources such as annual reports, investor presentations, SEC filings, and other corporate publications. We also refer trade magazines, technical journals, paid databases such as Factiva and Bloomberg, industry trade journals, scientific journals, and social media data to understand market dynamics and industry trends. Further, we also conduct primary research to understand market drivers, restraints, opportunities, challenges, and competitive scenario to build our analysis.
Data Collection Matrix
|
Data Collection Matrix |
Supply Side |
Demand Side |
|
Primary Data Sources |
|
|
|
Secondary Data Sources |
|
|
Market Modeling and Forecasting
We use epidemiology and capital equipment-based models to forecast market size of different segments at country and regional level.
- Epidemiology-based Forecasting Model: This method uses epidemiology data gathered through various publications and from physicians to estimate population of patients, flow of treatment of individual disease and therapies. The data collected through this method includes statics on incidence of disease, population suffering from disease, and treatment population. This method is used to understand:
- Number of patients for particular device or medical procedure and
- Repeated use of particular device depending on health and condition of patient
- Capital-based Forecasting Model: This method of forecasting is based on number of replacements, installed-based and new sales of capital equipment used in various healthcare and diagnostic centers. These three parameters are calculated and forecast is developed. Installation base is calculated as average number of units per facility; while sales for particular year is calculated from number of new and replace units. Secondary data is collected through various supply chain intermediaries and opinion leaders to arrive at installation and sales rate. These techniques help our analysts in validating market and developed market estimates and forecast.
We do forecast on basis of several parameters such as market drivers, market opportunities, industry trends government regulations, raw materials supply and trade dynamics to ensure relevance of forecast with market scenario. With increasing need to granulized information, we used bottom-up methodology for forecasting where we evaluate each regional segment differently and combined all forecast to develop final market forecast.
Data Validation
We believe primary research is a very important tool in analyzing and forecasting different markets. In order to make sure accuracy of our findings, our team conducts primary interviews at every stage of research to gain deep insights into current business environment and future trends and key developments in market. This includes use of various methods such as telephonic interviews, focus groups, face to face interviews and questionnaires to validate our research from all aspects. We validate our data through primary research from key industry leaders such as CEO, product managers, marketing managers, suppliers, distributors, and consumers are frequently interviewed. These interviews provide valuable insights which help us to have better market understanding besides validating our estimates and forecast.
Data Triangulation

Industry Analysis
|
Qualitative Data |
Quantitative Data (2017-2025) |
|
|