Autoimmune Disease Diagnostics Market by Type - Global Industry Analysis and Forecast to 2022
Published On : October 2017 Pages : 120 Category: In-Vitro Diagnostics Report Code : HC10282
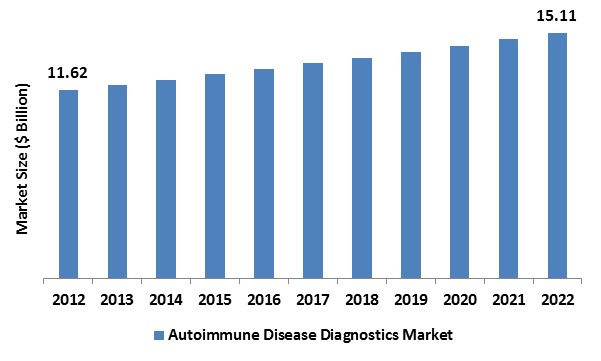
Industry Trend Analysis
In 2017, the global autoimmune disease diagnostics market was worth around USD 11.62 billion and is predicted to reach around USD 15.11 billion by 2022, with a compound annual growth rate (CAGR) of 2.39% during the projected period. Increasing occurrence of autoimmune diseases like type 1 diabetes in infants combined with the requirement for speedy diagnostics are the major factors driving the growth of the global market. Diagnostics and research institutes around the world are attempting initiatives in defiance with governmental organizations due to growing occurrence of autoimmune diseases and subsequent increase in overall healthcare expenditure. As per the data released by the National Institutes of Health (NIH), these diseases have been graded as among the leading ten disorders directing to escalating rate of mortality among females. Technological innovations and rising rates of lab automation are expected to boost the growth of the global market. Practitioners are implementing highly developed technology with the aim of conducting various tests at the same time with quicker and more specific outcome. Reduced turnaround linked with the application of traditional illness diagnostic techniques as well as the existence of the lesser amount of standardized tests for more than 80 types of diseases are few of the defects advocating laboratories to shift in the direction of automation. Furthermore, the existence of encouraging governmental initiatives is expected to boost industry dynamics positively. Organizations like the Cooperative Study Group for Autoimmune Disease Prevention, North American Rheumatoid Arthritis Consortium, and Autoimmunity Centers of Excellence are actively involved in giving educative knowledge to healthcare professionals and patients about proper treatment as well as diagnosis. Rising awareness among patients regarding these disorders is anticipated to boost the growth of the global market. In 2017, a study was undertaken by the American Autoimmune Related Diseases Association, Inc. (AARDA) which suggests that the capability of an Americans to identify an autoimmune disease has improved by 10%. This rise can be attributed to widespread public awareness campaigns conducted by the AARDA in March 2017, like the National Awareness Campaign and Autoimmune Awareness Month.
Type Outlook and Trend Analysis
On account of type, autoimmune diseases are categorized into systemic and localized diseases. In 2017, localized illness diagnostics ruled the global market concerning revenue. The existence of huge process volumes and higher awareness level among patients as compared to systemic are few of the factors reporting for its large market share. Conversely, systemic illness diagnostics are projected to experience top growth during the projected period owing to the adoption of encouraging government initiatives, particularly the AMP RA/SLE program for people having systemic lupus erythematosus and rheumatoid arthritis. This program is expected to render a development platform for innovative treatment and invention of publicly approachable disease-specific and precompetitive database for more research application.
Regional Outlook and Trend Analysis
In 2017, North America regional market held the leading market share of around 40.0%, mostly owing to the initiation of the existence of positive regulations & initiatives attempted by the AARDA, elevated disease occurrence in this region and Affordable Care Act. As per the AARDA, almost 50 million people in America have some form of autoimmune disorder. An elevated occurrence of these diseases together with medical spending has actuated the launching of supportive initiatives by the governmental authorities and other market-friendly organizations. These encouraging initiatives intend to reduce medical expenditure by diagnosing the illness at a much earlier stage and escalating awareness levels of patients. Asia Pacific regional market is anticipated to experience lucrative expansion owing to continuously amending medical infrastructure, rising awareness levels among patients, and the existence of high unfulfilled patient demands. It is anticipated to witness a rise in revenue share over the forecast years. Its industry share is expected to expand from 21.0% to 22.0% over the period of 2017 to 2027.
Competitive Outlook and Trend Analysis
The market is amalgamated in nature, hence is noted by the existence of wide mergers and acquisitions. Some major participants of the global autoimmune disease diagnostics market are; Siemens Healthineers, F. Hoffmann-La Roche Ltd, Beckman Coulter, Inc., Abbott Laboratories, Quest Diagnostics, SQI Diagnostics, AESKU.Diagnostics GmbH & Co. KG, EUROIMMUN AG, INOVA Diagnostics, Inc., bioMerieux SA, Crescendo Bioscience, Inc., Hemagen Diagnostics, Inc., and Bio-Rad Laboratories, Inc. Novel products development for rapid and efficient diagnosis is major strategy attempted by most of the key industry participants. For example, during 2017, Inova Diagnostics declared the sanction of its Scl-70 assays, Jo-1 range of assays, and QUANTA Flash dsDNA for the diagnosis of systemic sclerosis, polymyositis & dermatomyositis, and systemic lupus erythematosus respectively.
The global autoimmune disease diagnostics market is segmented as follows :
By Type
- Systemic Autoimmune Disease Diagnostics
- AnkylosingPondylitis
- Rheumatoid Arthritis
- Systemic Lupus Erythematosus (SLE)
- Other Systemic Autoimmune Disease Diagnostics
- Localized Autoimmune Disease Diagnostics
- Type 1 Diabetes
- Multiple Sclerosis
- Idiopathic Thrombocytopenic Purpura
- Hashimoto's Thyroiditis
- Other Localized Autoimmune Disease Diagnostics
By Region
- North America
- U.S
- Canada
- Mexico
- Europe
- Germany
- France
- UK
- Italy
- Spain
- Rest of Europe
- Asia-Pacific
- Japan
- China
- Australia
- India
- South Korea
- Rest of Asia-Pacific
- Rest of the World
- Brazil
- South Africa
- Saudi Arabia
- Turkey
- United Arab Emirates
- Others
Some of the key questions answered by the report are:
- What was the market size in 2017 and forecast from 2017 to 2022?
- What will be the industry market growth from 2017 to 2022?
- What are the major drivers, restraints, opportunities, challenges, and industry trends and their impact on the market forecast?
- What are the major segments leading the market growth and why?
- Which are the leading players in the market and what are the major strategies adopted by them to sustain the market competition?
Market Classification
- Autoimmune Disease Diagnostics Market, By Type, Estimates and Forecast, 2012-2022 ($Million)
- Systemic Autoimmune Disease Diagnostics
- Ankylosing Pondylitis
- Rheumatoid Arthritis
- Systemic Lupus Erythematosus (SLE)
- Other Systemic Autoimmune Disease Diagnostics
- Localized Autoimmune Disease Diagnostics
- Type 1 Diabetes
- Multiple Sclerosis
- Idiopathic Thrombocytopenic Purpura
- Hashimoto's Thyroiditis
- Other Localized Autoimmune Disease Diagnostics
- Autoimmune Disease Diagnostics Market, By Region, Estimates and Forecast, 2012-2022 ($Million)
- North America
- North America Autoimmune Disease Diagnostics Market, By Country
- North America Autoimmune Disease Diagnostics Market, By Type
- U.S. Autoimmune Disease Diagnostics Market, By Type
- Canada Autoimmune Disease Diagnostics Market, By Type
- Mexico Autoimmune Disease Diagnostics Market, By Type
-
- Europe
- Europe Autoimmune Disease Diagnostics Market, By Country
- Europe Autoimmune Disease Diagnostics Market, By Type
- Germany Autoimmune Disease Diagnostics Market, By Type
- France Autoimmune Disease Diagnostics Market, By Type
- UK Autoimmune Disease Diagnostics Market, By Type
- Italy Autoimmune Disease Diagnostics Market, By Type
- Spain Autoimmune Disease Diagnostics Market, By Type
- Rest of Europe Autoimmune Disease Diagnostics Market, By Type
-
- Asia-Pacific
- Asia-Pacific Autoimmune Disease Diagnostics Market, By Country
- Asia-Pacific Autoimmune Disease Diagnostics Market, By Type
- Japan Autoimmune Disease Diagnostics Market, By Type
- China Autoimmune Disease Diagnostics Market, By Type
- Australia Autoimmune Disease Diagnostics Market, By Type
- India Autoimmune Disease Diagnostics Market, By Type
- South Korea Autoimmune Disease Diagnostics Market, By Type
- Rest of Asia-Pacific Autoimmune Disease Diagnostics Market, By Type
- Asia-Pacific
-
- Rest of the World
- Rest of the World Autoimmune Disease Diagnostics Market, By Country
- Rest of the World Autoimmune Disease Diagnostics Market, By Type
- Brazil Autoimmune Disease Diagnostics Market, By Type
- South Africa Autoimmune Disease Diagnostics Market, By Type
- Saudi Arabia Autoimmune Disease Diagnostics Market, By Type
- Turkey Autoimmune Disease Diagnostics Market, By Type
- United Arab Emirates Autoimmune Disease Diagnostics Market, By Type
- Others Autoimmune Disease Diagnostics Market, By Type
- Rest of the World
Table of Contents
1. Introduction
1.1. Report Description
1.2. Research Methodology
1.2.1. Secondary Research
1.2.2. Primary Research
2. Executive Summary
2.1. Key Highlights
3. Market Overview
3.1. Introduction
3.1.1. Market Definition
3.1.2. Market Segmentation
3.2. Market Dynamics
3.2.1. Drivers
3.2.1.1. Increasing Patient Awareness
3.2.1.2. Favorable Government Initiatives
3.2.2. Restraints
3.2.2.1. Dearth of Skilled Professionals
3.2.3. Opportunities
4. Autoimmune Disease Diagnostics Market, By Type
4.1. Introduction
4.2. Autoimmune Disease Diagnostics Market Assessment and Forecast, By Type, 2012-2022
4.3. Systemic Autoimmune Disease Diagnostics
4.3.1. Market Assessment and Forecast, By Type, 2012-2022 ($Million)
4.3.2. Market Assessment and Forecast, By Region, 2012-2022 ($Million)
4.3.3. Ankylosing Pondylitis
4.3.3.1. Market Assessment and Forecast, By Region, 2012-2022 ($Million)
4.3.4. Rheumatoid Arthritis
4.3.4.1. Market Assessment and Forecast, By Region, 2012-2022 ($Million)
4.3.5. Systemic Lupus Erythematosus (SLE)
4.3.5.1. Market Assessment and Forecast, By Region, 2012-2022 ($Million)
4.3.6. Other Systemic Autoimmune Disease Diagnostics
4.3.6.1. Market Assessment and Forecast, By Region, 2012-2022 ($Million)
4.4. Localized Autoimmune Disease Diagnostics
4.4.1. Market Assessment and Forecast, By Type, 2012-2022 ($Million)
4.4.2. Market Assessment and Forecast, By Region, 2012-2022 ($Million)
4.4.3. Type 1 Diabetes
4.4.3.1. Market Assessment and Forecast, By Region, 2012-2022 ($Million)
4.4.4. Multiple Sclerosis
4.4.4.1. Market Assessment and Forecast, By Region, 2012-2022 ($Million)
4.4.5. Idiopathic Thrombocytopenic Purpura
4.4.5.1. Market Assessment and Forecast, By Region, 2012-2022 ($Million)
4.4.6. Hashimoto's Thyroiditis
4.4.6.1. Market Assessment and Forecast, By Region, 2012-2022 ($Million)
4.4.7. Other Localized Autoimmune Disease Diagnostics
4.4.7.1. Market Assessment and Forecast, By Region, 2012-2022 ($Million)
5. Autoimmune Disease Diagnostics Market, By Region
5.1. Introduction
5.2. Autoimmune Disease Diagnostics Market Assessment and Forecast, By Region, 2012-2022 ($Million)
5.3. North America
5.3.1. Market Assessment and Forecast, By Country, 2012-2022 ($Million)
5.3.2. Market Assessment and Forecast, By Type, 2012-2022 ($Million)
5.3.3. U.S.
5.3.3.1. Market Assessment and Forecast, By Type, 2012-2022 ($Million)
5.3.4. Canada
5.3.4.1. Market Assessment and Forecast, By Type, 2012-2022 ($Million)
5.3.5. Mexico
5.3.5.1. Market Assessment and Forecast, By Type, 2012-2022 ($Million)
5.4. Europe
5.4.1. Market Assessment and Forecast, By Country, 2012-2022 ($Million)
5.4.2. Market Assessment and Forecast, By Type, 2012-2022 ($Million)
5.4.3. Germany
5.4.3.1. Market Assessment and Forecast, By Type, 2012-2022 ($Million)
5.4.4. France
5.4.4.1. Market Assessment and Forecast, By Type, 2012-2022 ($Million)
5.4.5. UK
5.4.5.1. Market Assessment and Forecast, By Type, 2012-2022 ($Million)
5.4.6. Italy
5.4.6.1. Market Assessment and Forecast, By Type, 2012-2022 ($Million)
5.4.7. Spain
5.4.7.1. Market Assessment and Forecast, By Type, 2012-2022 ($Million)
5.4.8. Rest of Europe
5.4.8.1. Market Assessment and Forecast, By Type, 2012-2022 ($Million)
5.5. Asia-Pacific
5.5.1. Market Assessment and Forecast, By Country, 2012-2022 ($Million)
5.5.2. Market Assessment and Forecast, By Type, 2012-2022 ($Million)
5.5.3. Japan
5.5.3.1. Market Assessment and Forecast, By Type, 2012-2022 ($Million)
5.5.4. China
5.5.4.1. Market Assessment and Forecast, By Type, 2012-2022 ($Million)
5.5.5. Australia
5.5.5.1. Market Assessment and Forecast, By Type, 2012-2022 ($Million)
5.5.6. India
5.5.6.1. Market Assessment and Forecast, By Type, 2012-2022 ($Million)
5.5.7. South Korea
5.5.7.1. Market Assessment and Forecast, By Type, 2012-2022 ($Million)
5.5.8. Rest of Asia-Pacific
5.5.8.1. Market Assessment and Forecast, By Type, 2012-2022 ($Million)
5.6. Rest of the World
5.6.1. Market Assessment and Forecast, By Country, 2012-2022 ($Million)
5.6.2. Market Assessment and Forecast, By Type, 2012-2022 ($Million)
5.6.3. Brazil
5.6.3.1. Market Assessment and Forecast, By Type, 2012-2022 ($Million)
5.6.4. Turkey
5.6.4.1. Market Assessment and Forecast, By Type, 2012-2022 ($Million)
5.6.5. Saudi Arabia
5.6.5.1. Market Assessment and Forecast, By Type, 2012-2022 ($Million)
5.6.6. South Africa
5.6.6.1. Market Assessment and Forecast, By Type, 2012-2022 ($Million)
5.6.7. United Arab Emirates
5.6.7.1. Market Assessment and Forecast, By Type, 2012-2022 ($Million)
5.6.8. Others
5.6.8.1. Market Assessment and Forecast, By Type, 2012-2022 ($Million)
6. Company Profiles
6.1. Abbott Laboratories Inc.
6.1.1. Business Overview
6.1.2. Product Portfolio
6.1.3. Key Financials
6.1.4. Strategic Developments
6.2. Siemens AG
6.2.1. Business Overview
6.2.2. Product Portfolio
6.2.3. Key Financials
6.2.4. Strategic Developments
6.3. Beckman Coulter, Inc. (a part of Danaher Corporation)
6.3.1. Business Overview
6.3.2. Product Portfolio
6.3.3. Key Financials
6.3.4. Strategic Developments
6.4. F. Hoffmann-La Roche Ltd
6.4.1. Business Overview
6.4.2. Product Portfolio
6.4.3. Key Financials
6.4.4. Strategic Developments
6.5. SQI Diagnostics Inc.
6.5.1. Business Overview
6.5.2. Product Portfolio
6.5.3. Key Financials
6.5.4. Strategic Developments
6.6. EUROIMMUN Medizinische Labordiagnostika AG
6.6.1. Business Overview
6.6.2. Product Portfolio
6.6.3. Key Financials
6.6.4. Strategic Developments
6.7. Inova Diagnostics, Inc. – (a part of Werfen Life Group)
6.7.1. Business Overview
6.7.2. Product Portfolio
6.7.3. Key Financials
6.7.4. Strategic Developments
6.8. AESKU.GROUP GmbH & Co. KG
6.8.1. Business Overview
6.8.2. Product Portfolio
6.8.3. Strategic Developments
6.9. Crescendo Bioscience, Inc. (acquired by Myriad Genetics, Inc.)
6.9.1. Business Overview
6.9.2. Product Portfolio
6.9.3. Key Financials
6.9.4. Strategic Developments
6.10. Bio-Rad Laboratories, Inc.
6.10.1. Business Overview
6.10.2. Product Portfolio
6.10.3. Key Financials
6.10.4. Strategic Developments
6.11. Hemagen Diagnostics, Inc.
6.11.1. Business Overview
6.11.2. Product Portfolio
6.11.3. Strategic Developments
6.12. Quest Diagnostics Incorporated
6.12.1. Business Overview
6.12.2. Product Portfolio
6.12.3. Key Financials
6.12.4. Strategic Developments
List of Tables
Table 1.Global Autoimmune Disease Diagnostics Market, By Type ($Million), 2012-2022
Table 2.Systemic Autoimmune Disease Diagnostics Market, By Type ($Million), 2012-2022
Table 3.Systemic Autoimmune Disease Diagnostics Market, By Region ($Million), 2012-2022
Table 4.Ankylosing Pondylitis Market, By Region ($Million), 2012-2022
Table 5.Rheumatoid Arthritis Market, By Region ($Million), 2012-2022
Table 6.Systemic Lupus Erythematosus (SLE) Market, By Region ($Million), 2012-2022
Table 7.Other Systemic Autoimmune Disease Diagnostics Market, By Region ($Million), 2012-2022
Table 8.Localized Autoimmune Disease Diagnostics Market, By Type ($Million), 2012-2022
Table 9.Localized Autoimmune Disease Diagnostics Market, By Type ($Million), 2012-2022
Table 10.Type 1 Diabetes Market, By Region ($Million), 2012-2022
Table 11.Multiple Sclerosis Market, By Region ($Million), 2012-2022
Table 12.Idiopathic Thrombocytopenic Purpura Market, By Region ($Million), 2012-2022
Table 13.Hashimoto's Thyroiditis Market, By Region ($Million), 2012-2022
Table 14.Other Localized Autoimmune Disease Diagnostics Market, By Region ($Million), 2012-2022
Table 15.Autoimmune Disease Diagnostics Market, By Region ($Million), 2012-2022
Table 16.North America Autoimmune Disease Diagnostics Market, By Country, 2012-2022 ($Million)
Table 17.North America Autoimmune Disease Diagnostics Market, By Type, 2012-2022 ($Million)
Table 18.U.S. Autoimmune Disease Diagnostics Market, by Type, 2012-2022 ($Million)
Table 19.Canada Autoimmune Disease Diagnostics Market, By Type, 2012-2022 ($Million)
Table 20.Mexico Autoimmune Disease Diagnostics Market, By Type, 2012-2022 ($Million)
Table 21.Europe Autoimmune Disease Diagnostics Market, By Country, 2012-2022 ($Million)
Table 22.Europe Autoimmune Disease Diagnostics Market, By Type, 2012-2022 ($Million)
Table 26.Germany Autoimmune Disease Diagnostics Market, By Type, 2012-2022 ($Million)
Table 27.France Autoimmune Disease Diagnostics Market, By Type, 2012-2022 ($Million)
Table 28.UK Autoimmune Disease Diagnostics Market, By Type, 2012-2022 ($Million)
Table 29.Italy Autoimmune Disease Diagnostics Market, By Type, 2012-2022 ($Million)
Table 30.Spain Autoimmune Disease Diagnostics Market, By Type, 2012-2022 ($Million)
Table 31.Russia Autoimmune Disease Diagnostics Market, By Type, 2012-2022 ($Million)
Table 32.Rest of Europe Autoimmune Disease Diagnostics Market, By Type, 2012-2022 ($Million)
Table 33.Asia-Pacific Autoimmune Disease Diagnostics Market, By Country, 2012-2022 ($Million)
Table 34.Asia-Pacific Autoimmune Disease Diagnostics Market, By Type, 2012-2022 ($Million)
Table 35.Japan Autoimmune Disease Diagnostics Market, By Type, 2012-2022 ($Million)
Table 36.China Autoimmune Disease Diagnostics Market, By Type, 2012-2022 ($Million)
Table 37.Australia Autoimmune Disease Diagnostics Market, By Type, 2012-2022 ($Million)
Table 38.India Autoimmune Disease Diagnostics Market, By Type, 2012-2022 ($Million)
Table 39.South Korea Autoimmune Disease Diagnostics Market, By Type, 2012-2022 ($Million)
Table 40.Taiwan Autoimmune Disease Diagnostics Market, By Type, 2012-2022 ($Million)
Table 41.Rest of Asia-Pacific Autoimmune Disease Diagnostics Market, By Type, 2012-2022 ($Million)
Table 42.Rest of the World Autoimmune Disease Diagnostics Market, By Country, 2012-2022 ($Million)
Table 43.Rest of the World Autoimmune Disease Diagnostics Market, By Type, 2012-2022 ($Million)
Table 44.Brazil Autoimmune Disease Diagnostics Market, By Type, 2012-2022 ($Million)
Table 45.Turkey Autoimmune Disease Diagnostics Market, By Type, 2012-2022 ($Million)
Table 46.Saudi Arabia Autoimmune Disease Diagnostics Market, By Type, 2012-2022 ($Million)
Table 47.South Africa Autoimmune Disease Diagnostics Market, By Type, 2012-2022 ($Million)
Table 48.United Arab Emirates Autoimmune Disease Diagnostics Market, By Type, 2012-2022 ($Million)
Table 49.Others Autoimmune Disease Diagnostics Market, By Type, 2012-2022 ($Million)
Table 50.Abbott Laboratories Inc.: Key Strategic Developments, 2017-2017
Table 51.Siemens AG: Key Strategic Developments, 2017-2017
Table 52.Beckman Coulter, Inc. (a part of Danaher Corporation): Key Strategic Developments, 2017-2017
Table 53.F. Hoffmann-La Roche Ltd: Key Strategic Developments, 2017-2017
Table 54.SQI Diagnostics Inc.: Key Strategic Developments, 2017-2017
Table 55.EUROIMMUN Medizinische Labordiagnostika AG: Key Strategic Developments, 2017-2017
Table 56.Inova Diagnostics, Inc.: Key Strategic Developments, 2017-2017
Table 57.AESKU.GROUP GmbH & Co. KG: Key Strategic Developments, 2017-2017
Table 58.Crescendo Bioscience, Inc.: Key Strategic Developments, 2017-2017
Table 59.Bio-Rad Laboratories, Inc.: Key Strategic Developments, 2017-2017
Table 60.Hemagen Diagnostics, Inc.: Key Strategic Developments, 2017-2017
Table 61.Quest Diagnostics Incorporated: Key Strategic Developments, 2017-2017
List of Figures
Figure 1.Global Autoimmune Disease Diagnostics Market Share, By Application, 2012 & 2022
Figure 2 Autoimmune Disease Diagnostics Market, By Region, 2012 & 2022, ($Million)
Figure 3.Abbott Laboratories Inc.: Net Revenues, 2017-2017 ($Million)
Figure 4.Abbott Laboratories Inc.: Net Revenue Share, By Segment, 2017
Figure 5.Abbott Laboratories Inc.: Net Revenue Share, By Geography, 2017
Figure 6.Siemens AG: Net Revenues, 2017-2017 ($Million)
Figure7.Siemens AG: Net Revenue Share, By Segment, 2017
Figure8.Siemens AG: Net Revenue Share, By Geography, 2017
Figure9. Beckman Coulter, Inc.: Net Revenues, 2017-2017 ($Million)
Figure10. Beckman Coulter, Inc.: Net Revenue Share, By Segment, 2017
Figure 11.Beckman Coulter, Inc.: Net Revenue Share, By Geography, 2017
Figure12.F. Hoffmann-La Roche Ltd: Net Revenues, 2017-2017 ($Million)
Figure 13.F. Hoffmann-La Roche Ltd: Net Revenue Share, By Segment, 2017
Figure 14.F. Hoffmann-La Roche Ltd: Net Revenue Share, By Geography, 2017
Figure 18.SQI Diagnostics Inc.: Net Revenues, 2017-2017 ($Million)
Figure 19.SQI Diagnostics Inc.: Net Revenue Share, By Segment, 2017
Figure 21.SQI Diagnostics Inc.: Net Revenue Share, By Geography, 2017
Figure 22.EUROIMMUN Medizinische Labordiagnostika AG.: Net Revenues, 2017-2017 ($Million)
Figure 23.EUROIMMUN Medizinische Labordiagnostika AG.: Net Revenue Share, By Segment, 2017
Figure 24.EUROIMMUN Medizinische Labordiagnostika AG.: Net Revenue Share, By Geography, 2017
Figure 25.Inova Diagnostics, Inc. (a part of Werfen Life Group): Net Revenues, 2017-2017 ($Million)
Figure 26.Inova Diagnostics, Inc. (a part of Werfen Life Group): Net Revenue Share, By Segment, 2017
Figure 27.Inova Diagnostics, Inc. (a part of Werfen Life Group): Net Revenue Share, By Geography, 2017
Figure 28.Crescendo Bioscience, Inc. (acquired by Myriad Genetics, Inc.): Net Revenues, 2017-2017 ($Million)
Figure 29.Crescendo Bioscience, Inc. (acquired by Myriad Genetics, Inc.): Net Revenue Share, By Segment, 2017
Figure 30.Crescendo Bioscience, Inc. (acquired by Myriad Genetics, Inc.): Net Revenue Share, By Geography, 2017
Figure 31.Bio-Rad Laboratories, Inc.: Net Revenues, 2017-2017 ($Million)
Figure 32.Bio-Rad Laboratories, Inc.: Net Revenue Share, By Segment, 2017
Figure 33.Bio-Rad Laboratories, Inc.: Net Revenue Share, By Geography, 2017
Figure 34.Quest Diagnostics Incorporated: Net Revenues, 2017-2017 ($Million)
Figure 35.Quest Diagnostics Incorporated: Net Revenue Share, By Segment, 2017
Figure 36.Quest Diagnostics Incorporated: Net Revenue Share, By Geography, 2017
Research Methodology
We use both primary as well as secondary research for our market surveys, estimates and for developing forecast. Our research process commence by analyzing the problem which enable us to design the scope for our research study. Our research process is uniquely designed with enough flexibility to adjust according to changing nature of products and markets, while retaining core element to ensure reliability and accuracy in research findings. We understand both macro and micro-economic factors to evaluate and forecast different market segments.
Data Mining
Data is extensively collected through various secondary sources such as annual reports, investor presentations, SEC filings, and other corporate publications. We also refer trade magazines, technical journals, paid databases such as Factiva and Bloomberg, industry trade journals, scientific journals, and social media data to understand market dynamics and industry trends. Further, we also conduct primary research to understand market drivers, restraints, opportunities, challenges, and competitive scenario to build our analysis.
Data Collection Matrix
|
Data Collection Matrix |
Supply Side |
Demand Side |
|
Primary Data Sources |
|
|
|
Secondary Data Sources |
|
|
Market Modeling and Forecasting
We use epidemiology and capital equipment-based models to forecast market size of different segments at country and regional level.
- Epidemiology-based Forecasting Model: This method uses epidemiology data gathered through various publications and from physicians to estimate population of patients, flow of treatment of individual disease and therapies. The data collected through this method includes statics on incidence of disease, population suffering from disease, and treatment population. This method is used to understand:
- Number of patients for particular device or medical procedure and
- Repeated use of particular device depending on health and condition of patient
- Capital-based Forecasting Model: This method of forecasting is based on number of replacements, installed-based and new sales of capital equipment used in various healthcare and diagnostic centers. These three parameters are calculated and forecast is developed. Installation base is calculated as average number of units per facility; while sales for particular year is calculated from number of new and replace units. Secondary data is collected through various supply chain intermediaries and opinion leaders to arrive at installation and sales rate. These techniques help our analysts in validating market and developed market estimates and forecast.
We do forecast on basis of several parameters such as market drivers, market opportunities, industry trends government regulations, raw materials supply and trade dynamics to ensure relevance of forecast with market scenario. With increasing need to granulized information, we used bottom-up methodology for forecasting where we evaluate each regional segment differently and combined all forecast to develop final market forecast.
Data Validation
We believe primary research is a very important tool in analyzing and forecasting different markets. In order to make sure accuracy of our findings, our team conducts primary interviews at every stage of research to gain deep insights into current business environment and future trends and key developments in market. This includes use of various methods such as telephonic interviews, focus groups, face to face interviews and questionnaires to validate our research from all aspects. We validate our data through primary research from key industry leaders such as CEO, product managers, marketing managers, suppliers, distributors, and consumers are frequently interviewed. These interviews provide valuable insights which help us to have better market understanding besides validating our estimates and forecast.
Data Triangulation

Industry Analysis
|
Qualitative Data |
Quantitative Data (2017-2025) |
|
|