.png)
Animal Feed Organic Trace Minerals Market by Product and Application - Global Industry Analysis and Forecast to 2027
Published On : September 2017 Pages : 93 Category: Food and Beverages Report Code : FB09201
SEGMENTS & REGIONS:
- Regions: North America, Europe, Asia- Pacific, Latin America, Middle East & Africa
Industrial Outlook and Trend analysis
The global animal feed organic trace minerals market was worth USD million in the year 2017 and is predicted to reach approximately USD 869.55 million by 2027, while registering itself at a compound annual growth rate (CAGR) of % during the forecast period. Organic trace minerals also termed chelates are utilized in small amounts in animal feed. The animal feed industry that is witnessing substantial growth is said to be the key factor that influences the growth of the market during the forecast period. Growing consumption of meat is also a major factor behind the growth of the market as meat is known to be the highest source of proteins. A switch in the pattern of food consumption which includes proteins extracted from animals is playing a vital part in the increasing consumption of meat across the globe. Factors as such are anticipated to influence the growth of the organic trace minerals significantly. The United States was the second largest market in the year 2017 after China. Zinc was the leading product segment of the organic trace mineral in the country. The consumption of zinc is extremely beneficial for the animals as it enhances the immunity and the capacity of reproduction in animals. Owing to such factors the demand in the United States market has increased. The United States had the largest consumption of poultry and pork in the year 2017. The country widely contributed towards the growth of the feed industry that led to increasing requirement of the organic trace minerals.
Product Outlook and Trend Analysis
Certain minerals that are extremely important in the animal feed are manganese, iron, cobalt, copper and zinc. The primary function of these organic trace minerals is to enhance the quality of the feed, even though they are utilized in very small amounts. These functions have increased the value of utilization of these minerals which boosts the growth of the market significantly. Zinc assists in enhancing the immunity and metabolism in animals. Zinc registered as the major share of 34.1 percent in the year 2017 in the United States market of animal feed organic trace minerals which increased its demand in the industry. However, this mineral can be harmful if consumed in excess that propels regulations to make sure the mineral is being utilized in limit. The iron market is anticipated to grow significantly in the coming years as it assists in storing oxygen into the tissues and muscles of animals as well as transport oxygen in the blood. The excellent benefits provided by iron are anticipated to spur the growth of the market.
Application Outlook and Trend Analysis
Organic trace minerals are useful in feeds of pigs, horses, dairy cattle and poultry. Poultry dominated the application segment in 2017 which registered 42.8 percent of the total share of the market. The increasing consumption of eggs, broilers and turkeys is anticipated to have a positive influence of the demand of poultry in the coming years. In the year 2017, poultry was said to be the most consumed meat. Pork had the second largest share that accounted 28.3 percent of total market in the year 2017. As pork is said to be a high source of protein the increasing requirement of proteins derived from animals is said to be the major factor to boost the market. The disruption of disease in this field is common, which has led to manufacturers and processors of pork being aware of the importance of quality meat which is further anticipated to increase the requirement of organic trace minerals.
Regional Outlook and Trend Analysis
In the year 2017 the organic trace minerals market was dominated by Asia Pacific. India and China had the largest share making the region the largest processor and consumer of feed. Europe had a share of 27.7 percent of the market in the year 2017. This region witnessed major growth due to increasing demand of animal feed from countries like France, Netherlands, Spain and Germany. Factors like suitable climatic conditions have assisted in the growth of poultry which has spurred the requirement for organic trace minerals. The North American market is anticipated to witness steady growth owing to increased consumption of turkey and pork. This region is said to have steady growth of the dairy cattle industry, thereby influencing the growth of the organic trace mineral market.
Competitive Insights
In the year 2017 Cargill Inc., had a turnover of USD billion. This made the company the largest player in the market of organic trace minerals in the year 2017. With the aim of increasing its share in the growing region of Asia Pacific, the company introduced an animal nutrition manufacturing plant in Vietnam which was valued USD million. Other key players in the market are Royal DSM NV, Alltech, Inc., Nutreco N.V. Expansions & investments and Archer Daniels Midland Co.
The Animal feed organic trace minerals market is segmented as follows-
By Product
- Selenium
- Iron
- Zinc
- Copper
- Others
By Application
- Horses
- Dairy Cattle
- Pigs
- Poultry
- Others
By Region
- North America
- U.S
- Canada
- Mexico
- Europe
- Germany
- France
- UK
- Italy
- Spain
- Rest of Europe
- Asia-Pacific
- Japan
- China
- Australia
- India
- South Korea
- Rest of Asia Pacific
- Rest of the World
- Brazil
- South Africa
- Saudi Arabia
- United Arab Emirates
- Others
Some of the key questions answered by the report are:
- What was the market size in 2017 and forecast from 2022 to 2027?
- What will be the industry market growth from 2022 to 2027?
- What are the major drivers, restraints, opportunities, challenges, and industry trends and their impact on the market forecast?
- What are the major segments leading the market growth and why?
- Which are the leading players in the market and what are the major strategies adopted by them to sustain the market competition?
Market Classification
- Animal Feed Organic Trace Minerals Market, By Product, Estimates and Forecast, 2017-2027 ($Million)
- Selenium
- Iron
- Zinc
- Copper
- Other Products
- Animal Feed Organic Trace Minerals Market, By Application, Estimates and Forecast, 2017-2027 ($Million)
- Horses
- Dairy Cattle
- Pigs
- Poultry
- Other Applications
- Animal Feed Organic Trace Minerals Market, By Region, Estimates and Forecast, 2017-2027 ($Million)
- North America
- North America Animal Feed Organic Trace Minerals Market, By Country
- North America Animal Feed Organic Trace Minerals Market, By Product
- North America Animal Feed Organic Trace Minerals Market, By Application
- U.S. Animal Feed Organic Trace Minerals Market, By Product
- U.S. Animal Feed Organic Trace Minerals Market, By Application
- Canada Animal Feed Organic Trace Minerals Market, By Product
- Canada Animal Feed Organic Trace Minerals Market, By Application
- Mexico Animal Feed Organic Trace Minerals Market, By Product
- Mexico Animal Feed Organic Trace Minerals Market, By Application
-
- Europe
- Europe Animal Feed Organic Trace Minerals Market, By Country
- Europe Animal Feed Organic Trace Minerals Market, By Product
- Europe Animal Feed Organic Trace Minerals Market, By Application
- Germany Animal Feed Organic Trace Minerals Market, By Product
- Germany Animal Feed Organic Trace Minerals Market, By Application
- France Animal Feed Organic Trace Minerals Market, By Product
- France Animal Feed Organic Trace Minerals Market, By Application
- UK Animal Feed Organic Trace Minerals Market, By Product
- UK Animal Feed Organic Trace Minerals Market, By Application
- Italy Animal Feed Organic Trace Minerals Market, By Product
- Italy Animal Feed Organic Trace Minerals Market, By Application
- Spain Animal Feed Organic Trace Minerals Market, By Product
- Spain Animal Feed Organic Trace Minerals Market, By Application
- Rest of Europe Animal Feed Organic Trace Minerals Market, By Product
- Rest of Europe Animal Feed Organic Trace Minerals Market, By Application
-
- Asia-Pacific
- Asia-Pacific Animal Feed Organic Trace Minerals Market, By Country
- Asia-Pacific Animal Feed Organic Trace Minerals Market, By Product
- Asia-Pacific Animal Feed Organic Trace Minerals Market, By Application
- Japan Animal Feed Organic Trace Minerals Market, By Product
- Japan Animal Feed Organic Trace Minerals Market, By Application
- Australia Animal Feed Organic Trace Minerals Market, By Product
- Australia Animal Feed Organic Trace Minerals Market, By Application
- India Animal Feed Organic Trace Minerals Market, By Product
- India Animal Feed Organic Trace Minerals Market, By Application
- South Korea Animal Feed Organic Trace Minerals Market, By Product
- South Korea Animal Feed Organic Trace Minerals Market, By Application
- Rest of Asia-Pacific Animal Feed Organic Trace Minerals Market, By Product
- Rest of Asia-Pacific Animal Feed Organic Trace Minerals Market, By Application
- Asia-Pacific
-
- Rest of the World
- Rest of the World Animal Feed Organic Trace Minerals Market, By Country
- Rest of the World Animal Feed Organic Trace Minerals Market, By Product
- Rest of the World Animal Feed Organic Trace Minerals Market, By Application
- Brazil Animal Feed Organic Trace Minerals Market, By Product
- Brazil Animal Feed Organic Trace Minerals Market, By Application
- South Africa Animal Feed Organic Trace Minerals Market, By Product
- South Africa Animal Feed Organic Trace Minerals Market, By Application
- Saudi Arabia Animal Feed Organic Trace Minerals Market, By Product
- Saudi Arabia Animal Feed Organic Trace Minerals Market, By Application
- Turkey Animal Feed Organic Trace Minerals Market, By Product
- Turkey Animal Feed Organic Trace Minerals Market, By Application
- United Arab Emirates Animal Feed Organic Trace Minerals Market, By Product
- United Arab Emirates Animal Feed Organic Trace Minerals Market, By Application
- Others Animal Feed Organic Trace Minerals Market, By Product
- Others Animal Feed Organic Trace Minerals Market, By Application
- Rest of the World
Table of Contents
1.Introduction
1.1.Report Description
1.2.Research Methodology
1.2.1. Secondary Research
1.2.2. Primary Research
2.Executive Summary
2.1.Key Highlights
3.Market Overview
3.1.Introduction
3.1.1. Market Definition
3.1.2. Market Segmentation
3.2.Market Share Analysis
3.3.Market Dynamics
3.3.1. Drivers
3.3.1.1.Growing animal feed industry
3.3.1.2.Increasing meat consumption
3.3.1.3.Advantages of organic trace minerals
3.3.2. Restraints
3.3.2.1.Growing occurrences of animal diseases
3.3.3. Opportunities
3.3.3.1.Increment in animal’s meat quality
3.4.Industry Trends
4.Animal Feed Organic Trace Minerals Market, By Product
4.1.Introduction
4.2.Animal Feed Organic Trace Minerals Market Assessment and Forecast, By Product, 2017-2027
4.3.Selenium
4.3.1. Market Assessment and Forecast, By Region, 2017-2027 ($Million)
4.4.Iron
4.4.1. Market Assessment and Forecast, By Region, 2017-2027 ($Million)
4.5.Zinc
4.5.1. Market Assessment and Forecast, By Region, 2017-2027 ($Million)
4.6.Copper
4.6.1. Market Assessment and Forecast, By Region, 2017-2027 ($Million)
4.7.Others
4.7.1. Market Assessment and Forecast, By Region, 2017-2027 ($Million)
5.Animal Feed Organic Trace Minerals Market, By Application
5.1.Introduction
5.2.Animal Feed Organic Trace Minerals Market Assessment and Forecast, By Application, 2017-2027
5.3.Horses
5.3.1.1.Market Assessment and Forecast, By Region, 2017-2027 ($Million)
5.4.Dairy Cattle
5.4.1.1.Market Assessment and Forecast, By Region, 2017-2027 ($Million)
5.5.Pigs
5.5.1.1.Market Assessment and Forecast, By Region, 2017-2027 ($Million)
5.6.Poultry
5.6.1.1.Market Assessment and Forecast, By Region, 2017-2027 ($Million)
5.7.Others
5.7.1.1.Market Assessment and Forecast, By Region, 2017-2027 ($Million)
6.Animal Feed Organic Trace Minerals Market, By Region
6.1.Introduction
6.2.Animal Feed Organic Trace Minerals Market Assessment and Forecast, By Region, 2017-2027 ($Million)
6.3.North America
6.3.1. Market Assessment and Forecast, By Country, 2017-2027 ($Million)
6.3.2. Market Assessment and Forecast, By Product, 2017-2027 ($Million)
6.3.3. Market Assessment and Forecast, By Application, 2017-2027 ($Million)
6.3.3.1.U.S.
6.3.3.1.1.Market Assessment and Forecast, By Product, 2017-2027 ($Million)
6.3.3.1.2.Market Assessment and Forecast, By Application, 2017-2027 ($Million)
6.3.3.1.3.
6.3.3.2.Canada
6.3.3.2.1.Market Assessment and Forecast, By Product, 2017-2027 ($Million)
6.3.3.2.2.Market Assessment and Forecast, By Application, 2017-2027 ($Million)
6.3.3.3.Mexico
6.3.3.3.1.Market Assessment and Forecast, By Product, 2017-2027 ($Million)
6.3.3.3.2.Market Assessment and Forecast, By Application, 2017-2027 ($Million)
6.4.Europe
6.4.1. Market Assessment and Forecast, By Country, 2017-2027 ($Million)
6.4.2. Market Assessment and Forecast, By Product, 2017-2027 ($Million)
6.4.3. Market Assessment and Forecast, By Application, 2017-2027 ($Million)
6.4.3.1.Germany
6.4.3.1.1.Market Assessment and Forecast, By Product, 2017-2027 ($Million)
6.4.3.1.2.Market Assessment and Forecast, By Application, 2017-2027 ($Million)
6.4.3.2.France
6.4.3.2.1.Market Assessment and Forecast, By Product, 2017-2027 ($Million)
6.4.3.2.2.Market Assessment and Forecast, By Product, 2017-2027 ($Million)
6.4.3.3.UK
6.4.3.3.1.Market Assessment and Forecast, By Product, 2017-2027 ($Million)
6.4.3.3.2.Market Assessment and Forecast, By Application, 2017-2027 ($Million)
6.4.3.4.Italy
6.4.3.4.1.Market Assessment and Forecast, By Product, 2017-2027 ($Million)
6.4.3.4.2.Market Assessment and Forecast, By Application, 2017-2027 ($Million)
6.4.3.5.Spain
6.4.3.5.1.Market Assessment and Forecast, By Product, 2017-2027 ($Million)
6.4.3.5.2.Market Assessment and Forecast, By Application, 2017-2027 ($Million)
6.4.3.6.Russia
6.4.3.6.1.Market Assessment and Forecast, By Product, 2017-2027 ($Million)
6.4.3.6.2.Market Assessment and Forecast, By Application, 2017-2027 ($Million)
6.4.3.7.Rest of Europe
6.4.3.7.1.Market Assessment and Forecast, By Product, 2017-2027 ($Million)
6.4.3.7.2.Market Assessment and Forecast, By Application, 2017-2027 ($Million)
6.5.Asia-Pacific
6.5.1. Market Assessment and Forecast, By Country, 2017-2027 ($Million)
6.5.2. Market Assessment and Forecast, By Product, 2017-2027 ($Million)
6.5.3. Market Assessment and Forecast, By Application, 2017-2027 ($Million)
6.5.3.1.Japan
6.5.3.1.1.Market Assessment and Forecast, By Product, 2017-2027 ($Million)
6.5.3.1.2.Market Assessment and Forecast, By Application, 2017-2027 ($Million)
6.5.3.2.China
6.5.3.2.1.Market Assessment and Forecast, By Product, 2017-2027 ($Million)
6.5.3.2.2.Market Assessment and Forecast, By Application, 2017-2027 ($Million)
6.5.3.3.Australia
6.5.3.3.1.Market Assessment and Forecast, By Product, 2017-2027 ($Million)
6.5.3.3.2.Market Assessment and Forecast, By Application, 2017-2027 ($Million)
6.5.3.4.India
6.5.3.4.1.Market Assessment and Forecast, By Product, 2017-2027 ($Million)
6.5.3.4.2.Market Assessment and Forecast, By Application, 2017-2027 ($Million)
6.5.3.5.South Korea
6.5.3.5.1.Market Assessment and Forecast, By Product, 2017-2027 ($Million)
6.5.3.5.2.Market Assessment and Forecast, By Application, 2017-2027 ($Million)
6.5.3.6.Taiwan
6.5.3.6.1.Market Assessment and Forecast, By Product, 2017-2027 ($Million)
6.5.3.6.2.Market Assessment and Forecast, By Application, 2017-2027 ($Million)
6.5.3.7.Rest of Asia-Pacific
6.5.3.7.1.Market Assessment and Forecast, By Product, 2017-2027 ($Million)
6.5.3.7.2.Market Assessment and Forecast, By Application, 2017-2027 ($Million)
6.6.Rest of the World
6.6.1. Market Assessment and Forecast, By Country, 2017-2027 ($Million)
6.6.2. Market Assessment and Forecast, By Product, 2017-2027 ($Million)
6.6.3. Market Assessment and Forecast, By Application, 2017-2027 ($Million)
6.6.3.1.Brazil
6.6.3.1.1.Market Assessment and Forecast, By Product, 2017-2027 ($Million)
6.6.3.1.2.Market Assessment and Forecast, By Application, 2017-2027 ($Million)
6.6.3.2.Turkey
6.6.3.2.1.Market Assessment and Forecast, By Product, 2017-2027 ($Million)
6.6.3.2.2.Market Assessment and Forecast, By Application, 2017-2027 ($Million)
6.6.3.3.Saudi Arabia
6.6.3.3.1.Market Assessment and Forecast, By Product, 2017-2027 ($Million)
6.6.3.3.2.Market Assessment and Forecast, By Application, 2017-2027 ($Million)
6.6.3.4.South Africa
6.6.3.4.1.Market Assessment and Forecast, By Product, 2017-2027 ($Million)
6.6.3.4.2.Market Assessment and Forecast, By Application, 2017-2027 ($Million)
6.6.3.5.United Arab Emirates
6.6.3.5.1.Market Assessment and Forecast, By Product, 2017-2027 ($Million)
6.6.3.5.2.Market Assessment and Forecast, By Application, 2017-2027 ($Million)
6.6.3.6.Others
6.6.3.6.1.Market Assessment and Forecast, By Product, 2017-2027 ($Million)
6.6.3.6.2.Market Assessment and Forecast, By Application, 2017-2027 ($Million)
7.Company Profiles
7.1.ALLTECH, INC.
7.1.1. Business Overview
7.1.2. Product Portfolio
7.1.3. Strategic Developments
7.2.Archer Daniels Midland Company
7.2.1. Business Overview
7.2.2. Product Portfolio
7.2.3. Key Financials
7.2.4. Strategic Developments
7.3.Biochem
7.3.1. Business Overview
7.3.2. Product Portfolio
7.3.3. Strategic Developments
7.4.Tanke International Group
7.4.1. Business Overview
7.4.2. Product Portfolio
7.4.3. Strategic Developments
7.5.Mercer Milling Co., Inc.
7.5.1. Business Overview
7.5.2. Strategic Developments
7.6.Kemin Industries, Inc.
7.6.1. Business Overview
7.6.2. Product Portfolio
7.6.3. Strategic Developments
7.7.Cargill, Inc.
7.7.1. Business Overview
7.7.2. Product Portfolio
7.7.3. Key Financials
7.7.4. Strategic Developments
7.8.Nutreco (wholly owned subsidiary of SHV Holdings N.V.)
7.8.1. Business Overview
7.8.2. Product Portfolio
7.8.3. Key Financials
7.8.4. Strategic Developments
7.9.Novus International Inc.
7.9.1. Business Overview
7.9.2. Product Portfolio
7.9.3. Key Financials
7.9.4. Strategic Developments
7.10.Pancosma S.A.
7.10.1.Business Overview
7.10.2.Product Portfolio
7.10.3.Strategic Developments
7.11.DSM
7.11.1.Business Overview
7.11.2.Product Portfolio
7.11.3.Key Financials
7.11.4.Strategic Developments
7.12.Zinpro Corp.
7.12.1.Business Overview
7.12.2.Product Portfolio
7.12.3.Strategic Developments
List of Tables
Table 1.Animal Feed Organic Trace Minerals Market, By Product ($Million), 2017-2025
Table 2.Selenium Market, By Region ($Million), 2017-2025
Table 3.Iron Market, By Region ($Million), 2017-2025
Table 4.Zinc Market, By Region ($Million), 2017-2025
Table 5.Copper Market, By Region ($Million), 2017-2025
Table 6.Others Market, By Region ($Million), 2017-2025
Table 7.Animal Feed Organic Trace Minerals Market, By Applications ($Million), 2017-2025
Table 8.Horses Market, By Region ($Million), 2017-2025
Table 9.Dairy Cattle Market, By Region ($Million), 2017-2025
Table 10.Pigs Market, By Region ($Million), 2017-2025
Table 11.Poultry Market, By Region ($Million), 2017-2025
Table 12.Others Market, By Region ($Million), 2017-2025
Table 13.Animal Feed Organic Trace Minerals Market, By Region ($Million), 2017-2025
Table 14.North America Animal Feed Organic Trace Minerals Market, By Country, 2017-2025 ($Million)
Table 15.North America Animal Feed Organic Trace Minerals Market, By Product, 2017-2025 ($Million)
Table 16.North America Animal Feed Organic Trace Minerals Market, By Application, 2017-2025 ($Million)
Table 17.U.S. Animal Feed Organic Trace Minerals Market, By Product, 2017-2025 ($Million)
Table 18.U.S. Animal Feed Organic Trace Minerals Market, By Application, 2017-2025 ($Million)
Table 19.Canada Animal Feed Organic Trace Minerals Market, By Product, 2017-2025 ($Million)
Table 20.Canada Animal Feed Organic Trace Minerals Market, By Application, 2017-2025 ($Million)
Table 21.Mexico Animal Feed Organic Trace Minerals Market, By Product, 2017-2025 ($Million)
Table 22.Mexico Animal Feed Organic Trace Minerals Market, By Application, 2017-2025 ($Million)
Table 23.Europe Animal Feed Organic Trace Minerals Market, By Country, 2017-2025 ($Million)
Table 24.Europe Animal Feed Organic Trace Minerals Market, By Product, 2017-2025 ($Million)
Table 25.Europe Animal Feed Organic Trace Minerals Market, By Application, 2017-2025 ($Million)
Table 26.Germany Animal Feed Organic Trace Minerals Market, By Product, 2017-2025 ($Million)
Table 27.Germany Animal Feed Organic Trace Minerals Market, By Application, 2017-2025 ($Million)
Table 28.France Animal Feed Organic Trace Minerals Market, By Product, 2017-2025 ($Million)
Table 29.France Animal Feed Organic Trace Minerals Market, By Application, 2017-2025 ($Million)
Table 30.UK Animal Feed Organic Trace Minerals Market, By Product, 2017-2025 ($Million)
Table 31.UK Animal Feed Organic Trace Minerals Market, By Application, 2017-2025 ($Million)
Table 32.Italy Animal Feed Organic Trace Minerals Market, By Product, 2017-2025 ($Million)
Table 33.Italy Animal Feed Organic Trace Minerals Market, By Application, 2017-2025 ($Million)
Table 34.Spain Animal Feed Organic Trace Minerals Market, By Product, 2017-2025 ($Million)
Table 35.Spain Animal Feed Organic Trace Minerals Market, By Application, 2017-2025 ($Million)
Table 36.Russia Animal Feed Organic Trace Minerals Market, By Product, 2017-2025 ($Million)
Table 37.Russia Animal Feed Organic Trace Minerals Market, By Application, 2017-2025 ($Million)
Table 38.Rest of Europe Animal Feed Organic Trace Minerals Market, By Product, 2017-2025 ($Million)
Table 39.Rest of Europe Animal Feed Organic Trace Minerals Market, By Application, 2017-2025 ($Million)
Table 40.Asia-Pacific Animal Feed Organic Trace Minerals Market, By Country, 2017-2025 ($Million)
Table 41.Asia-Pacific Animal Feed Organic Trace Minerals Market, By Product, 2017-2025 ($Million)
Table 42.Asia-Pacific Animal Feed Organic Trace Minerals Market, By Application, 2017-2025 ($Million)
Table 43.Japan Animal Feed Organic Trace Minerals Market, By Product, 2017-2025 ($Million)
Table 44.Japan Animal Feed Organic Trace Minerals Market, By Application, 2017-2025 ($Million)
Table 45.China Animal Feed Organic Trace Minerals Market, By Product, 2017-2025 ($Million)
Table 46.China Animal Feed Organic Trace Minerals Market, By Application, 2017-2025 ($Million)
Table 47.Australia Animal Feed Organic Trace Minerals Market, By Product, 2017-2025 ($Million)
Table 48.Australia Animal Feed Organic Trace Minerals Market, By Application, 2017-2025 ($Million)
Table 49.India Animal Feed Organic Trace Minerals Market, By Product, 2017-2025 ($Million)
Table 50.India Animal Feed Organic Trace Minerals Market, By Application, 2017-2025 ($Million)
Table 51.South Korea Animal Feed Organic Trace Minerals Market, By Product, 2017-2025 ($Million)
Table 52.South Korea Animal Feed Organic Trace Minerals Market, By Application, 2017-2025 ($Million)
Table 53.Taiwan Animal Feed Organic Trace Minerals Market, By Product, 2017-2025 ($Million)
Table 54.Taiwan Animal Feed Organic Trace Minerals Market, By Application, 2017-2025 ($Million)
Table 55.Rest of Asia-Pacific Animal Feed Organic Trace Minerals Market, By Product, 2017-2025 ($Million)
Table 56.Rest of Asia-Pacific Animal Feed Organic Trace Minerals Market, By Application, 2017-2025 ($Million)
Table 57.Rest of the World Animal Feed Organic Trace Minerals Market, By Country, 2017-2025 ($Million)
Table 58.Rest of the World Animal Feed Organic Trace Minerals Market, By Product, 2017-2025 ($Million)
Table 59.Rest of the World Animal Feed Organic Trace Minerals Market, By Application, 2017-2025 ($Million)
Table 60.Brazil Animal Feed Organic Trace Minerals Market, By Product, 2017-2025 ($Million)
Table 61.Brazil Animal Feed Organic Trace Minerals Market, By Application, 2017-2025 ($Million)
Table 62.Turkey Animal Feed Organic Trace Minerals Market, By Product, 2017-2025 ($Million)
Table 63.Turkey Animal Feed Organic Trace Minerals Market, By Application, 2017-2025 ($Million)
Table 64.Saudi Arabia Animal Feed Organic Trace Minerals Market, By Product, 2017-2025 ($Million)
Table 65.Saudi Arabia Animal Feed Organic Trace Minerals Market, By Application, 2017-2025 ($Million)
Table 66.South Africa Animal Feed Organic Trace Minerals Market, By Product, 2017-2025 ($Million)
Table 67.South Africa Animal Feed Organic Trace Minerals Market, By Application, 2017-2025 ($Million)
Table 68.United Arab Emirates Animal Feed Organic Trace Minerals Market, By Product, 2017-2025 ($Million)
Table 69.United Arab Emirates Animal Feed Organic Trace Minerals Market, By Application, 2017-2025 ($Million)
Table 70.Others Animal Feed Organic Trace Minerals Market, By Product, 2017-2025 ($Million)
Table 71.Others Animal Feed Organic Trace Minerals Market, By Application, 2017-2025 ($Million)
Table 72.ALLTECH, INC.: Key Strategic Developments, 2017-2017
Table 73.Archer Daniels Midland Company: Key Strategic Developments, 2017-2017
Table 74.Biochem: Key Strategic Developments, 2017-2017
Table 75.Tanke International Group: Key Strategic Developments, 2017-2017
Table 76 ercer Milling Co., Inc.: Key Strategic Developments, 2017-2017
Table 77.Kemin Industries, Inc.: Key Strategic Developments, 2017-2017
Table 78.Cargill, Inc.: Key Strategic Developments, 2017-2017
Table 79.Nutreco (wholly owned subsidiary of SHV Holdings N.V.): Key Strategic Developments, 2017-2017
Table 80.Novus International Inc.: Key Strategic Developments, 2017-2017
Table 81.Pancosma S.A.: Key Strategic Developments, 2017-2017
Table 82.DSM: Key Strategic Developments, 2017-2017
Table 83.Zinpro Corp.: Key Strategic Developments, 2017-2017
List of Figures
Figure 1.Animal Feed Organic Trace Minerals Market Share, By Product, 2017 & 2025 ($Million)
Figure 2.Animal Feed Organic Trace Minerals Market, By Application, 2017 & 2025 ($Million)
Figure 4.Animal Feed Organic Trace Minerals Market, By Region, 2017, ($Million)
Figure 5.Archer Daniels Midland Company: Net Revenues, 2017-2017 ($Million)
Figure 6.Archer Daniels Midland Company: Net Revenue Share, By Segment, 2017
Figure 7.Archer Daniels Midland Company: Net Revenue Share, By Geography, 2017
Figure 8.Cargill, Inc.: Net Revenues, 2017-2017 ($Million)
Figure 9.Cargill, Inc.: Net Revenue Share, By Segment, 2017
Figure 10.Cargill, Inc.: Net Revenue Share, By Geography, 2017
Figure 11.Nutreco (wholly owned subsidiary of SHV Holdings N.V.): Net Revenues, 2017-2017 ($Million)
Figure 12.Nutreco (wholly owned subsidiary of SHV Holdings N.V.): Net Revenue Share, By Segment, 2017
Figure 13.Nutreco (wholly owned subsidiary of SHV Holdings N.V.): Net Revenue Share, By Geography, 2017
Figure 14.Novus International Inc.: Net Revenues, 2017-2017 ($Million)
Figure 15.Novus International Inc.: Net Revenue Share, By Segment, 2017
Figure 16.Novus International Inc.: Net Revenue Share, By Geography, 2017
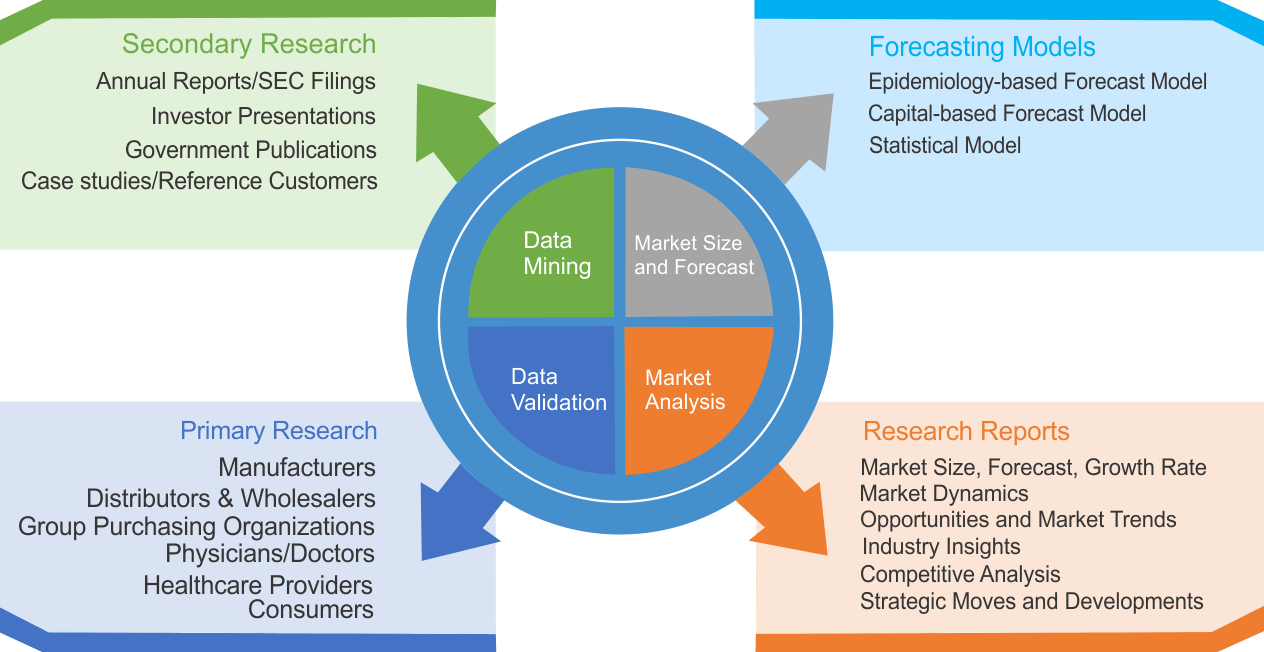
Research Methodology
We use both primary as well as secondary research for our market surveys, estimates and for developing forecast. Our research process commence by analyzing the problem which enable us to design the scope for our research study. Our research process is uniquely designed with enough flexibility to adjust according to changing nature of products and markets, while retaining core element to ensure reliability and accuracy in research findings. We understand both macro and micro-economic factors to evaluate and forecast different market segments.
Data Mining
Data is extensively collected through various secondary sources such as annual reports, investor presentations, SEC filings, and other corporate publications. We also refer trade magazines, technical journals, paid databases such as Factiva and Bloomberg, industry trade journals, scientific journals, and social media data to understand market dynamics and industry trends. Further, we also conduct primary research to understand market drivers, restraints, opportunities, challenges, and competitive scenario to build our analysis.
Data Collection Matrix
|
Data Collection Matrix |
Supply Side |
Demand Side |
|
Primary Data Sources |
|
|
|
Secondary Data Sources |
|
|
Market Modeling and Forecasting
We use epidemiology and capital equipment-based models to forecast market size of different segments at country and regional level.
- Epidemiology-based Forecasting Model: This method uses epidemiology data gathered through various publications and from physicians to estimate population of patients, flow of treatment of individual disease and therapies. The data collected through this method includes statics on incidence of disease, population suffering from disease, and treatment population. This method is used to understand:
- Number of patients for particular device or medical procedure and
- Repeated use of particular device depending on health and condition of patient
- Capital-based Forecasting Model: This method of forecasting is based on number of replacements, installed-based and new sales of capital equipment used in various healthcare and diagnostic centers. These three parameters are calculated and forecast is developed. Installation base is calculated as average number of units per facility; while sales for particular year is calculated from number of new and replace units. Secondary data is collected through various supply chain intermediaries and opinion leaders to arrive at installation and sales rate. These techniques help our analysts in validating market and developed market estimates and forecast.
We do forecast on basis of several parameters such as market drivers, market opportunities, industry trends government regulations, raw materials supply and trade dynamics to ensure relevance of forecast with market scenario. With increasing need to granulized information, we used bottom-up methodology for forecasting where we evaluate each regional segment differently and combined all forecast to develop final market forecast.
Data Validation
We believe primary research is a very important tool in analyzing and forecasting different markets. In order to make sure accuracy of our findings, our team conducts primary interviews at every stage of research to gain deep insights into current business environment and future trends and key developments in market. This includes use of various methods such as telephonic interviews, focus groups, face to face interviews and questionnaires to validate our research from all aspects. We validate our data through primary research from key industry leaders such as CEO, product managers, marketing managers, suppliers, distributors, and consumers are frequently interviewed. These interviews provide valuable insights which help us to have better market understanding besides validating our estimates and forecast.
Data Triangulation
Industry Analysis
|
Qualitative Data |
Quantitative Data (2017-2025) |
|
|