Polyurea Market by Product, Raw Material and Application - Global Industry Analysis and Forecast to 2022
Published On : September 2017 Pages : 135 Category: Plastics, Polymers & Resins Report Code : CM09233
Industry Outlook and Trend analysis
The global polyurea market was worth USD 0.87 billion in the year 2017 and is foreseen to garner roughly USD 1.40 billion by 2022, while registering itself at a compound annual growth rate (CAGR) of 5.39% during the forecast period. In 2017 the global polyurea market was sized 114.3 kilo tons. Polyurea is utilized in a number of applications that include transportation and construction due to its unusual features like high thermal stability, fast curing time, outstanding water insensitivity and pigment compatibility. This polymer is obtained from the reaction of synthetic resin blended polymers and isocyanate compounds via step-growth polymerization. The polymer is extensively utilized in the production of lining systems, sealants, coatings and adhesives. The rising utilization of protective coatings in the construction and automotive sector owing to high durability and rust prevention is anticipated to increase the utilization of polyurea. However, the availability of alternative coatings those are low-cost like polyurethane and epoxy may hamper the growth of the polyurea market. Polyurea is used in adhesives and sealants owing to its outstanding adhesion features on surfaces such as concrete, wood blasted steel and bitumen. Increasing utilization of sealants and adhesives as bonding substances in sectors like construction and automotive is anticipated to boost the growth of the market. Growing disbursement on the utilization of lining systems for the protection of the environment processes like landfill control, owing to strict regulations with the aim of reducing the harmful effects of pollution the demand of the polyurea is expected to boost.
Application Outlook and Trend Analysis
The largest application segment was construction in 2017 that accounted a share of more than 40 percent of the global volume. Polyurea renders high reactivity and moisture insensitivity that boosts its usage in applications like tank liners, secondary containment structures and manhole & tunnels. The requirement of polyurea in industrial applications in 2017 crossed 30 kilo tons. A switch in preference in the manufacturing industry from breakdown maintenance to condition-based monitoring is one of the factors to increase the usage of protective coatings, thereby boosting the growth of the polyurea market. Polyurea is extremely useful as sealing and coating materials in the marine, automotive and aerospace sectors. The transportation industry is anticipated to encounter significant growth in terms of volume.
Raw Material Outlook and Trend Analysis
A share of more than 65 percent of the global volume was accounted by aromatic compounds in 2017. They were widely utilized in variety of applications as they render outstanding physical properties and convenient process ability. Most of the companies in the market utilize aromatic compounds like aromatic amine, methylene diisocyanate (MDI) prepolymers and polyoxypropylene amines for the manufacturing of finished products as they are cost-effective. Aliphatic compounds are utilized due to their outstanding stability under ultraviolet light in comparison to aromatic compounds. However, aliphatic compounds are costly, thereby boosting the demand of aromatic compounds.
Product Outlook and Trend Analysis
The global market was dominated by coatings that registered for more than 65 percent of the global volume in 2017 and the trend is said to remain constant over the forecast period. Coatings are useful in healthcare, automotive and construction sectors as it provides properties like abrasion resistance, corrosion protection, structural enhancement and waterproofing. In 2017 the requirement for lining products that were polyurea-based was 23.2 kilo tons. They are widely utilized in landfills and waterproofing systems owing to their high resistance towards chemicals and quick drying finishes. Rising significance of waterproofing membranes in the construction sector owing to its sling properties is anticipated to have a positive influence on the growth of this market.
Regional Outlook and Trend Analysis
The regional market of North America registered for 39.8 percent of the total volume in 2017. Enhancement in the infrastructure in the United States owing to rising number of residential structures is anticipated to boost the utilization of the polymer as adhesives and coatings. Asia Pacific is anticipated to encounter significant growth owing to confident outlook towards the construction sector in countries like India and China on account of growing expenditure for urban development.
Competitive Insights
The major industries in the global Polyurea market are Nukote Coating Systems International, Specialty Products, Inc. (SPI), LineX Protective Coatings, BASF, SWD Polyurethane, PPG Industries and VersaFlex Inc. Nukote Coating Systems inaugurated manufacturing at its new facility based in Dammam, Saudi Arabia in May, 2017.
The global Polyurea market is segmented as follows-
By Product
- Coating
- Lining
- Sealants
By Raw Material
- Aliphatic
- Aromatic
By Application
- Industrial
- Building & Construction
- Landscape
- Transportation
- Other Applications
By Region
- North America
- U.S
- Canada
- Mexico
- Europe
- Germany
- France
- UK
- Italy
- Spain
- Rest of Europe
- Asia-Pacific
- Japan
- China
- Australia
- India
- South Korea
- Rest of Asia Pacific
- Rest of the World
- Brazil
- South Africa
- Saudi Arabia
- United Arab Emirates
- Others
Some of the key questions answered by the report are:
- What was the market size in 2017 and forecast from 2017 to 2022?
- What will be the industry market growth from 2017 to 2022?
- What are the major drivers, restraints, opportunities, challenges, and industry trends and their impact on the market forecast?
- What are the major segments leading the market growth and why?
- Which are the leading players in the market and what are the major strategies adopted by them to sustain the market competition?
Market Classification
- Polyurea Market, By Product, Estimates and Forecast, 2014-2022 ($Million)
- Coating
- Lining
- Sealants
- Polyurea Market, By Raw Material, Estimates and Forecast, 2014-2022 ($Million)
- Aliphatic
- Aromatic
- Polyurea Market, By Application, Estimates and Forecast, 2014-2022 ($Million)
- Industrial
- Building & Construction
- Landscape
- Transportation
- Other Applications
- Polyurea Market, By Region, Estimates and Forecast, 2014-2022 ($Million)
- North America
- North America Polyurea Market, By Country
- North America Polyurea Market, By Product
- North America Polyurea Market, By Raw Material
- North America Polyurea Market, By Application
- U.S. Polyurea Market, By Product
- U.S. Polyurea Market, By Raw Material
- U.S. Polyurea Market, By Application
- Canada Polyurea Market, By Product
- Canada Polyurea Market, By Raw Material
- Canada Polyurea Market, By Application
- Mexico Polyurea Market, By Product
- Mexico Polyurea Market, By Raw Material
- Mexico Polyurea Market, By Application
-
- Europe
- Europe Polyurea Market, By Country
- Europe Polyurea Market, By Product
- Europe Polyurea Market, By Raw Material
- Europe Polyurea Market, By Application
- Germany Polyurea Market, By Product
- Germany Polyurea Market, By Raw Material
- Germany Polyurea Market, By Application
- France Polyurea Market, By Product
- France Polyurea Market, By Raw Material
- France Polyurea Market, By Application
- UK Polyurea Market, By Product
- UK Polyurea Market, By Raw Material
- UK Polyurea Market, By Application
- Italy Polyurea Market, By Product
- Italy Polyurea Market, By Raw Material
- Italy Polyurea Market, By Application
- Spain Polyurea Market, By Product
- Spain Polyurea Market, By Raw Material
- Spain Polyurea Market, By Application
- Rest of Europe Polyurea Market, By Product
- Rest of Europe Polyurea Market, By Raw Material
- Rest of Europe Polyurea Market, By Application
-
- Asia-Pacific
- Asia-Pacific Polyurea Market, By Country
- Asia-Pacific Polyurea Market, By Product
- Asia-Pacific Polyurea Market, By Raw Material
- Asia-Pacific Polyurea Market, By Application
- Japan Polyurea Market, By Product
- Japan Polyurea Market, By Raw Material
- Japan Polyurea Market, By Application
- Australia Polyurea Market, By Product
- Australia Polyurea Market, By Raw Material
- Australia Polyurea Market, By Application
- India Polyurea Market, By Product
- India Polyurea Market, By Raw Material
- India Polyurea Market, By Application
- South Korea Polyurea Market, By Product
- South Korea Polyurea Market, By Raw Material
- South Korea Polyurea Market, By Application
- Rest of Asia-Pacific Polyurea Market, By Product
- Rest of Asia-Pacific Polyurea Market, By Raw Material
- Rest of Asia-Pacific Polyurea Market, By Application
- Asia-Pacific
-
- Rest of the World
- Rest of the World Polyurea Market, By Country
- Rest of the World Polyurea Market, By Product
- Rest of the World Polyurea Market, By Raw Material
- Rest of the World Polyurea Market, By Application
- Brazil Polyurea Market, By Product
- Brazil Polyurea Market, By Raw Material
- Brazil Polyurea Market, By Application
- South Africa Polyurea Market, By Product
- South Africa Polyurea Market, By Raw Material
- South Africa Polyurea Market, By Application
- Saudi Arabia Polyurea Market, By Product
- Saudi Arabia Polyurea Market, By Raw Material
- Saudi Arabia Polyurea Market, By Application
- Turkey Polyurea Market, By Product
- Turkey Polyurea Market, By Raw Material
- Turkey Polyurea Market, By Application
- United Arab Emirates Polyurea Market, By Product
- United Arab Emirates Polyurea Market, By Raw Material
- United Arab Emirates Polyurea Market, By Application
- Others Polyurea Market, By Product
- Others Polyurea Market, By Raw Material
- Others Polyurea Market, By Application
- Rest of the World
Table of Contents
1.Introduction
1.1.Report Description
1.2.Research Methodology
1.2.1. Secondary Research
1.2.2. Primary Research
2.Executive Summary
2.1.Key Highlights
3.Market Overview
3.1.Introduction
3.1.1. Market Definition
3.1.2. Market Segmentation
3.2.Market Share Analysis
3.3.Market Dynamics
3.3.1. Drivers
3.3.1.1.Rising paints & coatings industry
3.3.1.2.Increasing construction expenditure
3.3.1.3.Optimistic viewpoint towards adhesives & sealants market
3.3.2. Restraints
3.3.2.1.Threat of More availability of alternatives
3.3.3. Opportunities
3.3.3.1.Technological Advancement in Construction Industries
3.4.Industry Trends
4.Polyurea Market, By Product
4.1.Introduction
4.2.Polyurea Market Assessment and Forecast, By Product, 2017-2022
4.3.Coating
4.3.1. Market Assessment and Forecast, By Region, 2017-2022 ($Million)
4.4.Lining
4.4.1. Market Assessment and Forecast, By Region, 2017-2022 ($Million)
4.5.Sealants
4.5.1. Market Assessment and Forecast, By Region, 2017-2022 ($Million)
5.Polyurea Market, By Raw Material
5.1.Introduction
5.2.Polyurea Market Assessment and Forecast, By Raw Material, 2017-2022
5.3.Aliphatic
5.3.1.1.Market Assessment and Forecast, By Region, 2017-2022 ($Million)
5.4.Aromatic
5.4.1.1.Market Assessment and Forecast, By Region, 2017-2022 ($Million)
6.Polyurea Market, By Application
6.1.Introduction
6.2.Polyurea Market Assessment and Forecast, By Application, 2017-2022 ($Million)
6.3.Industrial
6.3.1.1.Market Assessment and Forecast, By Region, 2017-2022 ($Million)
6.4.Building & Construction
6.4.1.1.Market Assessment and Forecast, By Region, 2017-2022 ($Million)
6.5.Landscape
6.5.1.1.Market Assessment and Forecast, By Region, 2017-2022 ($Million)
6.6.Transportation
6.6.1.1.Market Assessment and Forecast, By Region, 2017-2022 ($Million)
6.7.Other Applications
6.7.1.1.Market Assessment and Forecast, By Region, 2017-2022 ($Million)
7.Polyurea Market, By Region
7.1.Introduction
7.2.Polyurea Market Assessment and Forecast, By Region, 2017-2022 ($Million)
7.3.North America
7.3.1. Market Assessment and Forecast, By Country, 2017-2022 ($Million)
7.3.2. Market Assessment and Forecast, By Product, 2017-2022 ($Million)
7.3.3. Market Assessment and Forecast, By Raw Material, 2017-2022 ($Million)
7.3.4. Market Assessment and Forecast, By Application, 2017-2022 ($Million)
7.3.4.1.U.S.
7.3.4.1.1.Market Assessment and Forecast, By Product, 2017-2022 ($Million)
7.3.4.1.2.Market Assessment and Forecast, By Raw Material, 2017-2022 ($Million)
7.3.4.1.3.Market Assessment and Forecast, By Application, 2017-2022 ($Million)
7.3.4.1.4.
7.3.4.2.Canada
7.3.4.2.1.Market Assessment and Forecast, By Product, 2017-2022 ($Million)
7.3.4.2.2.Market Assessment and Forecast, By Raw Material, 2017-2022 ($Million)
7.3.4.2.3.Market Assessment and Forecast, By Application, 2017-2022 ($Million)
7.3.4.3.Mexico
7.3.4.3.1.Market Assessment and Forecast, By Product, 2017-2022 ($Million)
7.3.4.3.2.Market Assessment and Forecast, By Raw Material, 2017-2022 ($Million)
7.3.4.3.3.Market Assessment and Forecast, By Application, 2017-2022 ($Million)
7.4.Europe
7.4.1. Market Assessment and Forecast, By Country, 2017-2022 ($Million)
7.4.2. Market Assessment and Forecast, By Product, 2017-2022 ($Million)
7.4.3. Market Assessment and Forecast, By Raw Material, 2017-2022 ($Million)
7.4.4. Market Assessment and Forecast, By Application, 2017-2022 ($Million)
7.4.4.1.Germany
7.4.4.1.1.Market Assessment and Forecast, By Product, 2017-2022 ($Million)
7.4.4.1.2.Market Assessment and Forecast, By Raw Material, 2017-2022 ($Million)
7.4.4.1.3.Market Assessment and Forecast, By Application, 2017-2022 ($Million)
7.4.4.2.France
7.4.4.2.1.Market Assessment and Forecast, By Product, 2017-2022 ($Million)
7.4.4.2.2.Market Assessment and Forecast, By Product, 2017-2022 ($Million)
7.4.4.2.3.Market Assessment and Forecast, By Application, 2017-2022 ($Million)
7.4.4.3.UK
7.4.4.3.1.Market Assessment and Forecast, By Product, 2017-2022 ($Million)
7.4.4.3.2.Market Assessment and Forecast, By Raw Material, 2017-2022 ($Million)
7.4.4.3.3.Market Assessment and Forecast, By Application, 2017-2022 ($Million)
7.4.4.4.Italy
7.4.4.4.1.Market Assessment and Forecast, By Product, 2017-2022 ($Million)
7.4.4.4.2.Market Assessment and Forecast, By Raw Material, 2017-2022 ($Million)
7.4.4.4.3.Market Assessment and Forecast, By Application, 2017-2022 ($Million)
7.4.4.5.Spain
7.4.4.5.1.Market Assessment and Forecast, By Product, 2017-2022 ($Million)
7.4.4.5.2.Market Assessment and Forecast, By Raw Material, 2017-2022 ($Million)
7.4.4.5.3.Market Assessment and Forecast, By Application, 2017-2022 ($Million)
7.4.4.6.Russia
7.4.4.6.1.Market Assessment and Forecast, By Product, 2017-2022 ($Million)
7.4.4.6.2.Market Assessment and Forecast, By Raw Material, 2017-2022 ($Million)
7.4.4.6.3.Market Assessment and Forecast, By Application, 2017-2022 ($Million)
7.4.4.7.Rest of Europe
7.4.4.7.1.Market Assessment and Forecast, By Product, 2017-2022 ($Million)
7.4.4.7.2.Market Assessment and Forecast, By Raw Material, 2017-2022 ($Million)
7.4.4.7.3.Market Assessment and Forecast, By Application, 2017-2022 ($Million)
7.5.Asia-Pacific
7.5.1. Market Assessment and Forecast, By Country, 2017-2022 ($Million)
7.5.2. Market Assessment and Forecast, By Product, 2017-2022 ($Million)
7.5.3. Market Assessment and Forecast, By Raw Material, 2017-2022 ($Million)
7.5.4. Market Assessment and Forecast, By Application, 2017-2022 ($Million)
7.5.4.1.Japan
7.5.4.1.1.Market Assessment and Forecast, By Product, 2017-2022 ($Million)
7.5.4.1.2.Market Assessment and Forecast, By Raw Material, 2017-2022 ($Million)
7.5.4.1.3.Market Assessment and Forecast, By Application, 2017-2022 ($Million)
7.5.4.2.China
7.5.4.2.1.Market Assessment and Forecast, By Product, 2017-2022 ($Million)
7.5.4.2.2.Market Assessment and Forecast, By Raw Material, 2017-2022 ($Million)
7.5.4.2.3.Market Assessment and Forecast, By Application, 2017-2022 ($Million)
7.5.4.3.Australia
7.5.4.3.1.Market Assessment and Forecast, By Product, 2017-2022 ($Million)
7.5.4.3.2.Market Assessment and Forecast, By Raw Material, 2017-2022 ($Million)
7.5.4.3.3.Market Assessment and Forecast, By Application, 2017-2022 ($Million)
7.5.4.4.India
7.5.4.4.1.Market Assessment and Forecast, By Product, 2017-2022 ($Million)
7.5.4.4.2.Market Assessment and Forecast, By Raw Material, 2017-2022 ($Million)
7.5.4.4.3.Market Assessment and Forecast, By Application, 2017-2022 ($Million)
7.5.4.5.South Korea
7.5.4.5.1.Market Assessment and Forecast, By Product, 2017-2022 ($Million)
7.5.4.5.2.Market Assessment and Forecast, By Raw Material, 2017-2022 ($Million)
7.5.4.5.3.Market Assessment and Forecast, By Application, 2017-2022 ($Million)
7.5.4.6.Taiwan
7.5.4.6.1.Market Assessment and Forecast, By Product, 2017-2022 ($Million)
7.5.4.6.2.Market Assessment and Forecast, By Raw Material, 2017-2022 ($Million)
7.5.4.6.3.Market Assessment and Forecast, By Application, 2017-2022 ($Million)
7.5.4.7.Rest of Asia-Pacific
7.5.4.7.1.Market Assessment and Forecast, By Product, 2017-2022 ($Million)
7.5.4.7.2.Market Assessment and Forecast, By Raw Material, 2017-2022 ($Million)
7.5.4.7.3.Market Assessment and Forecast, By Application, 2017-2022 ($Million)
7.6.Rest of the World
7.6.1. Market Assessment and Forecast, By Country, 2017-2022 ($Million)
7.6.2. Market Assessment and Forecast, By Product, 2017-2022 ($Million)
7.6.3. Market Assessment and Forecast, By Raw Material, 2017-2022 ($Million)
7.6.4. Market Assessment and Forecast, By Application, 2017-2022 ($Million)
7.6.4.1.Brazil
7.6.4.1.1.Market Assessment and Forecast, By Product, 2017-2022 ($Million)
7.6.4.1.2.Market Assessment and Forecast, By Raw Material, 2017-2022 ($Million)
7.6.4.1.3.Market Assessment and Forecast, By Application, 2017-2022 ($Million)
7.6.4.2.Turkey
7.6.4.2.1.Market Assessment and Forecast, By Product, 2017-2022 ($Million)
7.6.4.2.2.Market Assessment and Forecast, By Raw Material, 2017-2022 ($Million)
7.6.4.2.3.Market Assessment and Forecast, By Application, 2017-2022 ($Million)
7.6.4.3.Saudi Arabia
7.6.4.3.1.Market Assessment and Forecast, By Product, 2017-2022 ($Million)
7.6.4.3.2.Market Assessment and Forecast, By Raw Material, 2017-2022 ($Million)
7.6.4.3.3.Market Assessment and Forecast, By Application, 2017-2022 ($Million)
7.6.4.4.South Africa
7.6.4.4.1.Market Assessment and Forecast, By Product, 2017-2022 ($Million)
7.6.4.4.2.Market Assessment and Forecast, By Raw Material, 2017-2022 ($Million)
7.6.4.4.3.Market Assessment and Forecast, By Application, 2017-2022 ($Million)
7.6.4.5.United Arab Emirates
7.6.4.5.1.Market Assessment and Forecast, By Product, 2017-2022 ($Million)
7.6.4.5.2.Market Assessment and Forecast, By Raw Material, 2017-2022 ($Million)
7.6.4.5.3.Market Assessment and Forecast, By Application, 2017-2022 ($Million)
7.6.4.6.Others
7.6.4.6.1.Market Assessment and Forecast, By Product, 2017-2022 ($Million)
7.6.4.6.2.Market Assessment and Forecast, By Raw Material, 2017-2022 ($Million)
7.6.4.6.3.Market Assessment and Forecast, By Application, 2017-2022 ($Million)
8.Company Profiles
8.1.Bayer AG
8.1.1. Business Overview
8.1.2. Product Portfolio
8.1.3. Key Financials
8.1.4. Strategic Developments
8.2.BASF SE
8.2.1. Business Overview
8.2.2. Product Portfolio
8.2.3. Key Financials
8.2.4. Strategic Developments
8.3.Specialty Products, Inc.
8.3.1. Business Overview
8.3.2. Product Portfolio
8.3.3. Strategic Developments
8.4.Huntsman Corporation
8.4.1. Business Overview
8.4.2. Product Portfolio
8.4.3. Key Financials
8.4.4. Strategic Developments
8.5.Nukote Coating Systems International
8.5.1. Business Overview
8.5.2. Product Portfolio
8.5.3. Strategic Developments
8.6.FLEX LTD.
8.6.1. Business Overview
8.6.2. Product Portfolio
8.6.3. Key Financials
8.6.4. Strategic Developments
8.7.SWD Urethane
8.7.1. Business Overview
8.7.2. Product Portfolio
8.7.3. Strategic Developments
8.8.Alberts Spray Solutions, LLC
8.8.1. Business Overview
8.8.2. Product Portfolio
8.8.3. Strategic Developments
8.9.PPG Industries Ohio, Inc.
8.9.1. Business Overview
8.9.2. Product Portfolio
8.9.3. Key Financials
8.9.4. Strategic Developments
8.10.W.R. Grace & Co.
8.10.1.Business Overview
8.10.2.Product Portfolio
8.10.3.Key Financials
8.10.4.Strategic Developments
8.11.Dow chemical
8.11.1.Business Overview
8.11.2.Product Portfolio
8.11.3.Key Financials
8.11.4.Strategic Developments
List of Tables
Table 1.Polyurea Market, By Product ($Million), 2017-2022
Table 2.Coating Market, By Region ($Million), 2017-2022
Table 3.Lining Market, By Region ($Million), 2017-2022
Table 4.Sealants Market, By Region ($Million), 2017-2022
Table 5.Polyurea Market, By Raw Material ($Million), 2017-2022
Table 6.Aliphatic Market, By Region ($Million), 2017-2022
Table 7.Polyurea Market, By Application ($Million), 2017-2022
Table 8.Industrial Market, By Region ($Million), 2017-2022
Table 9.Building & Construction Market, By Region ($Million), 2017-2022
Table 10.Sealants Market, By Region ($Million), 2017-2022
Table 11.Landscape Market, By Raw Material ($Million), 2017-2022
Table 12.Transportation Market, By Region ($Million), 2017-2022
Table 13.Other Applications Market, By Region ($Million), 2017-2022
Table 14.Polyurea Market, By Region ($Million), 2017-2022
Table 15.North America Polyurea Market, By Country, 2017-2022 ($Million)
Table 16.North America Polyurea Market, By Product, 2017-2022 ($Million)
Table 18.North America Polyurea Market, By Raw Material, 2017-2022 ($Million)
Table 19.North America Polyurea Market, By Application, 2017-2022 ($Million)
Table 20.U.S. Polyurea Market, By Product, 2017-2022 ($Million)
Table 21.U.S. Polyurea Market, By Raw Material, 2017-2022 ($Million)
Table 22.U.S. Polyurea Market, By Application, 2017-2022 ($Million)
Table 23.Canada Polyurea Market, By Product, 2017-2022 ($Million)
Table 24.Canada Polyurea Market, By Raw Material, 2017-2022 ($Million)
Table 25.Canada Polyurea Market, By Application, 2017-2022 ($Million)
Table 26.Mexico Polyurea Market, By Product, 2017-2022 ($Million)
Table 27.Mexico Polyurea Market, By Raw Material, 2017-2022 ($Million)
Table 28.Mexico Polyurea Market, By Application, 2017-2022 ($Million)
Table 29.Europe Polyurea Market, By Country, 2017-2022 ($Million)
Table 30.Europe Polyurea Market, By Product, 2017-2022 ($Million)
Table 31.Europe Polyurea Market, By Raw Material, 2017-2022 ($Million)
Table 32.Europe Polyurea Market, By Application, 2017-2022 ($Million)
Table 33.Germany Polyurea Market, By Product, 2017-2022 ($Million)
Table 34.Germany Polyurea Market, By Raw Material, 2017-2022 ($Million)
Table 35.Germany Polyurea Market, By Application, 2017-2022 ($Million)
Table 36.France Polyurea Market, By Product, 2017-2022 ($Million)
Table 37.France Polyurea Market, By Raw Material, 2017-2022 ($Million)
Table 38.France Polyurea Market, By Application, 2017-2022 ($Million)
Table 39.UK Polyurea Market, By Product, 2017-2022 ($Million)
Table 40.UK Polyurea Market, By Raw Material, 2017-2022 ($Million)
Table 41.UK Polyurea Market, By Application, 2017-2022 ($Million)
Table 42.Italy Polyurea Market, By Product, 2017-2022 ($Million)
Table 43.Italy Polyurea Market, By Raw Material, 2017-2022 ($Million)
Table 44.Italy Polyurea Market, By Application, 2017-2022 ($Million)
Table 45.Spain Polyurea Market, By Product, 2017-2022 ($Million)
Table 46.Spain Polyurea Market, By Raw Material, 2017-2022 ($Million)
Table 47.Spain Polyurea Market, By Application, 2017-2022 ($Million)
Table 48.Russia Polyurea Market, By Product, 2017-2022 ($Million)
Table 49.Russia Polyurea Market, By Raw Material, 2017-2022 ($Million)
Table 50.Russia Polyurea Market, By Application, 2017-2022 ($Million)
Table 51.Rest of Europe Polyurea Market, By Product, 2017-2022 ($Million)
Table 52.Rest of Europe Polyurea Market, By Raw Material, 2017-2022 ($Million)
Table 53.Rest of Europe Polyurea Market, By Application, 2017-2022 ($Million)
Table 54.Asia-Pacific Polyurea Market, By Country, 2017-2022 ($Million)
Table 55.Asia-Pacific Polyurea Market, By Product, 2017-2022 ($Million)
Table 56.Asia-Pacific Polyurea Market, By Raw Material, 2017-2022 ($Million)
Table 57.Asia-Pacific Polyurea Market, By Application, 2017-2022 ($Million)
Table 58.Japan Polyurea Market, By Product, 2017-2022 ($Million)
Table 59.Japan Polyurea Market, By Raw Material, 2017-2022 ($Million)
Table 60.Japan Polyurea Market, By Application, 2017-2022 ($Million)
Table 61.China Polyurea Market, By Product, 2017-2022 ($Million)
Table 62.China Polyurea Market, By Raw Material, 2017-2022 ($Million)
Table 63.China Polyurea Market, By Application, 2017-2022 ($Million)
Table 64.Australia Polyurea Market, By Product, 2017-2022 ($Million)
Table 65.Australia Polyurea Market, By Raw Material, 2017-2022 ($Million)
Table 66.Australia Polyurea Market, By Application, 2017-2022 ($Million)
Table 67.India Polyurea Market, By Product, 2017-2022 ($Million)
Table 68.India Polyurea Market, By Raw Material, 2017-2022 ($Million)
Table 69.India Polyurea Market, By Application, 2017-2022 ($Million)
Table 70.South Korea Polyurea Market, By Product, 2017-2022 ($Million)
Table 71.South Korea Polyurea Market, By Raw Material, 2017-2022 ($Million)
Table 72.South Korea Polyurea Market, By Application, 2017-2022 ($Million)
Table 73.Taiwan Polyurea Market, By Product, 2017-2022 ($Million)
Table 74.Taiwan Polyurea Market, By Raw Material, 2017-2022 ($Million)
Table 75.Taiwan Polyurea Market, By Application, 2017-2022 ($Million)
Table 76.Rest of Asia-Pacific Polyurea Market, By Product, 2017-2022 ($Million)
Table 77.Rest of Asia-Pacific Polyurea Market, By Raw Material, 2017-2022 ($Million)
Table 78.Rest of Asia-Pacific Polyurea Market, By Application, 2017-2022 ($Million)
Table 79.Rest of the World Polyurea Market, By Country, 2017-2022 ($Million)
Table 80.Rest of the World Polyurea Market, By Product, 2017-2022 ($Million)
Table 81.Rest of the World Polyurea Market, By Raw Material, 2017-2022 ($Million)
Table 82.Rest of the World Polyurea Market, By Application, 2017-2022 ($Million)
Table 83.Brazil Polyurea Market, By Product, 2017-2022 ($Million)
Table 84.Brazil Polyurea Market, By Raw Material, 2017-2022 ($Million)
Table 85.Brazil Polyurea Market, By Application, 2017-2022 ($Million)
Table 86.Turkey Polyurea Market, By Product, 2017-2022 ($Million)
Table 87.Turkey Polyurea Market, By Raw Material, 2017-2022 ($Million)
Table 88.Turkey Polyurea Market, By Application, 2017-2022 ($Million)
Table 89.Saudi Arabia Polyurea Market, By Product, 2017-2022 ($Million)
Table 90.Saudi Arabia Polyurea Market, By Raw Material, 2017-2022 ($Million)
Table 91.Saudi Arabia Polyurea Market, By Application, 2017-2022 ($Million)
Table 92.South Africa Polyurea Market, By Product, 2017-2022 ($Million)
Table 93.South Africa Polyurea Market, By Raw Material, 2017-2022 ($Million)
Table 94.South Africa Polyurea Market, By Application, 2017-2022 ($Million)
Table 95.United Arab Emirates Polyurea Market, By Product, 2017-2022 ($Million)
Table 96.United Arab Emirates Polyurea Market, By Raw Material, 2017-2022 ($Million)
Table 97.United Arab Emirates Polyurea Market, By Application, 2017-2022 ($Million)
Table 98.Others Polyurea Market, By Product, 2017-2022 ($Million)
Table 99.Others Polyurea Market, By Raw Material, 2017-2022 ($Million)
Table 100.Others Polyurea Market, By Application, 2017-2022 ($Million)
Table 101.Bayer AG: Key Strategic Developments, 2017-2017
Table 102.BASF SE.: Key Strategic Developments, 2017-2017
Table 103.Specialty Products, Inc.: Key Strategic Developments, 2017-2017
Table 104.Huntsman Corporation: Key Strategic Developments, 2017-2017
Table 105.Nukote Coating Systems International: Key Strategic Developments, 2017-2017
Table 106.FLEX LTD.: Key Strategic Developments, 2017-2017
Table 107.SWD Urethane: Key Strategic Developments, 2017-2017
Table 108.Alberts Spray Solutions, LLC: Key Strategic Developments, 2017-2017
Table 109.PPG Industries Ohio, Inc.: Key Strategic Developments, 2017-2017
Table 110.W.R. Grace & Co.: Key Strategic Developments, 2017-2017
Table 111.Dow chemical: Key Strategic Developments, 2017-2017
List of Figures
Figure 1.Polyurea Market Share, By Product, 2017 & 2022 ($Million)
Figure 2.Polyurea Market, By Raw Material, 2017 & 2022 ($Million)
Figure 3.Polyurea Market, By Application, 2017 & 2022 ($Million)
Figure 4.Polyurea Market, By Region, 2017, ($Million)
Figure 5.Bayer AG: Net Revenues, 2017-2017 ($Million)
Figure 6.Bayer AG: Net Revenue Share, By Segment, 2017
Figure 7.Bayer AG: Net Revenue Share, By Geography, 2017
Figure 8.BASF SE: Net Revenues, 2017-2017 ($Million)
Figure 9.BASF SE: Net Revenue Share, By Segment, 2017
Figure 10.BASF SE: Net Revenue Share, By Geography, 2017
Figure 11.Specialty Products, Inc.: Net Revenues, 2017-2017 ($Million)
Figure 12.Specialty Products, Inc.: Net Revenue Share, By Segment, 2017
Figure 13.Specialty Products, Inc.: Net Revenue Share, By Geography, 2017
Figure 14.Huntsman Corporation: Net Revenues, 2017-2017 ($Million)
Figure 15.Huntsman Corporation: Net Revenue Share, By Segment, 2017
Figure 16.Huntsman Corporation: Net Revenue Share, By Geography, 2017
Figure 17.FLEX LTD.: Net Revenues, 2017-2017 ($Million)
Figure 18.FLEX LTD.: Net Revenue Share, By Segment, 2017
Figure 19.FLEX LTD.: Net Revenue Share, By Geography, 2017
Figure 20.PPG Industries Ohio, Inc.: Net Revenues, 2017-2017 ($Million)
Figure 21.PPG Industries Ohio, Inc.: Net Revenue Share, By Segment, 2017
Figure 22.PPG Industries Ohio, Inc.: Net Revenue Share, By Geography, 2017
Figure 23.W.R. Grace & Co.: Net Revenues, 2017-2017 ($Million)
Figure 24.W.R. Grace & Co.: Net Revenue Share, By Segment, 2017
Figure 25.W.R. Grace & Co.: Net Revenue Share, By Geography, 2017
Figure 26.Dow chemical: Net Revenues, 2017-2017 ($Million)
Figure 27.Dow chemical: Net Revenue Share, By Segment, 2017
Figure 28.Dow chemical: Net Revenue Share, By Geography, 2017
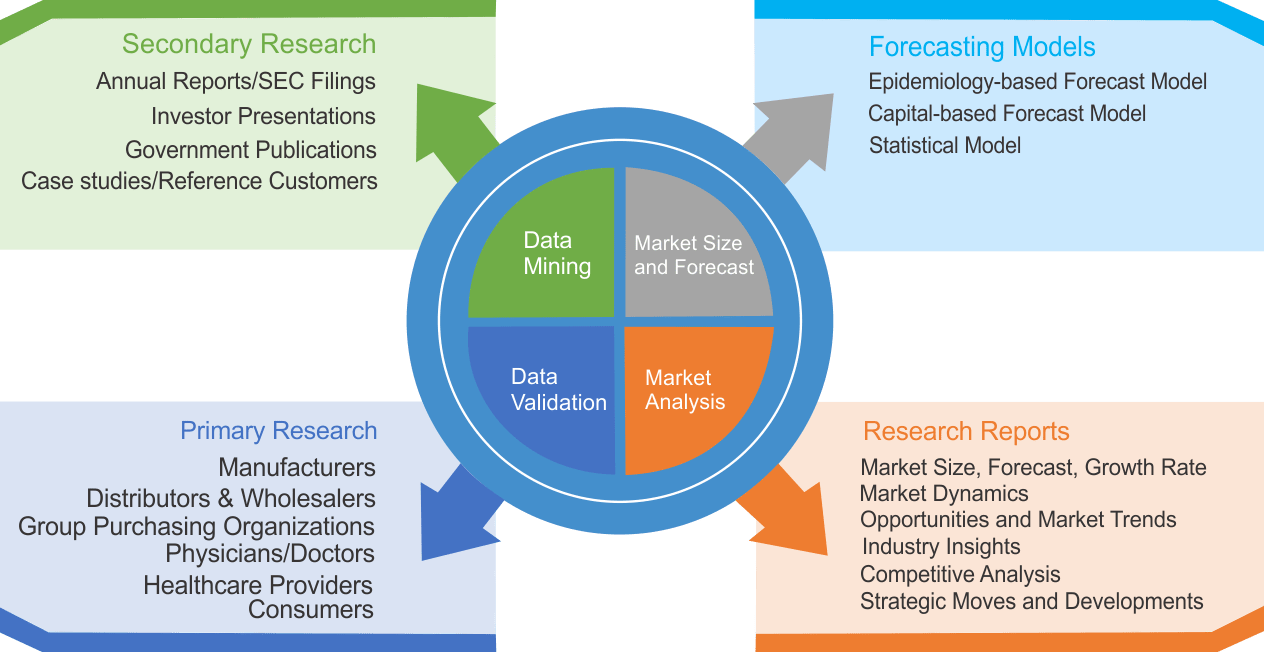
Research Methodology
We use both primary as well as secondary research for our market surveys, estimates and for developing forecast. Our research process commence by analyzing the problem which enable us to design the scope for our research study. Our research process is uniquely designed with enough flexibility to adjust according to changing nature of products and markets, while retaining core element to ensure reliability and accuracy in research findings. We understand both macro and micro-economic factors to evaluate and forecast different market segments.
Data Mining
Data is extensively collected through various secondary sources such as annual reports, investor presentations, SEC filings, and other corporate publications. We also refer trade magazines, technical journals, paid databases such as Factiva and Bloomberg, industry trade journals, scientific journals, and social media data to understand market dynamics and industry trends. Further, we also conduct primary research to understand market drivers, restraints, opportunities, challenges, and competitive scenario to build our analysis.
Data Collection Matrix
|
Data Collection Matrix |
Supply Side |
Demand Side |
|
Primary Data Sources |
|
|
|
Secondary Data Sources |
|
|
Market Modeling and Forecasting
We use epidemiology and capital equipment-based models to forecast market size of different segments at country and regional level.
- Epidemiology-based Forecasting Model: This method uses epidemiology data gathered through various publications and from physicians to estimate population of patients, flow of treatment of individual disease and therapies. The data collected through this method includes statics on incidence of disease, population suffering from disease, and treatment population. This method is used to understand:
- Number of patients for particular device or medical procedure and
- Repeated use of particular device depending on health and condition of patient
- Capital-based Forecasting Model: This method of forecasting is based on number of replacements, installed-based and new sales of capital equipment used in various healthcare and diagnostic centers. These three parameters are calculated and forecast is developed. Installation base is calculated as average number of units per facility; while sales for particular year is calculated from number of new and replace units. Secondary data is collected through various supply chain intermediaries and opinion leaders to arrive at installation and sales rate. These techniques help our analysts in validating market and developed market estimates and forecast.
We do forecast on basis of several parameters such as market drivers, market opportunities, industry trends government regulations, raw materials supply and trade dynamics to ensure relevance of forecast with market scenario. With increasing need to granulized information, we used bottom-up methodology for forecasting where we evaluate each regional segment differently and combined all forecast to develop final market forecast.
Data Validation
We believe primary research is a very important tool in analyzing and forecasting different markets. In order to make sure accuracy of our findings, our team conducts primary interviews at every stage of research to gain deep insights into current business environment and future trends and key developments in market. This includes use of various methods such as telephonic interviews, focus groups, face to face interviews and questionnaires to validate our research from all aspects. We validate our data through primary research from key industry leaders such as CEO, product managers, marketing managers, suppliers, distributors, and consumers are frequently interviewed. These interviews provide valuable insights which help us to have better market understanding besides validating our estimates and forecast.
Data Triangulation
Industry Analysis
|
Qualitative Data |
Quantitative Data (2017-2025) |
|
|