Patient Portal Market by Product, Deployment Mode and End User - Global Industry Analysis and Forecast to 2027
Published On : August 2017 Pages : 105 Category: Healthcare IT Report Code : HC08190
Industry Trend Analysis
The global patient portal market is expected to be around $6 billion by 2027. The market is majorly driven by factors such as increasing adoption of electronic health record (EHR) systems by healthcare professionals, recent advancements in healthcare IT, favorable government initiatives for adoption of healthcare IT solutions and rising awareness about convenient online access to personal health information. Using patient portals, patients can easily schedule doctor’s appointments, review recent doctor visits, gain access to lab results and medications and perform other activities through an internet connection without having to travel physically to any of these locations. However, factors such as high cost of deploying patient portal solutions and issues related to data privacy can hinder the growth of patient portal market during the forecast period.
Product Outlook and Trend Analysis
Integrated patient portal segment accounted for the major share of the patient portal market in 2017. As these systems offer the convenience of performing various functions using a common interface, integrating data from other systems such as EHRs and electronic medical records (EMRs) is easily feasible. Hence, these systems are witnessing huge demand resulting in a dominant market share.
Deployment Mode Outlook and Trend Analysis
Web-based deployment segment held a major share of the patient portal market in 2017. However, cloud-based deployment segment is projected to grow at a highest rate due to the affordability and improved efficiency of data access. As cloud based patient portals do not require costly infrastructure to be maintained at the user’s site, medium and small scale healthcare providers can largely benefit from these systems.
End User Outlook and Trend Analysis
Providers segment accounted for the largest share of the patient portal market in 2017 owing to large scale adoption of patient portals by healthcare providers for streamlining and optimizing their operations as well as for reducing the cost of healthcare. With favorable government initiatives for adoption and implementation of healthcare IT systems, healthcare providers are increasingly adopting patient portals for managing their patient engagements.
Regional Outlook Trend Analysis
North America accounted for largest share of the global patient portal market in 2017 owing to the availability of advanced healthcare IT infrastructure, rapid adoption of patient portal systems by the healthcare sector and favorable government initiatives for adoption of healthcare IT systems to improve the efficiency and quality of healthcare in the region. Europe patient portal market is expected to grow with the highest CAGR during the forecast period due to increasing demand for advanced healthcare delivery systems along with rising awareness related to the convenience of patient portals.
Competitive Analysis
The major players in the global patient portal market focus on product development in order to introduce new-age IT solutions for healthcare delivery and thus secure a larger share of the global market. Some of the key players operating in the global patient portal market are, Allscripts Healthcare, LLC, athenahealth, Inc., McKesson Corporation, eClinicalWorks, LLC, Cerner Corporation, Greenway Health, LLC, NextGen Healthcare Information Systems, LLC (a part of Quality systems, Inc.), CureMD Healthcare, General Electric Company, Medfusion Inc., Epic Systems Corporation and Intelichart.
Patient Portal Market Segmentation:
By Product:
- Integrated Patient Portals
- Standalone Patient Portals
By Deployment Mode:
- Web-based Deployment
- Cloud-based Deployment
By End User:
- Providers
- Pharmacies
- Payers
- Other End Users
By Region:
- North America
- U.S
- Canada
- Mexico
- Europe
- Germany
- France
- UK
- Italy
- Spain
- Rest of Europe
- Asia-Pacific
- Japan
- China
- Australia
- India
- South Korea
- Rest of Asia-Pacific
- Rest of the World
- Brazil
- South Africa
- Saudi Arabia
- Turkey
- United Arab Emirates
- Others
Some of the key questions answered by the report are:
- What was the market size in 2017 and forecast from 2022 to 2027?
- What will be the industry market growth from 2022 to 2027?
- What are the major drivers, restraints, opportunities, challenges, and industry trends and their impact on the market forecast?
- What are the major segments leading the market growth and why?
- Which are the leading players in the market and what are the major strategies adopted by them to sustain the market competition?
Market Classification
- Patient Portal Market By Product, Estimates and Forecast, 2017-2027 ($Million)
- Integrated Patient Portals
- Standalone Patient Portals
- Patient Portal Market By Deployment Mode, Estimates and Forecast, 2017-2027 ($Million)
- Web-based Deployment
- Cloud-based Deployment
- Patient Portal Market By End User, Estimates and Forecast, 2017-2027 ($Million)
- Providers
- Pharmacies
- Payers
- Other End Users
- Patient Portal Market By Region, Estimates and Forecast, 2017-2027 ($Million)
- North America
- North America Patient Portal Market, By Country
- North America Patient Portal Market, By Product
- North America Patient Portal Market, By Deployment Mode
- North America Patient Portal Market, By End User
- U.S. Patient Portal Market, By Product
- U.S. Patient Portal Market, By Deployment Mode
- U.S. Patient Portal Market, By End User
- Canada Patient Portal Market, By Product
- Canada Patient Portal Market, By Deployment Mode
- Canada Patient Portal Market, By End User
- Mexico Patient Portal Market, By Product
- Mexico Patient Portal Market, By Deployment Mode
- Mexico Patient Portal Market, By End User
-
- Europe
- Europe Patient Portal Market, By Country
- Europe Patient Portal Market, By Product
- Europe Patient Portal Market, By Deployment Mode
- Europe Patient Portal Market, By End User
- Germany Patient Portal Market, By Product
- Germany Patient Portal Market, By Deployment Mode
- Germany Patient Portal Market, By End User
- France Patient Portal Market, By Product
- France Patient Portal Market, By Deployment Mode
- France Patient Portal Market, By End User
- UK Patient Portal Market, By Product
- UK Patient Portal Market, By Deployment Mode
- UK Patient Portal Market, By End User
- Italy Patient Portal Market, By Product
- Italy Patient Portal Market, By Deployment Mode
- Italy Patient Portal Market, By End User
- Spain Patient Portal Market, By Product
- Spain Patient Portal Market, By Deployment Mode
- Spain Patient Portal Market, By End User
- Rest of Europe Patient Portal Market, By Product
- Rest of Europe Patient Portal Market, By Deployment Mode
- Rest of Europe Patient Portal Market, By End User
-
- Asia-Pacific
- Asia-Pacific Patient Portal Market, By Country
- Asia-Pacific Patient Portal Market, By Product
- Asia-Pacific Patient Portal Market, By Deployment Mode
- Asia-Pacific Patient Portal Market, By End User
- Japan Patient Portal Market, By Product
- Japan Patient Portal Market, By Deployment Mode
- Japan Patient Portal Market, By End User
- China Patient Portal Market, By Product
- China Patient Portal Market, By Deployment Mode
- China Patient Portal Market, By End User
- Australia Patient Portal Market, By Product
- Australia Patient Portal Market, By Deployment Mode
- Australia Patient Portal Market, By End User
- India Patient Portal Market, By Product
- India Patient Portal Market, By Deployment Mode
- India Patient Portal Market, By End User
- South Korea Patient Portal Market, By Product
- South Korea Patient Portal Market, By Deployment Mode
- South Korea Patient Portal Market, By End User
- Rest of Asia-Pacific Patient Portal Market, By Product
- Rest of Asia-Pacific Patient Portal Market, By Deployment Mode
- Rest of Asia-Pacific Patient Portal Market, By End User
- Asia-Pacific
-
- Rest of the World
- Rest of the World Patient Portal Market, By Country
- Rest of the World Patient Portal Market, By Product
- Rest of the World Patient Portal Market, By Deployment Mode
- Rest of the World Patient Portal Market, By End User
- Brazil Patient Portal Market, By Product
- Brazil Patient Portal Market, By Deployment Mode
- Brazil Patient Portal Market, By End User
- South Africa Patient Portal Market, By Product
- South Africa Patient Portal Market, By Deployment Mode
- South Africa Patient Portal Market, By End User
- Saudi Arabia Patient Portal Market, By Product
- Saudi Arabia Patient Portal Market, By Deployment Mode
- Saudi Arabia Patient Portal Market, By End User
- Turkey Patient Portal Market, By Product
- Turkey Patient Portal Market, By Deployment Mode
- Turkey Patient Portal Market, By End User
- United Arab Emirates Patient Portal Market, By Product
- United Arab Emirates Patient Portal Market, By Deployment Mode
- United Arab Emirates Patient Portal Market, By End User
- Others Patient Portal Market, By Product
- Others Patient Portal Market, By Deployment Mode
- Others Patient Portal Market, By End User
- Rest of the World
Table of Contents
1. Introduction
1.1. Report Description
1.2. Research Methodology
1.2.1. Secondary Research
1.2.2. Primary Research
2. Executive Summary
2.1. Key Highlights
3. Market Overview
3.1. Introduction
3.1.1. Market Definition
3.1.2. Market Segmentation
3.2. Market Share Analysis
3.3. Market Dynamics
3.3.1. Drivers
3.3.1.1. Technological Advancements in healthcare IT Sector
3.3.1.2. Increasing Demand for Electronic Health Record (EHR) Systems
3.3.1.3. Increasing Awareness Related to Convenience Offered by Patient Portals
3.3.2. Restraints
3.3.2.1. High Cost of Implementation
3.3.2.2. Concerns Related to Data Security and Privacy
3.3.3. Opportunities
3.3.3.1. Emerging Markets to Offer Lucrative Growth Opportunities
4. Patient Portal Market, By Product
4.1. Introduction
4.2. Patient Portal Market Assessment and Forecast, By Product, 2017-2027
4.3. Integrated Patient Portals
4.3.1. Market Assessment and Forecast, By Region, 2017-2027 ($Million)
4.4. Standalone Patient Portals
4.4.1. Market Assessment and Forecast, By Region, 2017-2027 ($Million)
5. Patient Portal Market, By Deployment Mode
5.1. Introduction
5.2. Patient Portal Market Assessment and Forecast, By Deployment Mode, 2017-2027
5.3. Web-based Deployment
5.3.1. Market Assessment and Forecast, By Region, 2017-2027 ($Million)
5.4. Cloud-based Deployment
5.4.1. Market Assessment and Forecast, By Region, 2017-2027 ($Million)
6. Patient Portal Market, By End User
6.1. Introduction
6.2. Patient Portal Market Assessment and Forecast, By End User, 2017-2027
6.3. Providers
6.3.1. Market Assessment and Forecast, By Region, 2017-2027 ($Million)
6.4. Pharmacies
6.4.1. Market Assessment and Forecast, By Region, 2017-2027 ($Million)
6.5. Payers
6.5.1. Market Assessment and Forecast, By Region, 2017-2027 ($Million)
6.6. Other End Users
6.6.1. Market Assessment and Forecast, By Region, 2017-2027 ($Million)
7. Patient Portal Market, By Region
7.1. Introduction
7.2. Patient Portal Market Assessment and Forecast, By Region, 2017-2027 ($Million)
7.3. North America
7.3.1. Market Assessment and Forecast, By Country, 2017-2027 ($Million)
7.3.2. Market Assessment and Forecast, By Product, 2017-2027 ($Million)
7.3.3. Market Assessment and Forecast, By Deployment Mode, 2017-2027 ($Million)
7.3.4. Market Assessment and Forecast, By End User, 2017-2027 ($Million)
7.3.4.1. U.S.
7.3.4.1.1. Market Assessment and Forecast, By Product, 2017-2027 ($Million)
7.3.4.1.2. Market Assessment and Forecast, By Deployment Mode, 2017-2027 ($Million)
7.3.4.1.3. Market Assessment and Forecast, By End User, 2017-2027 ($Million)
7.3.4.2. Canada
7.3.4.2.1. Market Assessment and Forecast, By Product, 2017-2027 ($Million)
7.3.4.2.2. Market Assessment and Forecast, By Deployment Mode, 2017-2027 ($Million)
7.3.4.2.3. Market Assessment and Forecast, By End User, 2017-2027 ($Million)
7.3.4.3. Mexico
7.3.4.3.1. Market Assessment and Forecast, By Product, 2017-2027 ($Million)
7.3.4.3.2. Market Assessment and Forecast, By Deployment Mode, 2017-2027 ($Million)
7.3.4.3.3. Market Assessment and Forecast, By End User, 2017-2027 ($Million)
7.4. Europe
7.4.1. Market Assessment and Forecast, By Country, 2017-2027 ($Million)
7.4.2. Market Assessment and Forecast, By Product, 2017-2027 ($Million)
7.4.3. Market Assessment and Forecast, By Deployment Mode, 2017-2027 ($Million)
7.4.4. Market Assessment and Forecast, By End User, 2017-2027 ($Million)
7.4.4.1. Germany
7.4.4.1.1. Market Assessment and Forecast, By Product, 2017-2027 ($Million)
7.4.4.1.2. Market Assessment and Forecast, By Deployment Mode, 2017-2027 ($Million)
7.4.4.1.3. Market Assessment and Forecast, By End User, 2017-2027 ($Million)
7.4.4.2. France
7.4.4.2.1. Market Assessment and Forecast, By Product, 2017-2027 ($Million)
7.4.4.2.2. Market Assessment and Forecast, By Deployment Mode, 2017-2027 ($Million)
7.4.4.2.3. Market Assessment and Forecast, By End User, 2017-2027 ($Million)
7.4.4.3. UK
7.4.4.3.1. Market Assessment and Forecast, By Product, 2017-2027 ($Million)
7.4.4.3.2. Market Assessment and Forecast, By Deployment Mode, 2017-2027 ($Million)
7.4.4.3.3. Market Assessment and Forecast, By End User, 2017-2027 ($Million)
7.4.4.4. Italy
7.4.4.4.1. Market Assessment and Forecast, By Product, 2017-2027 ($Million)
7.4.4.4.2. Market Assessment and Forecast, By Deployment Mode, 2017-2027 ($Million)
7.4.4.4.3. Market Assessment and Forecast, By End User, 2017-2027 ($Million)
7.4.4.5. Spain
7.4.4.5.1. Market Assessment and Forecast, By Product, 2017-2027 ($Million)
7.4.4.5.2. Assessment and Forecast, By Deployment Mode, 2017-2027 ($Million)
7.4.4.5.3. Market Assessment and Forecast, By End User, 2017-2027 ($Million)
7.4.4.6. Russia
7.4.4.6.1. Market Assessment and Forecast, By Product, 2017-2027 ($Million)
7.4.4.6.2. Market Assessment and Forecast, By Deployment Mode, 2017-2027 ($Million)
7.4.4.6.3. Market Assessment and Forecast, By End User, 2017-2027 ($Million)
7.4.4.7. Rest of Europe
7.4.4.7.1. Market Assessment and Forecast, By Product, 2017-2027 ($Million)
7.4.4.7.2. Assessment and Forecast, By Deployment Mode, 2017-2027 ($Million)
7.4.4.7.3. Market Assessment and Forecast, By End User, 2017-2027 ($Million)
7.5. Asia-Pacific
7.5.1. Market Assessment and Forecast, By Country, 2017-2027 ($Million)
7.5.2. Market Assessment and Forecast, By Product, 2017-2027 ($Million)
7.5.3. Market Assessment and Forecast, By Deployment Mode, 2017-2027 ($Million)
7.5.4. Market Assessment and Forecast, By End User, 2017-2027 ($Million)
7.5.4.1. Japan
7.5.4.1.1. Market Assessment and Forecast, By Product, 2017-2027 ($Million)
7.5.4.1.2. Market Assessment and Forecast, By Deployment Mode, 2017-2027 ($Million)
7.5.4.1.3. Market Assessment and Forecast, By End User, 2017-2027 ($Million)
7.5.4.2. China
7.5.4.2.1. Market Assessment and Forecast, By Product, 2017-2027 ($Million)
7.5.4.2.2. Market Assessment and Forecast, By Deployment Mode, 2017-2027 ($Million)
7.5.4.2.3. Market Assessment and Forecast, By End User, 2017-2027 ($Million)
7.5.4.3. Australia
7.5.4.3.1. Market Assessment and Forecast, By Product, 2017-2027 ($Million)
7.5.4.3.2. Market Assessment and Forecast, By Deployment Mode, 2017-2027 ($Million)
7.5.4.3.3. Market Assessment and Forecast, By End User, 2017-2027 ($Million)
7.5.4.4. India
7.5.4.4.1. Market Assessment and Forecast, By Product, 2017-2027 ($Million)
7.5.4.4.2. Market Assessment and Forecast, By Deployment Mode, 2017-2027 ($Million)
7.5.4.4.3. Market Assessment and Forecast, By End User, 2017-2027 ($Million)
7.5.4.5. South Korea
7.5.4.5.1. Market Assessment and Forecast, By Product, 2017-2027 ($Million)
7.5.4.5.2. Market Assessment and Forecast, By Deployment Mode, 2017-2027 ($Million)
7.5.4.5.3. Market Assessment and Forecast, By End User, 2017-2027 ($Million)
7.5.4.6. Taiwan
7.5.4.6.1. Market Assessment and Forecast, By Product, 2017-2027 ($Million)
7.5.4.6.2. Market Assessment and Forecast, By Deployment Mode, 2017-2027 ($Million)
7.5.4.6.3. Market Assessment and Forecast, By End User, 2017-2027 ($Million)
7.5.4.7. Rest of Asia-Pacific
7.5.4.7.1. Market Assessment and Forecast, By Product, 2017-2027 ($Million)
7.5.4.7.2. Market Assessment and Forecast, By Deployment Mode, 2017-2027 ($Million)
7.5.4.7.3. Market Assessment and Forecast, By End User, 2017-2027 ($Million)
7.6. Rest of the World
7.6.1. Market Assessment and Forecast, By Country, 2017-2027 ($Million)
7.6.2. Market Assessment and Forecast, By Product, 2017-2027 ($Million)
7.6.3. Market Assessment and Forecast, By Deployment Mode, 2017-2027 ($Million)
7.6.4. Market Assessment and Forecast, By End User, 2017-2027 ($Million)
7.6.4.1. Brazil
7.6.4.1.1. Market Assessment and Forecast, By Product, 2017-2027 ($Million)
7.6.4.1.2. Market Assessment and Forecast, By Deployment Mode, 2017-2027 ($Million)
7.6.4.1.3. Market Assessment and Forecast, By End User, 2017-2027 ($Million)
7.6.4.2. Turkey
7.6.4.2.1. Market Assessment and Forecast, By Product, 2017-2027 ($Million)
7.6.4.2.2. Market Assessment and Forecast, By Deployment Mode, 2017-2027 ($Million)
7.6.4.2.3. Market Assessment and Forecast, By End User, 2017-2027 ($Million)
7.6.4.3. Saudi Arabia
7.6.4.3.1. Market Assessment and Forecast, By Product, 2017-2027 ($Million)
7.6.4.3.2. Market Assessment and Forecast, By Deployment Mode, 2017-2027 ($Million)
7.6.4.3.3. Market Assessment and Forecast, By End User, 2017-2027 ($Million)
7.6.4.4. South Africa
7.6.4.4.1. Market Assessment and Forecast, By Product, 2017-2027 ($Million)
7.6.4.4.2. Market Assessment and Forecast, By Deployment Mode, 2017-2027 ($Million)
7.6.4.4.3. Market Assessment and Forecast, By End User, 2017-2027 ($Million)
7.6.4.5. United Arab Emirates
7.6.4.5.1. Market Assessment and Forecast, By Product, 2017-2027 ($Million)
7.6.4.5.2. Market Assessment and Forecast, By Deployment Mode, 2017-2027 ($Million)
7.6.4.5.3. Market Assessment and Forecast, By End User, 2017-2027 ($Million)
7.6.4.6. Others
7.6.4.6.1. Market Assessment and Forecast, By Product, 2017-2027 ($Million)
7.6.4.6.2. Market Assessment and Forecast, By Deployment Mode, 2017-2027 ($Million)
7.6.4.6.3. Market Assessment and Forecast, By End User, 2017-2027 ($Million)
8. Company Profiles
8.1. Allscripts Healthcare, LLC
8.1.1. Business Overview
8.1.2. Product Portfolio
8.1.3. Key Financials
8.1.4. Strategic Developments
8.2. athenahealth, Inc.
8.2.1. Business Overview
8.2.2. Product Portfolio
8.2.3. Key Financials
8.2.4. Strategic Developments
8.3. McKesson Corporation
8.3.1. Business Overview
8.3.2. Product Portfolio
8.3.3. Key Financials
8.3.4. Strategic Developments
8.4. eClinicalWorks, LLC
8.4.1. Business Overview
8.4.2. Product Portfolio
8.4.3. Strategic Developments
8.5. Cerner Corporation
8.5.1. Business Overview
8.5.2. Product Portfolio
8.5.3. Key Financials
8.5.4. Strategic Developments
8.6. Greenway Health, LLC
8.6.1. Business Overview
8.6.2. Product Portfolio
8.6.3. Strategic Developments
8.7. NextGen Healthcare Information Systems, LLC (a part of Quality systems, Inc.)
8.7.1. Business Overview
8.7.2. Product Portfolio
8.7.3. Key Financials
8.7.4. Strategic Developments
8.8. CureMD Healthcare
8.8.1. Business Overview
8.8.2. Product Portfolio
8.8.3. Strategic Developments
8.9. General Electric Company
8.9.1. Business Overview
8.9.2. Product Portfolio
8.9.3. Key Financials
8.9.4. Strategic Developments
8.10. Medfusion Inc.
8.10.1. Business Overview
8.10.2. Product Portfolio
8.10.3. Strategic Developments
8.11. Epic Systems Corporation
8.11.1. Business Overview
8.11.2. Product Portfolio
8.11.3. Strategic Developments
8.12. Intelichart
8.12.1. Business Overview
8.12.2. Product Portfolio
8.12.3. Strategic Developments
List of Tables
Table 1.Patient Portal Market, By Product, 2017-2025, ($Million)
Table 2.Integrated Patient Portals Market, By Region, 2017-2025, ($Million)
Table 3.Standalone Patient Portals Market, By Region, 2017-2025, ($Million),
Table 4.Patient Portal Market, By Deployment Mode 2017-2025, ($Million)
Table 5.Web-based Deployment Market, By Region, 2017-2025, ($Million)
Table 6.Cloud-based Deployment Market, By Region, ($Million), 2017-2025
Table 7.Patient Portal Market, By End User, 2017-2025, ($Million)
Table 8.Providers Market, By Region, 2017-2025, ($Million)
Table 9.Pharmacies Market, By Region, 2017-2025, ($Million)
Table 10.Payers Market, By Region, 2017-2025, ($Million)
Table 11.Other End Users Market, By End User, 2017-2025, ($Million)
Table 12.Patient Portal Market, By Region, 2017-2025 ($Million)
Table 13.North America Patient Portal Market, By Country, 2017-2025 ($Million)
Table 14.North America Patient Portal Market, By Product, 2017-2025 ($Million)
Table 15.North America Patient Portal Market, By Deployment Mode, 2017-2025 ($Million)
Table 16.North America Patient Portal Market, By End User, 2017-2025 ($Million)
Table 17.U.S. Patient Portal market, by Product, 2017-2025 ($Million)
Table 18.U.S. Patient Portal market, by Deployment Mode, 2017-2025 ($Million)
Table 19.U.S. Patient Portal market, by End User, 2017-2025 ($Million)
Table 20.Canada Patient Portal Market, By Product, 2017-2025 ($Million)
Table 21.Canada Patient Portal Market, By Deployment Mode, 2017-2025 ($Million)
Table 22.Canada Patient Portal Market, By End User, 2017-2025 ($Million)
Table 23.Mexico Patient Portal Market, By Product, 2017-2025 ($Million)
Table 24.Mexico Patient Portal Market, By Deployment Mode, 2017-2025 ($Million)
Table 25.Mexico Patient Portal Market, By End User, 2017-2025 ($Million)
Table 26.Europe Patient Portal Market, By Country, 2017-2025 ($Million)
Table 27.Europe Patient Portal Market, By Product, 2017-2025 ($Million)
Table 28.Europe Patient Portal Market, By Deployment Mode, 2017-2025 ($Million)
Table 29.Europe Patient Portal Market, By End User, 2017-2025 ($Million)
Table 30.Germany Patient Portal Market, By Product, 2017-2025 ($Million)
Table 31.Germany Patient Portal Market, By Deployment Mode, 2017-2025 ($Million)
Table 32.Germany Patient Portal Market, By End User, 2017-2025 ($Million)
Table 33.France Patient Portal Market, By Product, 2017-2025 ($Million)
Table 34.France Patient Portal Market, By Deployment Mode, 2017-2025 ($Million)
Table 35.France Patient Portal Market, By End User, 2017-2025 ($Million)
Table 36.UK Patient Portal Market, By Product, 2017-2025 ($Million)
Table 37.UK Patient Portal Market, By Deployment Mode, 2017-2025 ($Million)
Table 38.UK Patient Portal Market, By End User, 2017-2025 ($Million)
Table 39.Italy Patient Portal Market, By Product, 2017-2025 ($Million)
Table 40.Italy Patient Portal Market, By Deployment Mode, 2017-2025 ($Million)
Table 41.Italy Patient Portal Market, By End User, 2017-2025 ($Million)
Table 42.Spain Patient Portal Market, By Product, 2017-2025 ($Million)
Table 43.Spain Patient Portal Market, By Deployment Mode, 2017-2025 ($Million)
Table 44.Spain Patient Portal Market, By End User, 2017-2025 ($Million)
Table 45.Russia Patient Portal Market, By Product, 2017-2025 ($Million)
Table 46.Russia Patient Portal Market, By Deployment Mode, 2017-2025 ($Million)
Table 47.Russia Patient Portal Market, By End User, 2017-2025 ($Million)
Table 48.Rest of Europe Patient Portal Market, By Product, 2017-2025 ($Million)
Table 49.Rest of Europe Patient Portal Market, By Deployment Mode, 2017-2025 ($Million)
Table 50.Rest of Europe Patient Portal Market, By End User, 2017-2025 ($Million)
Table 51.Asia-Pacific Patient Portal Market, By Country, 2017-2025 ($Million)
Table 52.Asia-Pacific Patient Portal Market, By Product, 2017-2025 ($Million)
Table 53.Asia-Pacific Patient Portal Market, By Deployment Mode, 2017-2025 ($Million)
Table 54.Asia-Pacific Patient Portal Market, By End User, 2017-2025 ($Million)
Table 55.Japan Patient Portal Market, By Product, 2017-2025 ($Million)
Table 56.Japan Patient Portal Market, By Deployment Mode, 2017-2025 ($Million)
Table 57.Japan Patient Portal Market, By End User, 2017-2025 ($Million)
Table 58.China Patient Portal Market, By Product, 2017-2025 ($Million)
Table 59.China Patient Portal Market, By Deployment Mode, 2017-2025 ($Million)
Table 60.China Patient Portal Market, By End User, 2017-2025 ($Million)
Table 61.Australia Patient Portal Market, By Product, 2017-2025 ($Million)
Table 62.Australia Patient Portal Market, By Deployment Mode, 2017-2025 ($Million)
Table 63.Australia Patient Portal Market, By End User, 2017-2025 ($Million)
Table 64.India Patient Portal Market, By Product, 2017-2025 ($Million)
Table 65.India Patient Portal Market, By Deployment Mode, 2017-2025 ($Million)
Table 66.India Patient Portal Market, By End User, 2017-2025 ($Million)
Table 67.South Korea Patient Portal Market, By Product, 2017-2025 ($Million)
Table 68.South Korea Patient Portal Market, By Deployment Mode, 2017-2025 ($Million)
Table 69.South Korea Patient Portal Market, By End User, 2017-2025 ($Million)
Table 70.Taiwan Patient Portal Market, By Product, 2017-2025 ($Million)
Table 71.Taiwan Patient Portal Market, By Deployment Mode, 2017-2025 ($Million)
Table 72.Taiwan Patient Portal Market, By End User, 2017-2025 ($Million)
Table 73.Rest of Asia-Pacific Patient Portal Market, By Product, 2017-2025 ($Million)
Table 74.Rest of Asia-Pacific Patient Portal Market, By Deployment Mode, 2017-2025 ($Million)
Table 75.Rest of Asia-Pacific Patient Portal Market, By End User, 2017-2025 ($Million)
Table 76.Rest of the World Patient Portal Market, By Country, 2017-2025 ($Million)
Table 78.Rest of the World Patient Portal Market, By Product, 2017-2025 ($Million)
Table 79.Rest of the World Patient Portal Market, By Deployment Mode, 2017-2025 ($Million)
Table 80.Rest of the World Patient Portal Market, By End User, 2017-2025 ($Million)
Table 81.Brazil Patient Portal Market, By Product, 2017-2025 ($Million)
Table 82.Brazil Patient Portal Market, By Deployment Mode, 2017-2025 ($Million)
Table 83.Brazil Patient Portal Market, By End User, 2017-2025 ($Million)
Table 84.Turkey Patient Portal Market, By Product, 2017-2025 ($Million)
Table 85.Turkey Patient Portal Market, By Deployment Mode, 2017-2025 ($Million)
Table 86.Turkey Patient Portal Market, By End User, 2017-2025 ($Million)
Table 87.Saudi Arabia Patient Portal Market, By Product, 2017-2025 ($Million)
Table 88.Saudi Arabia Patient Portal Market, By Deployment Mode, 2017-2025 ($Million)
Table 89.Saudi Arabia Patient Portal Market, By End User, 2017-2025 ($Million)
Table 90.South Africa Patient Portal Market, By Product, 2017-2025 ($Million)
Table 91.South Africa Patient Portal Market, By Deployment Mode, 2017-2025 ($Million)
Table 92.South Africa Patient Portal Market, By End User, 2017-2025 ($Million)
Table 93.United Arab Emirates Patient Portal Market, By Product, 2017-2025 ($Million)
Table 94.United Arab Emirates Patient Portal Market, By Deployment Mode, 2017-2025 ($Million)
Table 95.United Arab Emirates Patient Portal Market, By End User, 2017-2025 ($Million)
Table 96.Others Patient Portal Market, By Product, 2017-2025 ($Million)
Table 97.Others Patient Portal Market, By Deployment Mode, 2017-2025 ($Million)
Table 98.Others Patient Portal Market, By End User, 2017-2025 ($Million)
Table 99.Allscripts Healthcare, LLC: Key Strategic Developments, 2017-2017
Table 100.athenahealth, Inc.: Key Strategic Developments, 2017-2017
Table 101.McKesson Corporation: Key Strategic Developments, 2017-2017
Table 102.eClinicalWorks, LLC: Key Strategic Developments, 2017-2017
Table 103.Cerner Corporation: Key Strategic Developments, 2017-2017
Table 104.Greenway Health, LLC: Key Strategic Developments, 2017-2017
Table 105.NextGen Healthcare Information Systems: Key Strategic Developments, 2017-2017
Table 106.CureMD Healthcare: Key Strategic Developments, 2017-2017
Table 107.General Electric Company: Key Strategic Developments, 2017-2017
Table 108.Medfusion Inc.: Key Strategic Developments, 2017-2017
Table 109.Epic Systems Corporation: Key Strategic Developments, 2017-2017
Table 110.Intelichart: Key Strategic Developments, 2017-2017
List of Figures
Figure 1.Patient Portal Market Share, By Product, 2017 & 2025 ($Million)
Figure 2.Patient Portal Market, By Deployment Mode, 2017 & 2025 ($Million)
Figure 3.Patient Portal Market, By End User, 2017 & 2025 ($Million)
Figure 4.Patient Portal Market, By Region, 2017 & 2025 ($Million)
Figure 5.Allscripts Healthcare, LLC: Net Revenues, 2017-2017 ($Million)
Figure 6.Allscripts Healthcare, LLC: Net Revenue Share, By Segment, 2017
Figure 7.Allscripts Healthcare, LLC: Net Revenue Share, By Geography, 2017
Figure 8.athenahealth, Inc.: Net Revenues, 2017-2017 ($Million)
Figure 9.athenahealth, Inc.: Net Revenue Share, By Segment, 2017
Figure 10.athenahealth, Inc.: Net Revenue Share, By Geography, 2017
Figure 11.McKesson Corporation: Net Revenues, 2017-2017 ($Million)
Figure 12.McKesson Corporation: Net Revenue Share, By Segment, 2017
Figure 13. McKesson Corporation: Net Revenue Share, By Geography, 2017
Figure 14. Cerner Corporation: Net Revenues, 2017-2017 ($Million)
Figure 15. Cerner Corporation: Net Revenue Share, By Segment, 2017
Figure 16. Cerner Corporation: Net Revenue Share, By Geography, 2017
Figure 17.Quality systems, Inc.: Net Revenues, 2017-2017 ($Million)
Figure 18.Quality systems, Inc.: Net Revenue Share, By Segment, 2017
Figure 19.Quality systems, Inc.: Net Revenue Share, By Geography, 2017
Figure 20.General Electric Company: Net Revenues, 2017-2017 ($Million)
Figure 21.General Electric Company: Net Revenue Share, By Segment, 2017
Figure 22.General Electric Company: Net Revenue Share, By Geography, 2017
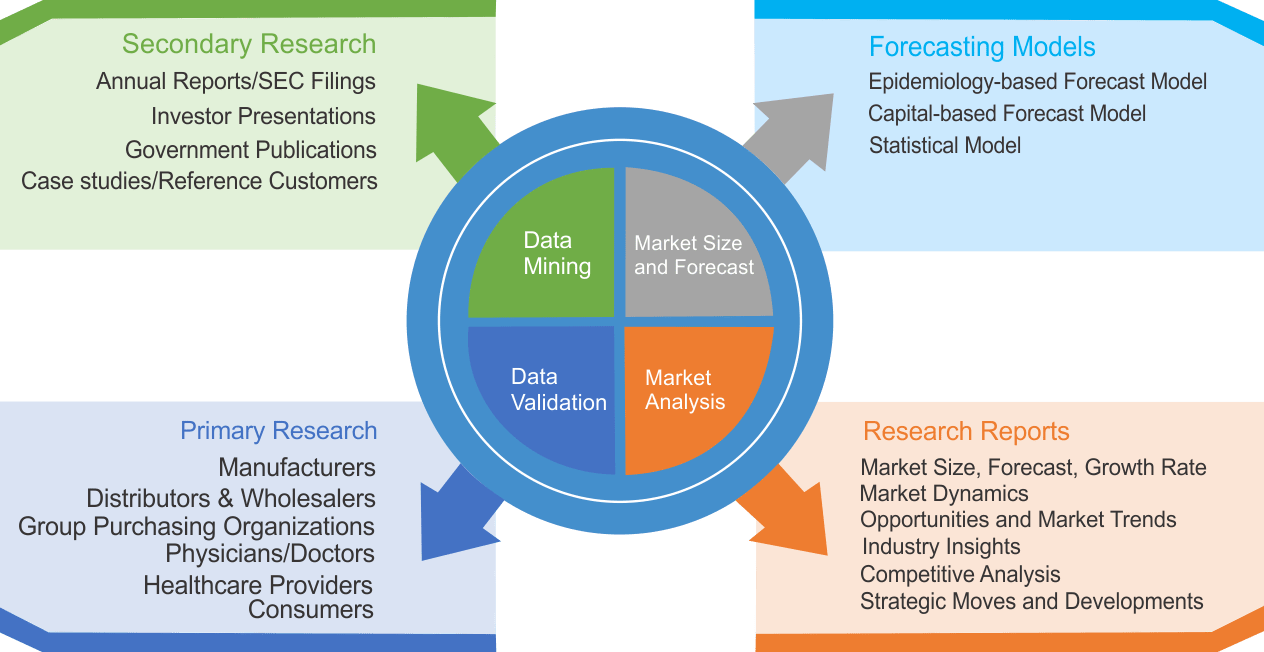
Research Methodology
We use both primary as well as secondary research for our market surveys, estimates and for developing forecast. Our research process commence by analyzing the problem which enable us to design the scope for our research study. Our research process is uniquely designed with enough flexibility to adjust according to changing nature of products and markets, while retaining core element to ensure reliability and accuracy in research findings. We understand both macro and micro-economic factors to evaluate and forecast different market segments.
Data Mining
Data is extensively collected through various secondary sources such as annual reports, investor presentations, SEC filings, and other corporate publications. We also refer trade magazines, technical journals, paid databases such as Factiva and Bloomberg, industry trade journals, scientific journals, and social media data to understand market dynamics and industry trends. Further, we also conduct primary research to understand market drivers, restraints, opportunities, challenges, and competitive scenario to build our analysis.
Data Collection Matrix
|
Data Collection Matrix |
Supply Side |
Demand Side |
|
Primary Data Sources |
|
|
|
Secondary Data Sources |
|
|
Market Modeling and Forecasting
We use epidemiology and capital equipment-based models to forecast market size of different segments at country and regional level.
- Epidemiology-based Forecasting Model: This method uses epidemiology data gathered through various publications and from physicians to estimate population of patients, flow of treatment of individual disease and therapies. The data collected through this method includes statics on incidence of disease, population suffering from disease, and treatment population. This method is used to understand:
- Number of patients for particular device or medical procedure and
- Repeated use of particular device depending on health and condition of patient
- Capital-based Forecasting Model: This method of forecasting is based on number of replacements, installed-based and new sales of capital equipment used in various healthcare and diagnostic centers. These three parameters are calculated and forecast is developed. Installation base is calculated as average number of units per facility; while sales for particular year is calculated from number of new and replace units. Secondary data is collected through various supply chain intermediaries and opinion leaders to arrive at installation and sales rate. These techniques help our analysts in validating market and developed market estimates and forecast.
We do forecast on basis of several parameters such as market drivers, market opportunities, industry trends government regulations, raw materials supply and trade dynamics to ensure relevance of forecast with market scenario. With increasing need to granulized information, we used bottom-up methodology for forecasting where we evaluate each regional segment differently and combined all forecast to develop final market forecast.
Data Validation
We believe primary research is a very important tool in analyzing and forecasting different markets. In order to make sure accuracy of our findings, our team conducts primary interviews at every stage of research to gain deep insights into current business environment and future trends and key developments in market. This includes use of various methods such as telephonic interviews, focus groups, face to face interviews and questionnaires to validate our research from all aspects. We validate our data through primary research from key industry leaders such as CEO, product managers, marketing managers, suppliers, distributors, and consumers are frequently interviewed. These interviews provide valuable insights which help us to have better market understanding besides validating our estimates and forecast.
Data Triangulation
Industry Analysis
|
Qualitative Data |
Quantitative Data (2017-2025) |
|
|