.png)
Portable Oxygen Concentrators Market by Product and End User - Global Industry Analysis and Forecast to 2027
Published On : September 2017 Pages : 98 Category: Medical Devices Report Code : HC09206
SEGMENTS & REGIONS:
- Regions: North America, Europe, Asia- Pacific, Latin America, Middle East & Africa
Industry Trend Analysis
The global portable oxygen concentrators market is expected to be around $1 billion by 2027. Some of the major factors driving the market growth are high prevalence of severe obstructive pulmonary diseases, favorable government initiatives and convenience of usage. Increasing geriatric population is also expected to favorably contribute to the growth of this market during the forecast period as older adults are more susceptible to respiratory infections such as pulmonary hypertension, COPD and asthma. According to the 2017 World Aging Population report by the UN, between 2017 and 2030, the global population aged 60 years and over is expected to grow by % from 901 million to 1.4 billion. This number is projected to rise up to 2.1 billion by 2050. With such significant increase in older population, the demand for portable oxygen concentrators is expected to significantly increase during the forecast period. However, factors such as stringent approval process for portable oxygen concentrators laid by agencies such as FDA can hamper the market growth during the forecast period.
Product Outlook and Trend Analysis
Pulse flow portable oxygen concentrators segment held a major share of the overall market in 2017 owing to the convenience of controlled oxygen delivery as compared to a continuous flow oxygen concentrator. It pulses air into the breather’s nasal passage way with each breath through a cannula. Continuous flow oxygen concentrator continuously delivers oxygen at a specific and steady rate.
End User Outlook and Trend Analysis
Homecare segment dominated the portable oxygen concentrators market holding a major market share in 2017 due to increasing prevalence of geriatric population around the world who prefer homecare settings instead of a hospital setting. Moreover, favorable reimbursement policies for portable oxygen concentrators for homecare will further boost the growth of this segment over the forecast period.
Regional Outlook and Trend Analysis
North America dominated the global portable oxygen concentrators market in 2017 due to high prevalence chronic respiratory disorders and technological advancements resulting in development and commercialization of advanced oxygen concentrator systems. Asia-Pacific portable oxygen concentrators market is expected to witness fastest growth over the forecast period owing to increasing prevalence of geriatric population in the region and increased disposable income in emerging countries such as China and India making homecare oxygen concentrators affordable for the patients.
Competitive Analysis
The major players operating in the global portable oxygen concentrators market emphasize on product development and innovation to introduce advanced solutions in the market and secure a competitive advantage over other market players. For instance, in May 2017, Inogen, Inc., a provider of respiratory products for homecare settings launched the ultra-portable Inogen One G4 portable oxygen concentrator. In July 2017, the company received permission to allow the Inogen One G4 to be used onboard commercial aircrafts. Some of the key players operating in this market are, Precision Medical, Inc., Invacare Corporation, Medical Depot, Inc. dba Drive DeVilbiss Healthcare, Inogen, Inc., Chart Industries, Inc., Koninklijke Philips N.V., O2 Concepts, LLC., GCE Group, Nidek Medical Products, Inc., Inova Labs, Inc. (a part of ResMed Inc.), Teijin Limited, Besco Medical Co., LTD. and Oxus America.
Market Opportunities
Technological advancements in treating COPD and asthma will boost the growth of global portable oxygen concentrators market in coming years. Development of easy to use oxygen concentrators that are convenient to be carried around will favorably increase the demand for portable concentrators over the forecast period.
Portable Oxygen Concentrators Market Segmentation:
By Product:
- Pulse Flow Portable Oxygen Concentrators
- Continuous Flow Portable Oxygen Concentrators
By End User:
- Homecare
- Travel Agents
- Hospitals
- Ambulatory Surgical Centers
By Region:
- North America
- U.S
- Canada
- Mexico
- Europe
- Germany
- France
- UK
- Italy
- Spain
- Rest of Europe
- Asia-Pacific
- Japan
- China
- Australia
- India
- South Korea
- Rest of Asia-Pacific
- Rest of the World
- Brazil
- South Africa
- Saudi Arabia
- Turkey
- United Arab Emirates
- Others
Some of the key questions answered by the report are:
- What was the market size in 2017 and forecast from 2022 to 2027?
- What will be the industry market growth from 2022 to 2027?
- What are the major drivers, restraints, opportunities, challenges, and industry trends and their impact on the market forecast?
- What are the major segments leading the market growth and why?
- Which are the leading players in the market and what are the major strategies adopted by them to sustain the market competition?
Market Classification
- Portable Oxygen Concentrators Market, By Product, Estimates and Forecast, 2017-2027 ($Million)
- Pulse Flow Portable Oxygen Concentrators
- Continuous Flow Portable Oxygen Concentrators
- Portable Oxygen Concentrators Market, By End User, Estimates and Forecast, 2017-2027 ($Million)
- Homecare
- Travel Agents
- Hospitals
- Ambulatory Surgical Centers
- Portable Oxygen Concentrators Market, By Region, Estimates and Forecast, 2017-2027 ($Million)
- North America
- North America Portable Oxygen Concentrators Market, By Country
- North America Portable Oxygen Concentrators Market, By Product
- North America Portable Oxygen Concentrators Market, By End User
- U.S. Portable Oxygen Concentrators Market, By Product
- U.S. Portable Oxygen Concentrators Market, By End User
- Canada Portable Oxygen Concentrators Market, By Product
- Canada Portable Oxygen Concentrators Market, By End User
- Mexico Portable Oxygen Concentrators Market, By Product
- Mexico Portable Oxygen Concentrators Market, By End User
-
- Europe
- Europe Portable Oxygen Concentrators Market, By Country
- Europe Portable Oxygen Concentrators Market, By Product
- Europe Portable Oxygen Concentrators Market, By End User
- Germany Portable Oxygen Concentrators Market, By Product
- Germany Portable Oxygen Concentrators Market, By End User
- France Portable Oxygen Concentrators Market, By Product
- France Portable Oxygen Concentrators Market, By End User
- UK Portable Oxygen Concentrators Market, By Product
- UK Portable Oxygen Concentrators Market, By End User
- Italy Portable Oxygen Concentrators Market, By Product
- Italy Portable Oxygen Concentrators Market, By End User
- Spain Portable Oxygen Concentrators Market, By Product
- Spain Portable Oxygen Concentrators Market, By End User
- Rest of Europe Portable Oxygen Concentrators Market, By Product
- Rest of Europe Portable Oxygen Concentrators Market, By End User
-
- Asia-Pacific
- Asia-Pacific Portable Oxygen Concentrators Market, By Country
- Asia-Pacific Portable Oxygen Concentrators Market, By Product
- Asia-Pacific Portable Oxygen Concentrators Market, By End User
- Japan Portable Oxygen Concentrators Market, By Product
- Japan Portable Oxygen Concentrators Market, By End User
- Australia Portable Oxygen Concentrators Market, By Product
- Australia Portable Oxygen Concentrators Market, By End User
- India Portable Oxygen Concentrators Market, By Product
- India Portable Oxygen Concentrators Market, By End User
- South Korea Portable Oxygen Concentrators Market, By Product
- South Korea Portable Oxygen Concentrators Market, By End User
- Rest of Asia-Pacific Portable Oxygen Concentrators Market, By Product
- Rest of Asia-Pacific Portable Oxygen Concentrators Market, By End User
- Asia-Pacific
-
- Rest of the World
- Rest of the World Portable Oxygen Concentrators Market, By Country
- Rest of the World Portable Oxygen Concentrators Market, By Product
- Rest of the World Portable Oxygen Concentrators Market, By End User
- Brazil Portable Oxygen Concentrators Market, By Product
- Brazil Portable Oxygen Concentrators Market, By End User
- South Africa Portable Oxygen Concentrators Market, By Product
- South Africa Portable Oxygen Concentrators Market, By End User
- Saudi Arabia Portable Oxygen Concentrators Market, By Product
- Saudi Arabia Portable Oxygen Concentrators Market, By End User
- Turkey Portable Oxygen Concentrators Market, By Product
- Turkey Portable Oxygen Concentrators Market, By End User
- United Arab Emirates Portable Oxygen Concentrators Market, By Product
- United Arab Emirates Portable Oxygen Concentrators Market, By End User
- Others Portable Oxygen Concentrators Market, By Product
- Others Portable Oxygen Concentrators Market, By End User
- Rest of the World
Table of Contents
1.Introduction
1.1.Report Description
1.2.Research Methodology
1.2.1. Secondary Research
1.2.2. Primary Research
2.Executive Summary
2.1.Key Highlights
3.Market Overview
3.1.Introduction
3.1.1. Market Definition
3.1.2. Market Segmentation
3.2.Market Share Analysis
3.3.Market Dynamics
3.3.1. Drivers
3.3.1.1.Increasing Incidence of COPD and Asthma Worldwide
3.3.1.2.Rising Geriatric Population Globally
3.3.1.3.Technological Advancements in Portable Oxygen Concentrators
3.3.2. Restraints
3.3.2.1.Stringent Regulatory Guidelines for Use and Disposal of these Systems
3.3.3. Opportunities
3.3.3.1.Emerging Markets to Offer Lucrative Growth Opportunities
3.4.Industry Trends
4.Portable Oxygen Concentrators Market, By Product
4.1.Introduction
4.2.Portable Oxygen Concentrators Market Assessment and Forecast, By Product, 2017-2027
4.3.Pulse Flow Portable Oxygen Concentrators
4.3.1. Market Assessment and Forecast, By Region, 2017-2027 ($Million)
4.4.Continuous Flow Portable Oxygen Concentrators
4.4.1. Market Assessment and Forecast, By Region, 2017-2027 ($Million)
5.Portable Oxygen Concentrators Market, By End User
5.1.Introduction
5.2.The Portable Oxygen Concentrators Market Assessment and Forecast, By End User, 2017-2027
5.3.Homecare
5.3.1.1.Market Assessment and Forecast, By Region, 2017-2027 ($Million)
5.4.Travel Agents
5.4.1.1.Market Assessment and Forecast, By Region, 2017-2027 ($Million)
5.5.Hospitals
5.5.1.1.Market Assessment and Forecast, By Region, 2017-2027 ($Million)
5.6.AmbulatorySurgical Centers
5.6.1.1.Market Assessment and Forecast, By Region, 2017-2027 ($Million)
6.Portable Oxygen Concentrators Market, By Region
6.1.Introduction
6.2.Portable Oxygen Concentrators Market Assessment and Forecast, By Region, 2017-2027 ($Million)
6.3.North America
6.3.1. Market Assessment and Forecast, By Country, 2017-2027 ($Million)
6.3.2. Market Assessment and Forecast, By Product, 2017-2027 ($Million)
6.3.3. Market Assessment and Forecast, By End User, 2017-2027 ($Million)
6.3.3.1.U.S.
6.3.3.1.1.Market Assessment and Forecast, By Product, 2017-2027 ($Million)
6.3.3.1.2.Market Assessment and Forecast, By End User, 2017-2027 ($Million)
6.3.3.2.Canada
6.3.3.2.1.Market Assessment and Forecast, By Product, 2017-2027 ($Million)
6.3.3.2.2.Market Assessment and Forecast, By End User, 2017-2027 ($Million)
6.3.3.3.Mexico
6.3.3.3.1.Market Assessment and Forecast, By Product, 2017-2027 ($Million)
6.3.3.3.2.Market Assessment and Forecast, By End User, 2017-2027 ($Million)
6.4.Europe
6.4.1. Market Assessment and Forecast, By Country, 2017-2027 ($Million)
6.4.2. Market Assessment and Forecast, By Product, 2017-2027 ($Million)
6.4.3. Market Assessment and Forecast, By End User, 2017-2027 ($Million)
6.4.3.1.Germany
6.4.3.1.1.Market Assessment and Forecast, By Product, 2017-2027 ($Million)
6.4.3.1.2.Market Assessment and Forecast, By End User, 2017-2027 ($Million)
6.4.3.2.France
6.4.3.2.1.Market Assessment and Forecast, By Product, 2017-2027 ($Million)
6.4.3.2.2.Market Assessment and Forecast, By Product, 2017-2027 ($Million)
6.4.3.3.UK
6.4.3.3.1.Market Assessment and Forecast, By Product, 2017-2027 ($Million)
6.4.3.3.2.Market Assessment and Forecast, By End User, 2017-2027 ($Million)
6.4.3.4.Italy
6.4.3.4.1.Market Assessment and Forecast, By Product, 2017-2027 ($Million)
6.4.3.4.2.Market Assessment and Forecast, By End User, 2017-2027 ($Million)
6.4.3.5.Spain
6.4.3.5.1.Market Assessment and Forecast, By Product, 2017-2027 ($Million)
6.4.3.5.2.Market Assessment and Forecast, By End User, 2017-2027 ($Million)
6.4.3.6.Russia
6.4.3.6.1.Market Assessment and Forecast, By Product, 2017-2027 ($Million)
6.4.3.6.2.Market Assessment and Forecast, By End User, 2017-2027 ($Million)
6.4.3.7.Rest of Europe
6.4.3.7.1.Market Assessment and Forecast, By Product, 2017-2027 ($Million)
6.4.3.7.2.Market Assessment and Forecast, By End User, 2017-2027 ($Million)
6.5.Asia-Pacific
6.5.1. Market Assessment and Forecast, By Country, 2017-2027 ($Million)
6.5.2. Market Assessment and Forecast, By Product, 2017-2027 ($Million)
6.5.3. Market Assessment and Forecast, By End User, 2017-2027 ($Million)
6.5.3.1.Japan
6.5.3.1.1.Market Assessment and Forecast, By Product, 2017-2027 ($Million)
6.5.3.1.2.Market Assessment and Forecast, By End User, 2017-2027 ($Million)
6.5.3.2.China
6.5.3.2.1.Market Assessment and Forecast, By Product, 2017-2027 ($Million)
6.5.3.2.2.Market Assessment and Forecast, By End User, 2017-2027 ($Million)
6.5.3.3.Australia
6.5.3.3.1.Market Assessment and Forecast, By Product, 2017-2027 ($Million)
6.5.3.3.2.Market Assessment and Forecast, By End User, 2017-2027 ($Million)
6.5.3.4.India
6.5.3.4.1.Market Assessment and Forecast, By Product, 2017-2027 ($Million)
6.5.3.4.2.Market Assessment and Forecast, By End User, 2017-2027 ($Million)
6.5.3.5.South Korea
6.5.3.5.1.Market Assessment and Forecast, By Product, 2017-2027 ($Million)
6.5.3.5.2.Market Assessment and Forecast, By End User, 2017-2027 ($Million)
6.5.3.6.Taiwan
6.5.3.6.1.Market Assessment and Forecast, By Product, 2017-2027 ($Million)
6.5.3.6.2.Market Assessment and Forecast, By End User, 2017-2027 ($Million)
6.5.3.7.Rest of Asia-Pacific
6.5.3.7.1.Market Assessment and Forecast, By Product, 2017-2027 ($Million)
6.5.3.7.2.Market Assessment and Forecast, By End User, 2017-2027 ($Million)
6.6.Rest of the World
6.6.1. Market Assessment and Forecast, By Country, 2017-2027 ($Million)
6.6.2. Market Assessment and Forecast, By Product, 2017-2027 ($Million)
6.6.3. Market Assessment and Forecast, By End User, 2017-2027 ($Million)
6.6.3.1.Brazil
6.6.3.1.1.Market Assessment and Forecast, By Product, 2017-2027 ($Million)
6.6.3.1.2.Market Assessment and Forecast, By End User, 2017-2027 ($Million)
6.6.3.2.Turkey
6.6.3.2.1.Market Assessment and Forecast, By Product, 2017-2027 ($Million)
6.6.3.2.2.Market Assessment and Forecast, By End User, 2017-2027 ($Million)
6.6.3.3.Saudi Arabia
6.6.3.3.1.Market Assessment and Forecast, By Product, 2017-2027 ($Million)
6.6.3.3.2.Market Assessment and Forecast, By End User, 2017-2027 ($Million)
6.6.3.4.South Africa
6.6.3.4.1.Market Assessment and Forecast, By Product, 2017-2027 ($Million)
6.6.3.4.2.Market Assessment and Forecast, By End User, 2017-2027 ($Million)
6.6.3.5.United Arab Emirates
6.6.3.5.1.Market Assessment and Forecast, By Product, 2017-2027 ($Million)
6.6.3.5.2.Market Assessment and Forecast, By End User, 2017-2027 ($Million)
6.6.3.6.Others
6.6.3.6.1.Market Assessment and Forecast, By Product, 2017-2027 ($Million)
6.6.3.6.2.Market Assessment and Forecast, By End User, 2017-2027 ($Million)
7.Company Profiles
7.1.Precision Medical, Inc.
7.1.1. Business Overview
7.1.2. Product Portfolio
7.1.3. Strategic Developments
7.2.Invacare Corporation
7.2.1. Business Overview
7.2.2. Product Portfolio
7.2.3. Key Financials
7.2.4. Strategic Developments
7.3.Drive DeVilbiss Healthcare
7.3.1. Business Overview
7.3.2. Product Portfolio
7.3.3. Strategic Developments
7.4.Inogen, Inc.
7.4.1. Business Overview
7.4.2. Product Portfolio
7.4.3. Key Financials
7.4.4. Strategic Developments
7.5.Chart Industries, Inc.
7.5.1. Business Overview
7.5.2. Product Portfolio
7.5.3. Key Financials
7.5.4. Strategic Developments
7.6.Koninklijke Philips N.V.
7.6.1. Business Overview
7.6.2. Product Portfolio
7.6.3. Key Financials
7.6.4. Strategic Developments
7.7.O2 Concepts, LLC.
7.7.1. Business Overview
7.7.2. Product Portfolio
7.7.3. Key Financials
7.7.4. Strategic Developments
7.8.GCE Group
7.8.1. Business Overview
7.8.2. Product Portfolio
7.8.3. Strategic Developments
7.9.Nidek Medical Products, Inc.
7.9.1. Business Overview
7.9.2. Product Portfolio
7.9.3. Strategic Developments
7.10.Inova Labs, Inc.
7.10.1.Business Overview
7.10.2.Product Portfolio
7.10.3.Key Financials
7.10.4.Strategic Developments
7.11.Teijin Limited
7.11.1.Business Overview
7.11.2.Product Portfolio
7.11.3.Key Financials
7.11.4.Strategic Developments
7.12.Besco Medical Co.,LTD.
7.12.1.Business Overview
7.12.2.Product Portfolio
7.12.3.Strategic Developments
7.13.Oxus America
7.13.1.Business Overview
7.13.2.Product Portfolio
7.13.3.Strategic Developments
List of Tables
Table 1.Global Portable Oxygen Concentrators Market, By Product ($Million), 2017-2025
Table 2.Pulse Flow Portable Oxygen Concentrators Market, By Region ($Million), 2017-2025
Table 3.Continuous Flow Portable Oxygen Concentrators Market, By Region ($Million), 2017-2025
Table 4.Global Portable Oxygen Concentrators Market, By End User ($Million), 2017-2025
Table 5.Homecare Market, By Region ($Million), 2017-2025
Table 6.Travel Agents Market, By Region ($Million), 2017-2025
Table 7.Hospitals Market, By Region ($Million), 2017-2025
Table 8.Ambulatory Surgical Centers Market, By Region ($Million), 2017-2025
Table 9.Portable Oxygen Concentrators Market, By Region ($Million), 2017-2025
Table10.North America Portable Oxygen Concentrators Market, By Country, 2017-2025 ($Million)
Table11.North America Portable Oxygen Concentrators Market, By Product, 2017-2025 ($Million)
Table 12.North America Portable Oxygen Concentrators Market, By End User, 2017-2025 ($Million)
Table 13.U.S. Portable Oxygen Concentrators Market, by Product, 2017-2025 ($Million)
Table 14.U.S. Portable Oxygen Concentrators Market, by End User, 2017-2025 ($Million)
Table 15.Canada Portable Oxygen Concentrators Market, By Product, 2017-2025 ($Million)
Table 16.Canada Portable Oxygen Concentrators Market, By End User, 2017-2025 ($Million)
Table 17.Mexico Portable Oxygen Concentrators Market, By Product, 2017-2025 ($Million)
Table 18.Mexico Portable Oxygen Concentrators Market, By End User, 2017-2025 ($Million)
Table 19.Europe Portable Oxygen Concentrators Market, By Country, 2017-2025 ($Million)
Table 20.Europe Portable Oxygen Concentrators Market, By Product, 2017-2025 ($Million)
Table 21.Europe Portable Oxygen Concentrators Market, By End User, 2017-2025 ($Million)
Table 22.Germany Portable Oxygen Concentrators Market, By Product, 2017-2025 ($Million)
Table 23.Germany Portable Oxygen Concentrators Market, By End User, 2017-2025 ($Million)
Table 24.France Portable Oxygen Concentrators Market, By Product, 2017-2025 ($Million)
Table 25.France Portable Oxygen Concentrators Market, By End User, 2017-2025 ($Million)
Table 26.UK Portable Oxygen Concentrators Market, By Product, 2017-2025 ($Million)
Table 27.UK Portable Oxygen Concentrators Market, By End User, 2017-2025 ($Million)
Table 28.Italy Portable Oxygen Concentrators Market, By Product, 2017-2025 ($Million)
Table 29.Italy Portable Oxygen Concentrators Market, By End User, 2017-2025 ($Million)
Table 30.Spain Portable Oxygen Concentrators Market, By Product, 2017-2025 ($Million)
Table 31.Spain Portable Oxygen Concentrators Market, By End User, 2017-2025 ($Million)
Table 32.Russia Portable Oxygen Concentrators Market, By Product, 2017-2025 ($Million)
Table 33.Russia Portable Oxygen Concentrators Market, By End User, 2017-2025 ($Million)
Table 34.Rest of Europe Portable Oxygen Concentrators Market, By Product, 2017-2025 ($Million)
Table 35.Rest of Europe Portable Oxygen Concentrators Market, By End User, 2017-2025 ($Million)
Table 36.Asia-Pacific Portable Oxygen Concentrators Market, By Country, 2017-2025 ($Million)
Table 37.Asia-Pacific Portable Oxygen Concentrators Market, By Product, 2017-2025 ($Million)
Table 38.Asia-Pacific Portable Oxygen Concentrators Market, By End User, 2017-2025 ($Million)
Table 39.Japan Portable Oxygen Concentrators Market, By Product, 2017-2025 ($Million)
Table 40.Japan Portable Oxygen Concentrators Market, By End User, 2017-2025 ($Million)
Table 41.China Portable Oxygen Concentrators Market, By Product, 2017-2025 ($Million)
Table 42.China Portable Oxygen Concentrators Market, By End User, 2017-2025 ($Million)
Table 43.Australia Portable Oxygen Concentrators Market, By Product, 2017-2025 ($Million)
Table 44.Australia Portable Oxygen Concentrators Market, By End User, 2017-2025 ($Million)
Table 45.India Portable Oxygen Concentrators Market, By Product, 2017-2025 ($Million)
Table 46.India Portable Oxygen Concentrators Market, By End User, 2017-2025 ($Million)
Table 47.South Korea Portable Oxygen Concentrators Market, By Product, 2017-2025 ($Million)
Table 48.South Korea Portable Oxygen Concentrators Market, By End User, 2017-2025 ($Million)
Table 49.Taiwan Portable Oxygen Concentrators Market, By Product, 2017-2025 ($Million)
Table 50.Taiwan Portable Oxygen Concentrators Market, By End User, 2017-2025 ($Million)
Table 51.Rest of Asia-Pacific Portable Oxygen Concentrators Market, By Product, 2017-2025 ($Million)
Table 52.Rest of Asia-Pacific Portable Oxygen Concentrators Market, By End User, 2017-2025 ($Million)
Table 53.Rest of the World Portable Oxygen Concentrators Market, By Country, 2017-2025 ($Million)
Table 54.Rest of the World Portable Oxygen Concentrators Market, By Product, 2017-2025 ($Million)
Table 55.Rest of the World Portable Oxygen Concentrators Market, By End User, 2017-2025 ($Million)
Table 56.Brazil Portable Oxygen Concentrators Market, By Product, 2017-2025 ($Million)
Table 57.Brazil Portable Oxygen Concentrators Market, By End User, 2017-2025 ($Million)
Table 58.Turkey Portable Oxygen Concentrators Market, By Product, 2017-2025 ($Million)
Table 59.Turkey Portable Oxygen Concentrators Market, By End User, 2017-2025 ($Million)
Table 60.Saudi Arabia Portable Oxygen Concentrators Market, By Product, 2017-2025 ($Million)
Table 61.Saudi Arabia Portable Oxygen Concentrators Market, By End User, 2017-2025 ($Million)
Table 62.South Africa Portable Oxygen Concentrators Market, By Product, 2017-2025 ($Million)
Table 63.South Africa Portable Oxygen Concentrators Market, By End User, 2017-2025 ($Million)
Table 64.United Arab Emirates Portable Oxygen Concentrators Market, By Product, 2017-2025 ($Million)
Table 65.United Arab Emirates Portable Oxygen Concentrators Market, By End User, 2017-2025 ($Million)
Table 66.Others Portable Oxygen Concentrators Market, By Product, 2017-2025 ($Million)
Table 67.Others Portable Oxygen Concentrators Market, By End User, 2017-2025 ($Million)
Table 68.Precision Medical, Inc.: Key Strategic Developments, 2017-2017
Table 69.Invacare Corporation: Key Strategic Developments, 2017-2017
Table 70.Medical Depot, Inc. dba Drive DeVilbiss Healthcare: Key Strategic Developments, 2017-2017
Table 71.Inogen, Inc.: Key Strategic Developments, 2017-2017
Table 72.Chart Industries, Inc.: Key Strategic Developments, 2017-2017
Table 73.Koninklijke Philips N.V.: Key Strategic Developments, 2017-2017
Table 74.O2 Concepts, LLC.: Key Strategic Developments, 2017-2017
Table 75.GCE Group: Key Strategic Developments, 2017-2017
Table 76.Nidek Medical Products, Inc.: Key Strategic Developments, 2017-2017
Table 77.Inova Labs, Inc. (a part of ResMed Inc.): Key Strategic Developments, 2017-2017
Table 78.Teijin Limited: Key Strategic Developments, 2017-2017
Table 79.Besco Medical Co.,LTD.: Key Strategic Developments, 2017-2017
Table 80.Oxus America: Key Strategic Developments, 2017-2017
List of Figures
Figure 1.Global Portable Oxygen Concentrators Market Share, By Product, 2017 & 2025
Figure 2.Portable Oxygen Concentrators Market, By End User, 2017, ($Million)
Figure 3.Portable Oxygen Concentrators Market, By Region, 2017, ($Million)
Figure 4.Invacare Corporation: Net Revenues, 2017-2017 ($Million)
Figure 5.Invacare Corporation: Net Revenue Share, By Segment, 2017
Figure 6.Invacare Corporation: Net Revenue Share, By Geography, 2017
Figure 7.Inogen, Inc.: Net Revenues, 2017-2017 ($Million)
Figure 8.Inogen, Inc.: Net Revenue Share, By Segment, 2017
Figure 9.Inogen, Inc.: Net Revenue Share, By Geography, 2017
Figure 10.Chart Industries, Inc.: Net Revenues, 2017-2017 ($Million)
Figure 11.Chart Industries, Inc.: Net Revenue Share, By Segment, 2017
Figure 12.Chart Industries, Inc.: Net Revenue Share, By Geography, 2017
Figure 13.Koninklijke Philips N.V.: Net Revenues, 2017-2017 ($Million)
Figure 14.Koninklijke Philips N.V.: Net Revenue Share, By Segment, 2017
Figure 15.Koninklijke Philips N.V.: Net Revenue Share, By Geography, 2017
Figure 16.O2 Concepts, LLC.: Net Revenues, 2017-2017 ($Million)
Figure 17.O2 Concepts, LLC.: Net Revenue Share, By Segment, 2017
Figure 18.O2 Concepts, LLC.: Net Revenue Share, By Geography, 2017
Figure 19.Inova Labs, Inc. (a part of ResMed Inc.): Net Revenues, 2017-2017 ($Million)
Figure 20.Inova Labs, Inc. (a part of ResMed Inc.): Net Revenue Share, By Segment, 2017
Figure 21.Inova Labs, Inc. (a part of ResMed Inc.): Net Revenue Share, By Geography, 2017
Figure 22. Teijin Limited: Net Revenues, 2017-2017 ($Million)
Figure 23. Teijin Limited: Net Revenue Share, By Segment, 2017
Figure 24. Teijin Limited: Net Revenue Share, By Geography, 2017
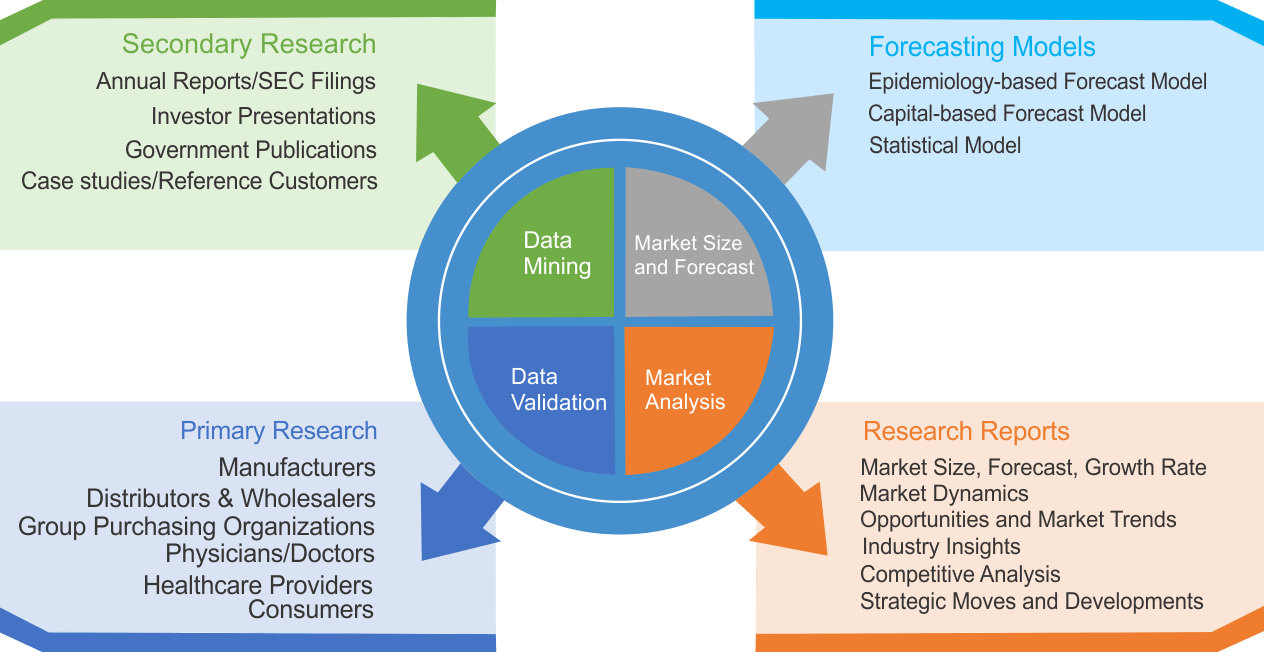
Research Methodology
We use both primary as well as secondary research for our market surveys, estimates and for developing forecast. Our research process commence by analyzing the problem which enable us to design the scope for our research study. Our research process is uniquely designed with enough flexibility to adjust according to changing nature of products and markets, while retaining core element to ensure reliability and accuracy in research findings. We understand both macro and micro-economic factors to evaluate and forecast different market segments.
Data Mining
Data is extensively collected through various secondary sources such as annual reports, investor presentations, SEC filings, and other corporate publications. We also refer trade magazines, technical journals, paid databases such as Factiva and Bloomberg, industry trade journals, scientific journals, and social media data to understand market dynamics and industry trends. Further, we also conduct primary research to understand market drivers, restraints, opportunities, challenges, and competitive scenario to build our analysis.
Data Collection Matrix
|
Data Collection Matrix |
Supply Side |
Demand Side |
|
Primary Data Sources |
|
|
|
Secondary Data Sources |
|
|
Market Modeling and Forecasting
We use epidemiology and capital equipment-based models to forecast market size of different segments at country and regional level.
- Epidemiology-based Forecasting Model: This method uses epidemiology data gathered through various publications and from physicians to estimate population of patients, flow of treatment of individual disease and therapies. The data collected through this method includes statics on incidence of disease, population suffering from disease, and treatment population. This method is used to understand:
- Number of patients for particular device or medical procedure and
- Repeated use of particular device depending on health and condition of patient
- Capital-based Forecasting Model: This method of forecasting is based on number of replacements, installed-based and new sales of capital equipment used in various healthcare and diagnostic centers. These three parameters are calculated and forecast is developed. Installation base is calculated as average number of units per facility; while sales for particular year is calculated from number of new and replace units. Secondary data is collected through various supply chain intermediaries and opinion leaders to arrive at installation and sales rate. These techniques help our analysts in validating market and developed market estimates and forecast.
We do forecast on basis of several parameters such as market drivers, market opportunities, industry trends government regulations, raw materials supply and trade dynamics to ensure relevance of forecast with market scenario. With increasing need to granulized information, we used bottom-up methodology for forecasting where we evaluate each regional segment differently and combined all forecast to develop final market forecast.
Data Validation
We believe primary research is a very important tool in analyzing and forecasting different markets. In order to make sure accuracy of our findings, our team conducts primary interviews at every stage of research to gain deep insights into current business environment and future trends and key developments in market. This includes use of various methods such as telephonic interviews, focus groups, face to face interviews and questionnaires to validate our research from all aspects. We validate our data through primary research from key industry leaders such as CEO, product managers, marketing managers, suppliers, distributors, and consumers are frequently interviewed. These interviews provide valuable insights which help us to have better market understanding besides validating our estimates and forecast.
Data Triangulation
Industry Analysis
|
Qualitative Data |
Quantitative Data (2017-2025) |
|
|