.png)
Personal Mobility Devices Market by Product - Global Industry Analysis and Forecast to 2022
Published On : November 2017 Pages : 85 Category: Medical Devices Report Code : HC11357
SEGMENTS & REGIONS:
- Regions: North America, Europe, Asia- Pacific, Latin America, Middle East & Africa
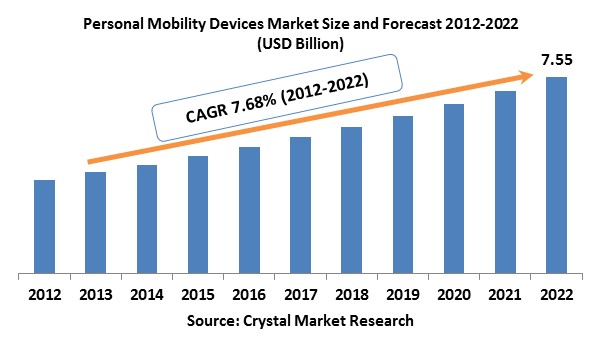
Industry Trend Analysis
In 2017, the global personal mobility devices market was evaluated around USD billion and is expected to reach approximately USD billion by 2022 while registering itself at a compound annual growth rate (CAGR) of % over the forecast period owing to the factors like growing geriatric population worldwide, the occurrence rate of target illnesses and encouraging governmental initiatives. With the introduction of technologically sophisticated personal mobility devices like laser enabled rollators and Segway Personal Transporter by TOPRO, personal mobility devices industry are anticipated to witness growth during the next few years. Aging is counted as the highest risk factor impacting personal mobility because of old age is anticipated to intensify the susceptibility of an individual towards emerging target illnesses like osteoporosis and rheumatoid arthritis thus growing the requirement for support through personal mobility devices. People above the age of 60 years are also more prone to be impacted by motion impairing disorders like Dystonia, spasticity (spinal cord injury, cerebral palsy, and multiple sclerosis), and Parkinson’s disease. The advent of encouraging government initiatives like the Older Americans Act and Affordable Care Act the in the United States, the formation of China Rehabilitation Research Center (CRRC) and Disability Tax Credit Certificate in Canada are further anticipated to drive the personal mobility devices market growth over the projected period.
Product Outlook and Trend Analysis
The global personal mobility devices market is anticipated by examining three key categories which are walking aid, wheelchairs, and scooters. Wheelchairs are the most frequently utilized personal mobility devices rendering support to the geriatric and disabled population. It enhances the easiness of doing fundamental functions thus, improving the quality of life. The wheelchairs demand is anticipated to grow at a considerable rate over the projected period owing to a rapidly growing geriatric population worldwide. In 2017, powered wheelchairs appear as the major product sub-segment due to rapidly rising market infiltration rates. The walking aids are further split into rollators as well as other walking aids like walkers, canes, and crutches. Premium rollators are projected to achieve popularity in approaching years due to the unique features like oxygen tank holders, laser attachment (Alzheimer’s patient), lockable wheels, extended weight bearing capacity, hemiplegic handles, light frame, larger wheel diameter, pressure brakes, etc. are attached to it.
Regional Outlook and Trend Analysis
In 2017, the North American regional market was the major customer of the personal mobility devices market. Rising geriatric population, growing demand for assistive equipment, along with the existence of an advanced reimbursement system policies functioning towards abbreviating the out of pocket expenditure of patients are key factors assigning to the region’s major market. In 2017, European region reported for around % of the market revenue share in the global personal mobility devices industry and was the next major consumer of personal mobility devices over the projected period. Asia-Pacific region is anticipated to grow at the highest CAGR throughout the forecast years. The Large existence of unexplored opportunities in the developing markets of China and India and continuously amending medical infrastructure in these industries are some factors reporting for the abovementioned conclusion.
Competitive Outlook and Trend Analysis
Key market players of the global personal mobility devices market are; Argo Medical, Amigo Mobility International, Inc., ArjoHuntleigh, Hill-Rom Holdings, Inc., Graham-Field Health Products Incorporated, Carex Health Brand Incorporation, Invacare, TOPRO, Drive Medical Design & Manufacturing, Electric Mobility, Sunrise Medical, Pride mobility, Briggs Healthcare, Kaye Products, Nova, Eurovema AB, and Patterson Medical. Companies in this market are implementing sustainability strategies like product portfolio expansion, mergers & acquisitions, and entering into strategic collaborations, are further anticipated to boost the market growth.
The global personal mobility devicesmarket is segmented as follows –
By Product
- Wheel chairs
- Manual
- Powered
- Scooters
- Walking aid
- Rollators
- Premium
- Low cost
- Other walking aids (cranes, crutches & walkers)
By Region
- North America
- U.S
- Canada
- Mexico
- Europe
- Germany
- France
- UK
- Italy
- Spain
- Rest of Europe
- Asia-Pacific
- Japan
- China
- Australia
- India
- South Korea
- Rest of Asia Pacific
- Rest of the World
- Brazil
- South Africa
- Saudi Arabia
- United Arab Emirates
- Others
Some of the key questions answered by the report are:
· What was the market size in 2017 and forecast from 2017 to 2022?
· What will be the industry market growth from 2017 to 2022?
· What are the major drivers, restraints, opportunities, challenges, and industry trends and their impact on the market forecast?
· What are the major segments leading the market growth and why?
· Which are the leading players in the market and what are the major strategies adopted by them to sustain the market competition?
Market Classification
- Personal Mobility Devices Market, By Product, Estimates and Forecast, 2012-2022 ($Million)
- Wheel chairs
- Manual
- Powered
- Scooters
- Walking aids
- Rollators
- Premium
- Low cost
- Rollators
- Other walking aids
- Wheel chairs
- Personal Mobility Devices Market, By Region, Estimates and Forecast, 2012-2022 ($Million)
- North America
- North America Personal Mobility Devices Market, By Country
- North America Personal Mobility Devices Market, By Product
- U.S. Personal Mobility Devices Market, By Product
- Canada Personal Mobility Devices Market, By Product
- Mexico Personal Mobility Devices Market, By Product
-
- Europe
- Europe Personal Mobility Devices Market, By Country
- Europe Personal Mobility Devices Market, By Product
- Germany Personal Mobility Devices Market, By Product
- France Personal Mobility Devices Market, By Product
- UK Personal Mobility Devices Market, By Product
- Italy Personal Mobility Devices Market, By Product
- Spain Personal Mobility Devices Market, By Product
- Rest of Europe Personal Mobility Devices Market, By Product
-
- Asia-Pacific
- Asia-Pacific Personal Mobility Devices Market, By Country
- Asia-Pacific Personal Mobility Devices Market, By Product
- Japan Personal Mobility Devices Market, By Product
- ChinaPersonal Mobility Devices Market, By Product
- Australia Personal Mobility Devices Market, By Product
- India Personal Mobility Devices Market, By Product
- South Korea Personal Mobility Devices Market, By Product
- Rest of Asia-Pacific Personal Mobility Devices Market, By Product
- Asia-Pacific
-
- Rest of the World
- Rest of the World Personal Mobility Devices Market, By Country
- Rest of the World Personal Mobility Devices Market, By Product
- Brazil Personal Mobility Devices Market, By Product
- South Africa Personal Mobility Devices Market, By Product
- Saudi Arabia Personal Mobility Devices Market, By Product
- Turkey Personal Mobility Devices Market, By Product
- United Arab Emirates Personal Mobility Devices Market, By Product
- Others Personal Mobility Devices Market, By Product
- Rest of the World
Table of Contents
- Introduction
- Report Description
- Research Methodology
- Secondary Research
- Primary Research
- Executive Summary
- Key Highlights
- Market Overview
- Introduction
- Market Definition
- Market Segmentation
- Market Dynamics
- Drivers
- Increasing geriatric population
- Increasing incidences of rheumatoid arthritis and osteoporosis
- Existence of supportive government initiatives
- Restraints
- High procuring and maintenance cost
- Opportunities
- Technological Advancement in Development of Advanced Mobility Devices
- Drivers
- Introduction
- Personal Mobility Devices Market, By Product
- Introduction
- Personal Mobility Devices Market Assessment and Forecast, By Product, 2012-2022
- Wheel chairs
- Market Assessment and Forecast, By Type, 2012-2022 ($Million)
- Market Assessment and Forecast, By Region, 2012-2022 ($Million)
- Manual
- Market Assessment and Forecast, By Region, 2012-2022 ($Million)
- Powered
- Market Assessment and Forecast, By Region, 2012-2022 ($Million)
- Scooters
- Market Assessment and Forecast, By Region, 2012-2022 ($Million)
- Walking aids
-
- Market Assessment and Forecast, By Type, 2012-2022 ($Million)
- Market Assessment and Forecast, By Region, 2012-2022 ($Million)
- Rollators
- Market Assessment and Forecast, By Type, 2012-2022 ($Million)
- Market Assessment and Forecast, By Region, 2012-2022 ($Million)
- Premium
- Market Assessment and Forecast, By Region, 2012-2022 ($Million)
- Low cost
- Market Assessment and Forecast, By Region, 2012-2022 ($Million)
-
- Other walking aids
- Market Assessment and Forecast, By Region, 2012-2022 ($Million)
- Personal Mobility Devices Market, By Region
- Introduction
- Personal Mobility Devices Market Assessment and Forecast, By Region, 2012-2022 ($Million)
- North America
- Market Assessment and Forecast, By Country, 2012-2022 ($Million)
- Market Assessment and Forecast, By Product, 2012-2022 ($Million)
- U.S.
- Market Assessment and Forecast, By Product, 2012-2022 ($Million)
- Canada
- Market Assessment and Forecast, By Product, 2012-2022 ($Million)
- Mexico
- Market Assessment and Forecast, By Product, 2012-2022 ($Million)
- Europe
- Market Assessment and Forecast, By Country, 2012-2022 ($Million)
- Market Assessment and Forecast, By Product, 2012-2022 ($Million)
- Germany
- Market Assessment and Forecast, By Product, 2012-2022 ($Million)
- France
- Market Assessment and Forecast, By Products, 2012-2022 ($Million)
- UK
- Market Assessment and Forecast, By Product, 2012-2022 ($Million)
- Italy
- Market Assessment and Forecast, By Product, 2012-2022 ($Million)
- Spain
- Market Assessment and Forecast, By Product, 2012-2022 ($Million)
- Rest of Europe
- Market Assessment and Forecast, By Product, 2012-2022 ($Million)
- Asia-Pacific
- Market Assessment and Forecast, By Country, 2012-2022 ($Million)
- Market Assessment and Forecast, By Product, 2012-2022 ($Million)
- Japan
- Market Assessment and Forecast, By Product, 2012-2022 ($Million)
- China
- Market Assessment and Forecast, By Product, 2012-2022 ($Million)
- Australia
- Market Assessment and Forecast, By Product, 2012-2022 ($Million)
- India
- Market Assessment and Forecast, By Product, 2012-2022 ($Million)
- South Korea
- Market Assessment and Forecast, By Product, 2012-2022 ($Million)
- Rest of Asia-Pacific
- Market Assessment and Forecast, By Product, 2012-2022 ($Million)
- Rest of the World
- Market Assessment and Forecast, By Country, 2012-2022 ($Million)
- Market Assessment and Forecast, By Product, 2012-2022 ($Million)
- Brazil
- Market Assessment and Forecast, By Product, 2012-2022 ($Million)
- Turkey
- Market Assessment and Forecast, By Product, 2012-2022 ($Million)
- Saudi Arabia
- Market Assessment and Forecast, By Product, 2012-2022 ($Million)
- South Africa
- Market Assessment and Forecast, By Product, 2012-2022 ($Million)
- United Arab Emirates
- Market Assessment and Forecast, By Product, 2012-2022 ($Million)
- Others
- Market Assessment and Forecast, By Product, 2012-2022 ($Million)
- Company Profiles
- TOPRO
- Business Overview
- Product Portfolio
- Key Financials
- Strategic Developments
- Carex Health Brand Incorporation
- Business Overview
- Product Portfolio
- Key Financials
- Strategic Developments
- Sunrise Medical
- Business Overview
- Product Portfolio
- Key Financials
- Strategic Developments
- Pride mobility
- Business Overview
- Product Portfolio
- Key Financials
- Strategic Developments
- Electric Mobility
- Business Overview
- Product Portfolio
- Key Financials
- Strategic Developments
- Kaye Products
- Business Overview
- Product Portfolio
- Key Financials
- Strategic Developments
- Nova
- Business Overview
- Product Portfolio
- Key Financials
- Strategic Developments
- Briggs Healthcare
- Business Overview
- Product Portfolio
- Key Financials
- Strategic Developments
- Patterson Medical
- Business Overview
- Product Portfolio
- Key Financials
- Strategic Developments
- Eurovema AB.
- Business Overview
- Product Portfolio
- Key Financials
- Strategic Developments
- Invacare
- Business Overview
- Product Portfolio
- Key Financials
- Strategic Developments
- TOPRO
List of Tables
List of Tables
Table 1.Personal Mobility Devices Market, By Product ($Million), 2012-2022
Table 2.Wheel chairs Market, By Region ($Million), 2012-2022
Table 3.Manual Market, By Region ($Million), 2012-2022
Table 4.Powered Market, By Region ($Million), 2012-2022
Table 5.Scooters Market, By Region ($Million), 2012-2022
Table 6.Walking aids Market, By Region ($Million), 2012-2022
Table 7.Rollators Market, By Region ($Million), 2012-2022
Table 6.Premium Market, By Region ($Million), 2012-2022
Table 8.Low cost Market, By Region ($Million), 2012-2022
Table 9.Other walking aids Market, By Region ($Million), 2012-2022
Table 10.North America Personal Mobility Devices Market, By Country, 2012-2022 ($Million)
Table 11.North America Personal Mobility Devices Market, By Product, 2012-2022 ($Million)
Table 12.U.S. Personal Mobility Devices Market, By Product, 2012-2022 ($Million)
Table 13.Canada Personal Mobility Devices Market, By Product, 2012-2022 ($Million)
Table 14.Mexico Personal Mobility Devices Market, By Product, 2012-2022 ($Million)
Table 15.Europe Personal Mobility Devices Market, By Country, 2012-2022 ($Million)
Table 16.Europe Personal Mobility Devices Market, By Product, 2012-2022 ($Million)
Table 16.Germany Personal Mobility Devices Market, By Product, 2012-2022 ($Million)
Table 17.France Personal Mobility Devices Market, By Product, 2012-2022 ($Million)
Table 18.UK Personal Mobility Devices Market, By Product, 2012-2022 ($Million)
Table 19.Italy Personal Mobility Devices Market, By Product, 2012-2022 ($Million)
Table 20.Spain Personal Mobility Devices Market, By Product, 2012-2022 ($Million)
Table 21.Rest of Europe Personal Mobility Devices Market, By Product, 2012-2022 ($Million)
Table 22.Asia-Pacific Personal Mobility Devices Market, By Country, 2012-2022 ($Million)
Table 23.Asia-Pacific Personal Mobility Devices Market, By Product, 2012-2022 ($Million)
Table 24.Japan Personal Mobility Devices Market, By Product, 2012-2022 ($Million)
Table 25.China Personal Mobility Devices Market, By Product, 2012-2022 ($Million)
Table 26.Australia Personal Mobility Devices Market, By Product, 2012-2022 ($Million)
Table 27.India Personal Mobility Devices Market, By Product, 2012-2022 ($Million)
Table 28.South Korea Personal Mobility Devices Market, By Product, 2012-2022 ($Million)
Table 29.Rest of Asia-Pacific Personal Mobility Devices Market, By Product, 2012-2022 ($Million)
Table 30.Rest of the World Personal Mobility Devices Market, By Country, 2012-2022 ($Million)
Table 31.Rest of the World Personal Mobility Devices Market, By Product, 2012-2022 ($Million)
Table 32.Brazil Personal Mobility Devices Market, By Product, 2012-2022 ($Million)
Table 33.Turkey Personal Mobility Devices Market, By Product, 2012-2022 ($Million)
Table 34.Saudi Arabia Personal Mobility Devices Market, By Product, 2012-2022 ($Million)
Table 35.South Africa Personal Mobility Devices Market, By Product, 2012-2022 ($Million)
Table 36.United Arab Emirates Personal Mobility Devices Market, By Product, 2012-2022 ($Million)
Table 37.Others Personal Mobility Devices Market, By Product, 2012-2022 ($Million)
Table 38.TOPRO: Key Strategic Developments, 2017-2017
Table 39.Carex Health Brand Incorporation: Key Strategic Developments, 2017-2017
Table 40.Sunrise Medical: Key Strategic Developments, 2017-2017
Table 41.Pride mobility: Key Strategic Developments, 2017-2017
Table 42.Electric Mobility: Key Strategic Developments, 2017-2017
Table 43.Kaye Products: Key Strategic Developments, 2017-2017
Table 44.Nova: Key Strategic Developments, 2017-2017
Table 45.Briggs Healthcare: Key Strategic Developments, 2017-2017
Table 46.Patterson Medical: Key Strategic Developments, 2017-2017
Table 47.Eurovema AB: Key Strategic Developments, 2017-2017
Table 48.Invacare: Key Strategic Developments, 2017-2017
List of Figures
List of Figures
Figure 1.Personal Mobility Devices Market, By Product, 2012 & 2022 ($Million)
Figure 2.Personal Mobility Devices Market, By Region, 2017, ($Million)
Figure 3.TOPRO: Net Revenues, 2017-2017 ($Million)
Figure 4.TOPRO: Net Revenue Share, By Segment, 2017
Figure 5.TOPRO: Net Revenue Share, By Geography, 2017
Figure 6.Invacare: Net Revenues, 2017-2017 ($Million)
Figure 7.Invacare: Net Revenue Share, By Segment, 2017
Figure 8.Invacare: Net Revenue Share, By Geography, 2017
Figure 9.Amdocs: Net Revenues, 2017-2017 ($Million)
Figure 10.Amdocs: Net Revenue Share, By Segment, 2017
Figure 11.Amdocs: Net Revenue Share, By Geography, 2017
Figure 12.Carex Health Brand Incorporation: Net Revenues, 2017-2017 ($Million)
Figure 13.Carex Health Brand Incorporation: Net Revenue Share, By Segment, 2017
Figure 14.Carex Health Brand Incorporation: Net Revenue Share, By Geography, 2017
Figure 15.Pride mobility: Net Revenues, 2017-2017 ($Million)
Figure 16.Pride mobility: Net Revenue Share, By Segment, 2017
Figure 17.Pride mobility: Net Revenue Share, By Geography, 2017
Research Methodology
We use both primary as well as secondary research for our market surveys, estimates and for developing forecast. Our research process commence by analyzing the problem which enable us to design the scope for our research study. Our research process is uniquely designed with enough flexibility to adjust according to changing nature of products and markets, while retaining core element to ensure reliability and accuracy in research findings. We understand both macro and micro-economic factors to evaluate and forecast different market segments.
Data Mining
Data is extensively collected through various secondary sources such as annual reports, investor presentations, SEC filings, and other corporate publications. We also refer trade magazines, technical journals, paid databases such as Factiva and Bloomberg, industry trade journals, scientific journals, and social media data to understand market dynamics and industry trends. Further, we also conduct primary research to understand market drivers, restraints, opportunities, challenges, and competitive scenario to build our analysis.
Data Collection Matrix
|
Data Collection Matrix |
Supply Side |
Demand Side |
|
Primary Data Sources |
|
|
|
Secondary Data Sources |
|
|
Market Modeling and Forecasting
We use epidemiology and capital equipment-based models to forecast market size of different segments at country and regional level.
- Epidemiology-based Forecasting Model: This method uses epidemiology data gathered through various publications and from physicians to estimate population of patients, flow of treatment of individual disease and therapies. The data collected through this method includes statics on incidence of disease, population suffering from disease, and treatment population. This method is used to understand:
- Number of patients for particular device or medical procedure and
- Repeated use of particular device depending on health and condition of patient
- Capital-based Forecasting Model: This method of forecasting is based on number of replacements, installed-based and new sales of capital equipment used in various healthcare and diagnostic centers. These three parameters are calculated and forecast is developed. Installation base is calculated as average number of units per facility; while sales for particular year is calculated from number of new and replace units. Secondary data is collected through various supply chain intermediaries and opinion leaders to arrive at installation and sales rate. These techniques help our analysts in validating market and developed market estimates and forecast.
We do forecast on basis of several parameters such as market drivers, market opportunities, industry trends government regulations, raw materials supply and trade dynamics to ensure relevance of forecast with market scenario. With increasing need to granulized information, we used bottom-up methodology for forecasting where we evaluate each regional segment differently and combined all forecast to develop final market forecast.
Data Validation
We believe primary research is a very important tool in analyzing and forecasting different markets. In order to make sure accuracy of our findings, our team conducts primary interviews at every stage of research to gain deep insights into current business environment and future trends and key developments in market. This includes use of various methods such as telephonic interviews, focus groups, face to face interviews and questionnaires to validate our research from all aspects. We validate our data through primary research from key industry leaders such as CEO, product managers, marketing managers, suppliers, distributors, and consumers are frequently interviewed. These interviews provide valuable insights which help us to have better market understanding besides validating our estimates and forecast.
Data Triangulation

Industry Analysis
|
Qualitative Data |
Quantitative Data (2017-2025) |
|
|