.png)
Medical Holography Market by Product, Application, and End user - Global Industry Analysis and Forecast to 2027
Published On : August 2017 Pages : 95 Category: Medical Devices Report Code : HC08196
SEGMENTS & REGIONS:
- Regions: North America, Europe, Asia- Pacific, Latin America, Middle East & Africa
Industry Trend Analysis
The global medical holography market is expected to be around $4 billion by 2027. Some of the key factors driving the market growth are, advancements in holographic display technology, increasing adoption of holography products in medical education and different medical sectors such as orthopedics, surgical procedures, cardiac electrophysiology and dentistry. As holography products can efficiently display complex 3D structures, physicians can effectively analyze different parts in the human body that are otherwise, not easily accessible. As such imaging technology aids in-depth analysis of disease progression, the demand for holography products by the healthcare sector is expected to substantially increase in coming years. However, high cost of holography products can limit their adoption by small and medium scale healthcare organizations, thus restraining the market growth.
Product Outlook and Trend Analysis
Holographic displays segment held the largest share of the global medical holography market in 2017 due to the large scale adoption of holographic displays for viewing 3-dimensional images in biomedical research applications as well as in medical education. As these devices facilitate advanced medical training and real-time generation of 3D images, their penetration is expected to significantly increase during the forecast period.
Application Outlook and Trend Analysis
Biomedical research segment held the major share of the overall medical holography market in 2017 whereas, medical education segment is expected to exhibit lucrative growth during the forecast period. As complex information can be represented efficiently in 3-dimentional models using holographic products, medical education sector is expected to hugely benefit by the adoption of such products in coming years.
End User Outlook and Trend Analysis
Research laboratories segment dominated the global market for medical holography in 2017 owing to the large scale adoption of holography products for applications such as cell imaging and phase contrast imaging. As holography products can render detailed images of complex cellular structures, researchers are rapidly adopting these products for advanced research activities.
Regional Outlook and Trend Analysis
North America accounted for a majority share of the global medical holography market in 2017 owing to the large scale research undertakings related to holography products and their applications along with presence of major players in the region. Due to the rapid acceptance of holography technology by the healthcare sector in North America, this regional market is expected to witness favorable growth over the forecast period. The Asia-Pacific medical holography market is projected to exhibit significant growth during the forecast period due to increasing healthcare expenditure in countries such as China, Japan, and India along with increased awareness related to the advantages of holography technology among the medial professionals in the region.
Competitive Insights
The key strategy adopted by the major players operating in the global medical holography market is product development. For instance, August 2022, RealView Imaging Ltd., an Israel based company focusing on development of interactive live holography technology announced the adoption of Intel RealSense technology for its HOLOSCOPE-I, holographic augmented reality medical system. By the integration of Intel RealSense SR300-series camera, the HOLOSCOPE-I system can enable close-range, direct manipulation of holograms.
Some of the key players in the overall medical holography market are, EchoPixel, Inc., Ovizio Imaging Systems NV/SA, RealView Imaging Ltd., zSpace, Inc., Holoxica Limited, Nanolive SA, Zebra Imaging, Lyncée Tec SA, Holografika Kft and Phase Holographic Imaging PHI AB.
Medical Holography Market Segmentation:
By Product:
- Holographic Displays
- Touchable Displays
- Laser Displays
- Semi-transparent Displays
- Piston Displays
- Holographic Prints
- Holographic Microscopes
- Holographic Software
- Other Holography Products
By Application:
- Biomedical Research
- Medical Imaging
- Medical Education
By End User:
- Academic Medical Centers
- Research Laboratories
- Hospitals and Clinics
- Pharmaceutical and Biotechnology Companies
By Region:
- North America
- U.S
- Canada
- Mexico
- Europe
- Germany
- France
- UK
- Italy
- Spain
- Rest of Europe
- Asia-Pacific
- Japan
- China
- Australia
- India
- South Korea
- Rest of Asia Pacific
- Rest of the World
- Brazil
- South Africa
- Saudi Arabia
- United Arab Emirates
- Others
Some of the key questions answered by the report are:
- What was the market size in 2017 and forecast from 2022 to 2027?
- What will be the industry market growth from 2022 to 2027?
- What are the major drivers, restraints, opportunities, challenges, and industry trends and their impact on the market forecast?
- What are the major segments leading the market growth and why?
- Which are the leading players in the market and what are the major strategies adopted by them to sustain the market competition?
Market Classification
- Medical Holography Market, By Product, Estimates and Forecast, 2017-2027 ($Million)
- Holographic Displays
- Touchable Displays
- Laser Displays
- Semi-transparent Displays
- Piston Displays
- Holographic Prints
- Holographic Microscopes
- Holographic Software
- Other Holography Products
- Medical Holography Market, By Application, Estimates and Forecast, 2017-2027 ($Million)
- Biomedical Research
- Medical Imaging
- Medical Education
- Medical Holography Market, By End User, Estimates and Forecast, 2017-2027 ($Million)
- Academic Medical Centers
- Research Laboratories
- Hospitals and Clinics
- Pharmaceutical and Biotechnology Companies
- Medical Holography Market, By Region, Estimates and Forecast, 2017-2027 ($Million)
- North America
- North America Medical Holography Market, By Country
- North America Medical Holography Market, By Product
- North America Medical Holography Market, By Application
- North America Medical Holography Market ,By End User
- U.S. Medical Holography Market, By Product
- U.S. Medical Holography Market, By Application
- U.S. Medical Holography Market, By End User
- Canada Medical Holography Market, By Product
- Canada Medical Holography Market, By Application
- Canada Medical Holography Market, By End User
- Mexico Medical Holography Market, By Product
- Mexico Medical Holography Market, By Application
- Mexico Medical Holography Market, By End User
-
- Europe
- Europe Medical Holography Market, By Country
- Europe Medical Holography Market, By Product
- Europe Medical Holography Market, By Application
- Europe Medical Holography Market, By End User
- Germany Medical Holography Market, By Product
- Germany Medical Holography Market, By Application
- Germany Medical Holography Market, By End User
- France Medical Holography Market, By Product
- France Medical Holography Market, By Application
- France Medical Holography Market, By End User
- UK Medical Holography Market, By Product
- UK Medical Holography Market, By Application
- UK Medical Holography Market, By End User
- Italy Medical Holography Market, By Product
- Italy Medical Holography Market, By Application
- Italy Medical Holography Market, By End User
- Spain Medical Holography Market, By Product
- Spain Medical Holography Market, By Application
- Spain Medical Holography Market, By End User
- Rest of Europe Medical Holography Market, By Product
- Rest of Europe Medical Holography Market, By Application
- Rest of Europe Medical Holography Market, By End User
- Europe
-
- Asia-Pacific
- Asia-Pacific Medical Holography Market, By Country
- Asia-Pacific Medical Holography Market, By Product
- Asia-Pacific Medical Holography Market, By Application
- Asia-Pacific 3D Medical Holography Market, By End User
- Japan Medical Holography Market, By Product
- Japan Medical Holography Market, By Application
- Japan Medical Holography Market, By End User
- China Medical Holography Market, By Product
- China Medical Holography Market, By Application
- China Medical Holography Market, By End User
- Australia Medical Holography Market, By Product
- Australia Medical Holography Market, By Application
- Australia Medical Holography Market, By End User
- India Medical Holography Market, By Product
- India Medical Holography Market, By Application
- India Medical Holography Market, By End User
- South Korea Cell Culture Market, By Product
- South Korea Medical Holography Market, By Application
- South Korea Medical Holography Market, By End User
- Rest of Asia-Pacific Medical Holography Market, By Product
- Rest of Asia-Pacific Medical Holography Market, By Application
- Rest of Asia-Pacific Medical Holography Market, By End User
- Asia-Pacific
-
- Rest of the World
- Rest of the World Medical Holography Market, By Country
- Rest of the World Medical Holography Market, By Product
- Rest of the World Medical Holography Market, By Application
- Rest of the World Medical Holography Market ,By End User
- Brazil Medical Holography Market, By Product
- Brazil Medical Holography Market, By Application
- Brazil Medical Holography Market, By End User
- South Africa Medical Holography Market, By Product
- South Africa Medical Holography Market, By Application
- South Africa Medical Holography Market, By End User
- Saudi Arabia Medical Holography Market, By Product
- Saudi Arabia Medical Holography Market, By Application
- Saudi Arabia Medical Holography Market, By End User
- Turkey Medical Holography Market, By Product
- Turkey Medical Holography Market, By Application
- Turkey Medical Holography Market, By End User
- United Arab Emirates Medical Holography Market, By Product
- United Arab Emirates Medical Holography Market, By Application
- United Arab Emirates Medical Holography Market, By End User
- Others Medical Holography Market, By Product
- Others Medical Holography Market, By Application
- Others Medical Holography Market, By End User
- Rest of the World
Table of Contents
1.Introduction
1.1.Report Description
1.2.Research Methodology
2.Executive Summary
2.1.Key Highlights
3.Market Overview
3.1.Introduction
3.1.1. Market Definition
3.1.2. Market Segmentation
3.2.Market Dynamics
3.2.1. Drivers
3.2.1.1.Technological Advancements in Holography Products
3.2.1.2.Increasing adoption of Holography Products in Medical Education
3.2.1.3.Benefits of Holography Product in Visualizing 3D structures in Biomedical Research
3.2.2. Restraints
3.2.2.1.High Cost of Holography Products
3.2.3. Opportunities
3.2.3.1.Emerging Markets to Offer Lucrative Growth Opportunities
4.Medical Holography Market, By Product
4.1.Introduction
4.2.Medical Holography Market Assessment and Forecast, By Product, 2017-2027
4.3.Holographic Displays
4.3.1. Market Assessment and Forecast, By Type, 2017-2027 ($Million)
4.3.2. Market Assessment and Forecast, By Region, 2017-2027 ($Million)
4.3.3. Touchable Displays
4.3.3.1.Market Assessment and Forecast, By Region, 2017-2027 ($Million)
4.3.4. Laser Displays
4.3.4.1.Market Assessment and Forecast, By Region, 2017-2027 ($Million)
4.3.5. Semi-transparent Displays
4.3.5.1.Market Assessment and Forecast, By Region, 2017-2027 ($Million)
4.3.6. Piston Displays
4.3.6.1.Market Assessment and Forecast, By Region, 2017-2027 ($Million)
4.4.Holographic Prints
4.4.1. Market Assessment and Forecast, By Region, 2017-2027 ($Million)
4.5.Holographic Microscopes
4.5.1. Market Assessment and Forecast, By Region, 2017-2027 ($Million)
4.6.Holographic Software
4.6.1. Market Assessment and Forecast, By Region, 2017-2027 ($Million)
4.7.Other Holography Products
4.7.1. Market Assessment and Forecast, By Region, 2017-2027 ($Million)
5.Medical Holography Market, By Application
5.1.Introduction
5.2.Medical Holography Market Assessment and Forecast, By Application, 2017-2027
5.3.Biomedical Research
5.3.1. Market Assessment and Forecast, By Region, 2017-2027 ($Million)
5.4.Medical Imaging
5.4.1. Market Assessment and Forecast, By Region, 2017-2027 ($Million)
5.5.Medical Education
5.5.1. Market Assessment and Forecast, By Region, 2017-2027 ($Million)
6.Medical Holography Market, By End User
6.1.Introduction
6.2.Medical Holography Market Assessment and Forecast, By End User, 2017-2027
6.3.Academic Medical Centers
6.3.1. Market Assessment and Forecast, By Region, 2017-2027 ($Million)
6.4.Research Laboratories
6.4.1. Market Assessment and Forecast, By Region, 2017-2027 ($Million)
6.5.Hospitals and Clinics
6.5.1. Market Assessment and Forecast, By Region, 2017-2027 ($Million)
6.6.Pharmaceutical and Biotechnology Companies
6.6.1. Market Assessment and Forecast, By Region, 2017-2027 ($Million)
7.Medical Holography Market, By Region
7.1.Introduction
7.2.Medical Holography Market Assessment and Forecast, By Region, 2017-2027 ($Million)
7.3.North America
7.3.1. Market Assessment and Forecast, By Country, 2017-2027 ($Million)
7.3.2. Market Assessment and Forecast, By Product, 2017-2027 ($Million)
7.3.3. Market Assessment and Forecast, By Application, 2017-2027 ($Million)
7.3.4. Market Assessment and Forecast, By End User, 2017-2027 ($Million)
7.3.4.1.U.S.
7.3.4.1.1.Market Assessment and Forecast, By Product, 2017-2027 ($Million)
7.3.4.1.2.Market Assessment and Forecast, By Application, 2017-2027 ($Million)
7.3.4.1.3.Market Assessment and Forecast, By End User, 2017-2027 ($Million)
7.3.4.2.Canada
7.3.4.2.1.Market Assessment and Forecast, By Product, 2017-2027 ($Million)
7.3.4.2.2.Market Assessment and Forecast, By Application, 2017-2027 ($Million)
7.3.4.2.3.Market Assessment and Forecast, By End User, 2017-2027 ($Million)
7.3.4.3.Mexico
7.3.4.3.1.Market Assessment and Forecast, By Product, 2017-2027 ($Million)
7.3.4.3.2.Market Assessment and Forecast, By Application, 2017-2027 ($Million)
7.3.4.3.3.Market Assessment and Forecast, By End User, 2017-2027 ($Million)
7.4.Europe
7.4.1. Market Assessment and Forecast, By Country, 2017-2027 ($Million)
7.4.2. Market Assessment and Forecast, By Product, 2017-2027 ($Million)
7.4.3. Market Assessment and Forecast, By Application, 2017-2027 ($Million)
7.4.4. Market Assessment and Forecast, By End User, 2017-2027 ($Million)
7.4.4.1.Germany
7.4.4.1.1.Market Assessment and Forecast, By Product, 2017-2027 ($Million)
7.4.4.1.2.Market Assessment and Forecast, By Application, 2017-2027 ($Million)
7.4.4.1.3.Market Assessment and Forecast, By End User, 2017-2027 ($Million)
7.4.4.2.France
7.4.4.2.1.Market Assessment and Forecast, By Product, 2017-2027 ($Million)
7.4.4.2.2.Market Assessment and Forecast, By Application, 2017-2027 ($Million)
7.4.4.2.3.Market Assessment and Forecast, By End User, 2017-2027 ($Million)
7.4.4.3.UK
7.4.4.3.1.Market Assessment and Forecast, By Product, 2017-2027 ($Million)
7.4.4.3.2.Market Assessment and Forecast, By Application, 2017-2027 ($Million)
7.4.4.3.3.Market Assessment and Forecast, By End User, 2017-2027 ($Million)
7.4.4.4.Italy
7.4.4.4.1.Market Assessment and Forecast, By Product, 2017-2027 ($Million)
7.4.4.4.2.Market Assessment and Forecast, By Application, 2017-2027 ($Million)
7.4.4.4.3.Market Assessment and Forecast, By End User, 2017-2027 ($Million)
7.4.4.5.Spain
7.4.4.5.1.Market Assessment and Forecast, By Product, 2017-2027 ($Million)
7.4.4.5.2.Market Assessment and Forecast, By Application, 2017-2027 ($Million)
7.4.4.5.3.Market Assessment and Forecast, By End User, 2017-2027 ($Million)
7.4.4.6.Russia
7.4.4.6.1.Market Assessment and Forecast, By Product, 2017-2027 ($Million)
7.4.4.6.2.Market Assessment and Forecast, By Application, 2017-2027 ($Million)
7.4.4.6.3.Market Assessment and Forecast, By End User, 2017-2027 ($Million)
7.4.4.7.Rest of Europe
7.4.4.7.1.Market Assessment and Forecast, By Product, 2017-2027 ($Million)
7.4.4.7.2.Market Assessment and Forecast, By Application, 2017-2027 ($Million)
7.4.4.7.3.Market Assessment and Forecast, By End User, 2017-2027 ($Million)
7.5.Asia-Pacific
7.5.1. Market Assessment and Forecast, By Country, 2017-2027 ($Million)
7.5.2. Market Assessment and Forecast, By Product, 2017-2027 ($Million)
7.5.2.1.Japan
7.5.2.1.1.Market Assessment and Forecast, By Product, 2017-2027 ($Million)
7.5.2.1.2.Market Assessment and Forecast, By Application, 2017-2027 ($Million)
7.5.2.1.3.Market Assessment and Forecast, By End User, 2017-2027 ($Million)
7.5.2.2.China
7.5.2.2.1.Market Assessment and Forecast, By Product, 2017-2027 ($Million)
7.5.2.2.2.Market Assessment and Forecast, By Application, 2017-2027 ($Million)
7.5.2.2.3.Market Assessment and Forecast, By End User, 2017-2027 ($Million)
7.5.2.3.Australia
7.5.2.3.1.Market Assessment and Forecast, By Product, 2017-2027 ($Million)
7.5.2.3.2.Market Assessment and Forecast, By Application, 2017-2027 ($Million)
7.5.2.3.3.Market Assessment and Forecast, By End User, 2017-2027 ($Million)
7.5.2.4.India
7.5.2.4.1.Market Assessment and Forecast, By Product, 2017-2027 ($Million)
7.5.2.4.2.Market Assessment and Forecast, By Application, 2017-2027 ($Million)
7.5.2.4.3.Market Assessment and Forecast, By End User, 2017-2027 ($Million)
7.5.2.5.South Korea
7.5.2.5.1.Market Assessment and Forecast, By Product, 2017-2027 ($Million)
7.5.2.5.2.Market Assessment and Forecast, By Application, 2017-2027 ($Million)
7.5.2.5.3.Market Assessment and Forecast, By End User, 2017-2027 ($Million)
7.5.2.6.Taiwan
7.5.2.6.1.Market Assessment and Forecast, By Product, 2017-2027 ($Million)
7.5.2.6.2.Market Assessment and Forecast, By Application, 2017-2027 ($Million)
7.5.2.6.3.Market Assessment and Forecast, By End User, 2017-2027 ($Million)
7.5.2.7.Rest of Asia-Pacific
7.5.2.7.1.Market Assessment and Forecast, By Product, 2017-2027 ($Million)
7.5.2.7.2.Market Assessment and Forecast, By Application, 2017-2027 ($Million)
7.5.2.7.3.Market Assessment and Forecast, By End User, 2017-2027 ($Million)
7.6.Rest of the World
7.6.1. Market Assessment and Forecast, By Country, 2017-2027 ($Million)
7.6.2. Market Assessment and Forecast, By Product, 2017-2027 ($Million)
7.6.2.1.Brazil
7.6.2.1.1.Market Assessment and Forecast, By Product, 2017-2027 ($Million)
7.6.2.1.2.Market Assessment and Forecast, By Application, 2017-2027 ($Million)
7.6.2.1.3.Market Assessment and Forecast, By End User, 2017-2027 ($Million)
7.6.2.2.Turkey
7.6.2.2.1.Market Assessment and Forecast, By Product, 2017-2027 ($Million)
7.6.2.2.2.Market Assessment and Forecast, By Application, 2017-2027 ($Million)
7.6.2.2.3.Market Assessment and Forecast, By End User, 2017-2027 ($Million)
7.6.2.3.Saudi Arabia
7.6.2.3.1.Market Assessment and Forecast, By Product, 2017-2027 ($Million)
7.6.2.3.2.Market Assessment and Forecast, By Application, 2017-2027 ($Million)
7.6.2.3.3.Market Assessment and Forecast, By End User, 2017-2027 ($Million)
7.6.2.4.South Africa
7.6.2.4.1.Market Assessment and Forecast, By Product, 2017-2027 ($Million)
7.6.2.4.2.Market Assessment and Forecast, By Application, 2017-2027 ($Million)
7.6.2.4.3.Market Assessment and Forecast, By End User, 2017-2027 ($Million)
7.6.2.5.United Arab Emirates
7.6.2.5.1.Market Assessment and Forecast, By Product, 2017-2027 ($Million)
7.6.2.5.2.Market Assessment and Forecast, By Application, 2017-2027 ($Million)
7.6.2.5.3.Market Assessment and Forecast, By End User, 2017-2027 ($Million)
7.6.2.6.Others
7.6.2.6.1.Market Assessment and Forecast, By Product, 2017-2027 ($Million)
7.6.2.6.2.Market Assessment and Forecast, By Application, 2017-2027 ($Million)
7.6.2.6.3.Market Assessment and Forecast, By End User, 2017-2027 ($Million)
8.Company Profiles
8.1.EchoPixel, Inc.
8.1.1. Business Overview
8.1.2. Product Portfolio
8.1.3. Strategic Developments
8.2.Ovizio Imaging Systems NV/SA
8.2.1. Business Overview
8.2.2. Product Portfolio
8.2.3. Strategic Developments
8.3.zSpace, Inc.
8.3.1. Business Overview
8.3.2. Product Portfolio
8.3.3. Strategic Developments
8.4.Holoxica Limited
8.4.1. Business Overview
8.4.2. Product Portfolio
8.4.3. Strategic Developments
8.5.Holografika Kft
8.5.1. Business Overview
8.5.2. Product Portfolio
8.5.3. Strategic Developments
8.6.Nanolive SA
8.6.1. Business Overview
8.6.2. Product Portfolio
8.6.3. Strategic Developments
8.7.Zebra Imaging
8.7.1. Business Overview
8.7.2. Product Portfolio
8.7.3. Strategic Developments
8.8.Lyncée Tec SA
8.8.1. Business Overview
8.8.2. Product Portfolio
8.8.3. Strategic Developments
8.9.Phase Holographic Imaging PHI AB
8.9.1. Business Overview
8.9.2. Product Portfolio
8.9.3. Strategic Developments
8.10.RealView Imaging Ltd.
8.10.1.Business Overview
8.10.2.Product Portfolio
8.10.3.Strategic Developments
List of Tables
Table 1.Medical Holography Market, By Product ($Million), 2017-2025
Table 2.Holographic Displays Market, By Type ($Million), 2017-2025
Table 3.Holographic Displays Market, By Region ($Million), 2017-2025
Table 4.Touchable Displays Market, By Region ($Million), 2017-2025
Table 5.Laser Displays Market, By Region ($Million), 2017-2025
Table 6.Semi-transparent Displays Market, By Region ($Million), 2017-2025
Table 7.Piston Displays Market, By Region ($Million), 2017-2025
Table 8.Holographic Prints Market, By Region ($Million), 2017-2025
Table 9.Holographic Microscopes Market, By Region ($Million), 2017-2025
Table 10.Holographic Software Market, By Region ($Million), 2017-2025
Table 11.Other Holography Products Market, By Region ($Million), 2017-2025
Table 12.Medical Holography Market, By Application ($Million), 2017-2025
Table 13.Biomedical Research Market, By Region ($Million), 2017-2025
Table 14.Medical Imaging Market, By Region ($Million), 2017-2025
Table 15.Medical Education Market, By Region ($Million), 2017-2025
Table 16.Medical Holography Market, By End User ($Million), 2017-2025
Table 17.Academic Medical Centers Market, By Region ($Million), 2017-2025
Table 18.Research Laboratories Market, By Region ($Million), 2017-2025
Table 19.Hospitals and Clinics Market, By Region ($Million), 2017-2025
Table 20.Pharmaceutical and Biotechnology Companies Market, By Region ($Million), 2017-2025
Table 21.Global Medical Holography Market, By Region ($Million), 2017-2025
Table 22.NorthAmerica Medical Holography Market, By Country, 2017-2025 ($Million)
Table 23.North America Medical Holography Market, By Product, 2017-2025 ($Million)
Table 24.North America Medical Holography Market, By Application, 2017-2025 ($Million)
Table 25.North America Medical Holography Market, By End User, 2017-2025 ($Million)
Table 26.U.S. Medical Holography Market, By Product, 2017-2025 ($Million)
Table 27.U.S. Medical Holography Market, By Application, 2017-2025 ($Million)
Table 28.U.S. Medical Holography Market, By End User, 2017-2025 ($Million)
Table 29.Canada Medical Holography Market, By Product, 2017-2025 ($Million)
Table 30.Canada Medical Holography Market, By Application, 2017-2025 ($Million)
Table 31.Canada Medical Holography Market, By End User, 2017-2025 ($Million)
Table 32.Mexico Medical Holography Market, By Product, 2017-2025 ($Million)
Table 33.Mexico Medical Holography Market, By Application, 2017-2025 ($Million)
Table 34.Mexico Medical Holography Market, By End User, 2017-2025 ($Million)
Table 35.Europe Medical Holography Market, By Country, 2017-2025 ($Million)
Table 36.Europe Medical Holography Market, By Product, 2017-2025 ($Million)
Table 37.Europe Medical Holography Market, By Application, 2017-2025 ($Million)
Table 38.Europe Medical Holography Market, By End User, 2017-2025 ($Million)
Table 39.Germany Medical Holography Market, By Product, 2017-2025 ($Million)
Table 40.Germany Medical Holography Market, By Application, 2017-2025 ($Million)
Table 41.Germany Medical Holography Market, By End User, 2017-2025 ($Million)
Table 42.France Medical Holography Market, By Product, 2017-2025 ($Million)
Table 43.France Medical Holography Market, By Application, 2017-2025 ($Million)
Table 44.France Medical Holography Market, By End User, 2017-2025 ($Million)
Table 45.UK Medical Holography Market, By Product, 2017-2025 ($Million)
Table 46.UK Medical Holography Market, By Application, 2017-2025 ($Million)
Table 47.UK Medical Holography Market, By End User, 2017-2025 ($Million)
Table 48.Italy Medical Holography Market, By Product, 2017-2025 ($Million)
Table 49.Italy Medical Holography Market, By Application, 2017-2025 ($Million)
Table 50.Italy Medical Holography Market, By End User, 2017-2025 ($Million)
Table 51.Spain Medical Holography Market, By Product, 2017-2025 ($Million)
Table 52.Spain Medical Holography Market, By Application, 2017-2025 ($Million)
Table 53.Spain Medical Holography Market, By End User, 2017-2025 ($Million)
Table 54.Russia Medical Holography Market, By Product, 2017-2025 ($Million)
Table 55.Russia Medical Holography Market, By Application, 2017-2025 ($Million)
Table 56.Russia Medical Holography Market, By End User, 2017-2025 ($Million)
Table 57.Rest of Europe Medical Holography Market, By Product, 2017-2025 ($Million)
Table 58.Rest of Europe Medical Holography Market, By Application, 2017-2025 ($Million)
Table 59.Rest of Europe Medical Holography Market, By End User, 2017-2025 ($Million)
Table 60.Asia-Pacific Diabetes Devices Market, By Country, 2017-2025 ($Million)
Table 61.Asia-Pacific Medical Holography Market, By Product, 2017-2025 ($Million)
Table 62.Asia-Pacific Medical Holography Market, By Application, 2017-2025 ($Million)
Table 63.Asia-Pacific Medical Holography Market, By End User, 2017-2025 ($Million)
Table 64.Japan Medical Holography Market, By Product, 2017-2025 ($Million)
Table 65.Japan Medical Holography Market, By Application, 2017-2025 ($Million)
Table 66.Japan Medical Holography Market, By End User, 2017-2025 ($Million)
Table 67.China Medical Holography Market, By Product, 2017-2025 ($Million)
Table 68.China Medical Holography Market, By Application, 2017-2025 ($Million)
Table 69.China Medical Holography Market, By End User, 2017-2025 ($Million)
Table 70.Australia Medical Holography Market, By Product, 2017-2025 ($Million)
Table 71.Australia Medical Holography Market, By Application, 2017-2025 ($Million)
Table 72.Australia Medical Holography Market, By End User, 2017-2025 ($Million)
Table 73.India Medical Holography Market, By Product, 2017-2025 ($Million)
Table 74.India Medical Holography Market, By Application, 2017-2025 ($Million)
Table 75.India Medical Holography Market, By End User, 2017-2025 ($Million)
Table 76.South Korea Medical Holography Market, By Product, 2017-2025 ($Million)
Table 77.South Korea Medical Holography Market, By Application, 2017-2025 ($Million)
Table 78.South Korea Medical Holography Market, By End User, 2017-2025 ($Million)
Table 79.Taiwan Medical Holography Market, By Product, 2017-2025 ($Million)
Table 80.Taiwan Medical Holography Market, By Application, 2017-2025 ($Million)
Table 81.Taiwan Medical Holography Market, By End User, 2017-2025 ($Million)
Table 82.Rest of Asia-Pacific Medical Holography Market, By Product, 2017-2025 ($Million)
Table 83.Rest of Asia-Pacific Medical Holography Market, By Application, 2017-2025 ($Million)
Table 84.Rest of Asia-Pacific Medical Holography Market, By End User, 2017-2025 ($Million)
Table 85.Rest of the World Medical Holography Market, By Country, 2017-2025 ($Million)
Table 86.Rest of the World Medical Holography Market, By Product, 2017-2025 ($Million)
Table 87.Rest of the World Medical Holography Market, By Application, 2017-2025 ($Million)
Table 88.Rest of the World Medical Holography Market, By End User, 2017-2025 ($Million)
Table 89.Brazil Medical Holography Market, By Product, 2017-2025 ($Million)
Table 90.Brazil Medical Holography Market, By Application, 2017-2025 ($Million)
Table 91.Brazil Medical Holography Market, By End User, 2017-2025 ($Million)
Table 92.Turkey Medical Holography Market, By Product, 2017-2025 ($Million)
Table 93.Turkey Medical Holography Market, By Application, 2017-2025 ($Million)
Table 94.Turkey Medical Holography Market, By End User, 2017-2025 ($Million)
Table 95.Saudi Arabia Medical Holography Market, By Product, 2017-2025 ($Million)
Table 96.Saudi Arabia Medical Holography Market, By Application, 2017-2025 ($Million)
Table 97.Saudi Arabia Medical Holography Market, By End User, 2017-2025 ($Million)
Table 98.South Africa Medical Holography Market, By Product, 2017-2025 ($Million)
Table 99.South Africa Medical Holography Market, By Application, 2017-2025 ($Million)
Table 100.South Africa Medical Holography Market, By End User, 2017-2025 ($Million)
Table 101.United Arab Emirates Medical Holography Market, By Product, 2017-2025 ($Million)
Table 102.United Arab Emirates Medical Holography Market, By Application, 2017-2025 ($Million)
Table 103.United Arab Emirates Medical Holography Market, By End User, 2017-2025 ($Million)
Table 104.Others Medical Holography Market, By Product, 2017-2025 ($Million)
Table 105.Others Medical Holography Market, By Application, 2017-2025 ($Million)
Table 106.Others Medical Holography Market, By End User, 2017-2025 ($Million)
Table 107.EchoPixel, Inc.: Key Strategic Developments, 2017-2017
Table 108.Ovizio Imaging Systems NV/SA: Key Strategic Developments, 2017-2017
Table 109.zSpace, Inc.: Key Strategic Developments, 2017-2017
Table 110.Holoxica Limited: Key Strategic Developments, 2017-2017
Table 111.Holografika Kft: Key Strategic Developments, 2017-2017
Table 112.Nanolive SA: Key Strategic Developments, 2017-2017
Table 113.Zebra Imaging: Key Strategic Developments, 2017-2017
Table 114.Lyncée Tec SA: Key Strategic Developments, 2017-2017
Table 115.Phase Holographic Imaging PHI AB: Key Strategic Developments, 2017-2017
Table 116.RealView Imaging Ltd.: Key Strategic Developments, 2017-2017
List of Figures
Figure 1.Global Medical Holography Market Share, By Product, 2017 & 2025 ($Million)
Figure 2Medical Holography Market Share, By Application, 2017 & 2025 ($Million)
Figure 3.Medical Holography Market Share, By End User, 2017 & 2025 ($Million)
Figure 4.Medical Holography Market, By Region, 2017 & 2025 ($Million)
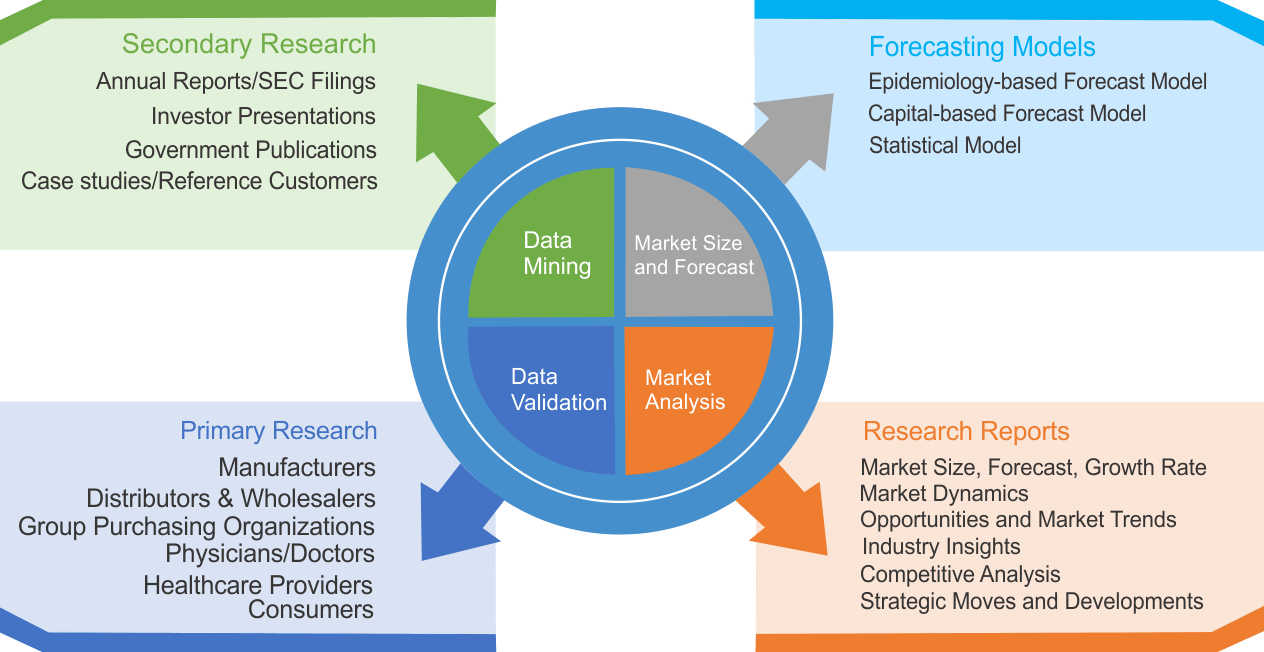
Research Methodology
We use both primary as well as secondary research for our market surveys, estimates and for developing forecast. Our research process commence by analyzing the problem which enable us to design the scope for our research study. Our research process is uniquely designed with enough flexibility to adjust according to changing nature of products and markets, while retaining core element to ensure reliability and accuracy in research findings. We understand both macro and micro-economic factors to evaluate and forecast different market segments.
Data Mining
Data is extensively collected through various secondary sources such as annual reports, investor presentations, SEC filings, and other corporate publications. We also refer trade magazines, technical journals, paid databases such as Factiva and Bloomberg, industry trade journals, scientific journals, and social media data to understand market dynamics and industry trends. Further, we also conduct primary research to understand market drivers, restraints, opportunities, challenges, and competitive scenario to build our analysis.
Data Collection Matrix
|
Data Collection Matrix |
Supply Side |
Demand Side |
|
Primary Data Sources |
|
|
|
Secondary Data Sources |
|
|
Market Modeling and Forecasting
We use epidemiology and capital equipment-based models to forecast market size of different segments at country and regional level.
- Epidemiology-based Forecasting Model: This method uses epidemiology data gathered through various publications and from physicians to estimate population of patients, flow of treatment of individual disease and therapies. The data collected through this method includes statics on incidence of disease, population suffering from disease, and treatment population. This method is used to understand:
- Number of patients for particular device or medical procedure and
- Repeated use of particular device depending on health and condition of patient
- Capital-based Forecasting Model: This method of forecasting is based on number of replacements, installed-based and new sales of capital equipment used in various healthcare and diagnostic centers. These three parameters are calculated and forecast is developed. Installation base is calculated as average number of units per facility; while sales for particular year is calculated from number of new and replace units. Secondary data is collected through various supply chain intermediaries and opinion leaders to arrive at installation and sales rate. These techniques help our analysts in validating market and developed market estimates and forecast.
We do forecast on basis of several parameters such as market drivers, market opportunities, industry trends government regulations, raw materials supply and trade dynamics to ensure relevance of forecast with market scenario. With increasing need to granulized information, we used bottom-up methodology for forecasting where we evaluate each regional segment differently and combined all forecast to develop final market forecast.
Data Validation
We believe primary research is a very important tool in analyzing and forecasting different markets. In order to make sure accuracy of our findings, our team conducts primary interviews at every stage of research to gain deep insights into current business environment and future trends and key developments in market. This includes use of various methods such as telephonic interviews, focus groups, face to face interviews and questionnaires to validate our research from all aspects. We validate our data through primary research from key industry leaders such as CEO, product managers, marketing managers, suppliers, distributors, and consumers are frequently interviewed. These interviews provide valuable insights which help us to have better market understanding besides validating our estimates and forecast.
Data Triangulation
Industry Analysis
|
Qualitative Data |
Quantitative Data (2017-2025) |
|
|