.png)
Intumescent Coatings Market by Technology, End-user and Application - Global Industry Analysis and Forecast to 2022
Published On : November 2017 Pages : 125 Category: Paints and Coatings Report Code : CM11326
SEGMENTS & REGIONS:
- Regions: North America, Europe, Asia- Pacific, Latin America, Middle East & Africa
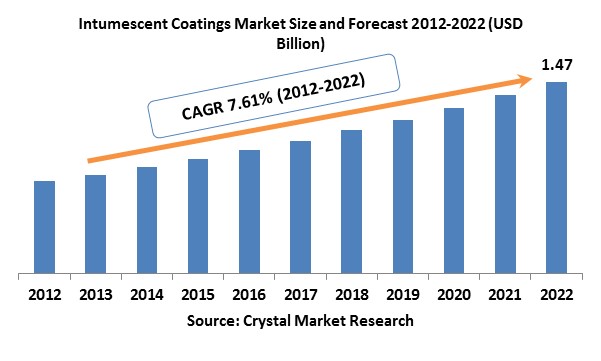
Industry Trend Analysis
The global Intumescent coating market was evaluated around USD billion in the 2017 and is expected to reach approximately USD billion by the end of 2022 while registering itself at a compound annual growth rate (CAGR) of % over the forecast period owing to rising spending on construction by the customers in Asia Pacific region. Additionally, rising urbanization in this region along with rising implementation of passive fire protection is predicted to boost the growth. The market is expected to demonstrate growth owing to increasing shale gas exploration activities propelled by the advanced technological development including horizontal and hydraulic drilling. Moreover, expansion in the shale gas industrial application in various industries such as oil & gas, power, and manufacturing is projected to assist the global intumescent coatings market growth. The growth of automotive and aerospace industry along with rising demand for fireproof commercial and residential structures is anticipated to impact the regional market of the United States positively. Furthermore, rising funding for shale gas discovery in the country is likely to drive the demand for the next few years. The intumescent coatings demand is projected to be fueled by the obligation of the strict fire safety norms around the world. Also, the advent of the advanced, light-weight and thin film intumescent coatings by a key manufacturer is likely to benefit the global market.
Technology Outlook and Trend Analysis
In 2017, water-based intumescent coatings market was expected at around % of the global market consumption owing to rising demand in inside applications fueled by superior flame retardant properties. Additionally, growing demand for the product due to the superior finish of the coating, faster drying time and absence of VOCs, is prone to boost the market growth during the forecast years. The requirement for solvent-based intumescent coatings is propelled by utilization in off-site applications where humidity and heat resistance establish fundamental parameters for the preference of coatings. Though, adverse characteristics of the products like higher price and elevated VOC content is anticipated to restrict the global market growth during the next few years.
End-user Outlook and Trend Analysis
In 2017, the utilization of the intumescent coatings in construction business reported for around % of the global market revenue owing to rapid infrastructural expansion in the emerging economies. Moreover, rising awareness about personal safety amongst consumers along with the increasing emphasis by regulatory organizations to execute fire protection inside the buildings is anticipated to benefit the global market growth. The rising product use for coating structural materials like composites in first-class vehicles is estimated to fuel the growth of the global market during the forecast years.
Application Outlook and Trend Analysis
The application for safety against cellulosic fires is anticipated to grow at a compound annual growth rate of around % over forecast period because of the construction industry growth, mainly in Asia Pacific region. The requirement for such coatings is from commercial and an industrial organization is likely to appear as the key growth driving factor during the forecast years. Strict fire safety standards mandated by several regulatory systems are projected to boost the product demand over the next few years. Besides, utilization of hydrocarbon intumescent coatings in oil & gas refinery plants and exploration process as a fire retardant previous to the initiation of operations is projected to fuel the market growth.
Regional Outlook and Trend Analysis
Asia Pacific regional market is anticipated to maintain high growth owing to the speedy development of the oil & gas market in this region. Additionally, rising construction in the emerging countries such as China and India is projected to direct to an elevated demand for the product contributing to the market growth. The market demand in China is likely to grow at a compound annual growth rate of over % over the forecast period due to high demand from the increasing construction industry. Also, the expansion of the automotive and aerospace industry in the country is also estimated to boost the growth. The European market is expected to demonstrate a modest growth owing to high market development. Though, the development of sophisticated products along with growing affinity of the automobile producers towards the utilization of the product is anticipated to fuel the growth of the global market.
Competitive Outlook and Trend Analysis
The global intumescent coatings market is distinguished by the existence of key multinational companies involved in strategies like new product development and mergers & acquisitions to enhance their business. The companies also deposit high prominence on cost discrimination as a key strategy engaged in order to increase industry share. The market demonstrates an elevated degree of integration over the value chain with the companies that are merged backward to the raw materials production and forward to the distribution and supply of the product to the end-user markets. Major market players in the global market are; Jotun, Sherwin-Williams, Carboline, Albi Manufacturing, Akzo Nobel N.V, Hempel A/S, Null Fire, PPG Industries, Inc., Contego International, 3M, Flame Control, Crown Paints, and Rudolf Hensel GmbH.
The global intumescent coatings market is segmented as follows –
By Technology
- Water Based
- Solvent Based
- Epoxy Based
By End-user
- Oil & Gas
- Construction
- Automotive
- Others
By Application
- Hydrocarbons
- Cellulosic
By Region
- North America
- U.S
- Canada
- Mexico
- Europe
- Germany
- France
- UK
- Italy
- Spain
- Rest of Europe
- Asia-Pacific
- Japan
- China
- Australia
- India
- South Korea
- Rest of Asia Pacific
- Rest of the World
- Brazil
- South Africa
- Saudi Arabia
- United Arab Emirates
- Others
Some of the key questions answered by the report are:
- What was the market size in 2017 and forecast from 2017 to 2022?
- What will be the industry market growth from 2017 to 2022?
- What are the major drivers, restraints, opportunities, challenges, and industry trends and their impact on the market forecast?
- What are the major segments leading the market growth and why?
- Which are the leading players in the market and what are the major strategies adopted by them to sustain the market competition?
Market Classification
- Intumescent Coatings Market, By Technology, Estimates and Forecast, 2012-2022 ($Billion)
- Water Based
- Solvent Based
- Epoxy Based
- Intumescent Coatings Market, By Application, Estimates and Forecast, 2012-2022 ($Billion)
- Hydrocarbons
- Cellulosic
- Intumescent Coatings Market, By End User, Estimates and Forecast, 2012-2022 ($Billion)
- Oil & Gas
- Construction
- Automotive
- Others
- Intumescent Coatings Market, By Region, Estimates and Forecast, 2012-2022 ($Billion)
- North America
- North America Intumescent Coatings Market, By Country
- North America Intumescent Coatings Market, By Technology
- North America Intumescent Coatings Market, By Application
- North America Intumescent Coatings Market, By End User
- U.S. Intumescent Coatings Market, By Technology
- U.S. Intumescent Coatings Market, By Application
- U.S. Intumescent Coatings Market, By End User
- Canada Intumescent Coatings Market, By Technology
- Canada Intumescent Coatings Market, By Application
- Canada Intumescent Coatings Market, By End User
- Mexico Intumescent Coatings Market, By Technology
- Mexico Intumescent Coatings Market, By Application
- Mexico Intumescent Coatings Market, By End User
-
- Europe
- Europe Intumescent Coatings Market, By Country
- Europe Intumescent Coatings Market, By Technology
- Europe Intumescent Coatings Market, By Application
- Europe Intumescent Coatings Market, By End User
- Germany Intumescent Coatings Market, By Technology
- Germany Intumescent Coatings Market, By Application
- Germany Intumescent Coatings Market, By End User
- France Intumescent Coatings Market, By Technology
- France Intumescent Coatings Market, By Application
- France Intumescent Coatings Market, By End User
- UK Intumescent Coatings Market, By Technology
- UK Intumescent Coatings Market, By Application
- UK Intumescent Coatings Market, By End User
- Italy Intumescent Coatings Market, By Technology
- Italy Intumescent Coatings Market, By Application
- Italy Intumescent Coatings Market, By End User
- Spain Intumescent Coatings Market, By Technology
- Spain Intumescent Coatings Market, By Application
- Spain Intumescent Coatings Market, By End User
- Rest of Europe Intumescent Coatings Market, By Technology
- Rest of Europe Intumescent Coatings Market, By Application
- Rest of Europe Intumescent Coatings Market, By End User
- Europe
-
- Asia-Pacific
- Asia-Pacific Intumescent Coatings Market, By Country
- Asia-Pacific Intumescent Coatings Market, By Technology
- Asia-Pacific Intumescent Coatings Market, By Application
- Asia-Pacific Intumescent Coatings Market, By End User
- Japan Intumescent Coatings Market, By Technology
- Japan Intumescent Coatings Market, By Application
- Japan Intumescent Coatings Market, By End User
- Australia Intumescent Coatings Market, By Technology
- Australia Intumescent Coatings Market, By Application
- Australia Intumescent Coatings Market, By End User
- India Intumescent Coatings Market, By Technology
- India Intumescent Coatings Market, By Application
- India Intumescent Coatings Market, By End User
- South Korea Intumescent Coatings Market, By Technology
- South Korea Intumescent Coatings Market, By Application
- South Korea Intumescent Coatings Market, By End User
- Rest of Asia-Pacific Intumescent Coatings Market, By Technology
- Rest of Asia-Pacific Intumescent Coatings Market, By Application
- Rest of Asia-Pacific Intumescent Coatings Market, By End User
- Asia-Pacific
-
- Rest of the World
- Rest of the World Intumescent Coatings Market, By Country
- Rest of the World Intumescent Coatings Market, By Technology
- Rest of the World Intumescent Coatings Market, By Application
- Rest of the World Intumescent Coatings Market, By End User
- Brazil Intumescent Coatings Market, By Technology
- Brazil Intumescent Coatings Market, By Application
- Brazil Intumescent Coatings Market, By End User
- South Africa Intumescent Coatings Market, By Technology
- South Africa Intumescent Coatings Market, By Application
- South Africa Intumescent Coatings Market, By End User
- Saudi Arabia Intumescent Coatings Market, By Technology
- Saudi Arabia Intumescent Coatings Market, By Application
- Saudi Arabia Intumescent Coatings Market, By End User
- Turkey Intumescent Coatings Market, By Technology
- Turkey Intumescent Coatings Market, By Application
- Turkey Intumescent Coatings Market, By End User
- United Arab Emirates Intumescent Coatings Market, By Technology
- United Arab Emirates Intumescent Coatings Market, By Application
- United Arab Emirates Intumescent Coatings Market, By End User
- Others Intumescent Coatings Market, By Technology
- Others Intumescent Coatings Market, By Application
- Others Intumescent Coatings Market, By End User
- Rest of the World
Table of Contents
1. Introduction
1.1. Report Description
1.2. Research Methodology
1.2.1. Secondary Research
1.2.2. Primary Research
2. Executive Summary
2.1. Key Highlights
3. Market Overview
3.1. Introduction
3.1.1. Market Definition
3.1.2. Market Segmentation
3.2. Market Dynamics
3.2.1. Drivers
3.2.1.1. Growth in oil & gas exploration activities
3.2.1.2. Increased infrastructure spending
3.2.1.3. Positive shale gas extraction outlook
3.2.2. Restraints
3.2.2.1. Volatile raw material price trends
3.2.3. Opportunities
3.2.3.1. Emerging Countries to Offer Lucrative Growth Opportunities
4. Intumescent Coatings Market, By Technology
4.1. Introduction
4.2. Intumescent Coatings Market Assessment and Forecast, By Technology, 2012-2022
4.3. Water Based
4.3.1. Market Assessment and Forecast, By Region, 2012-2022 ($Billion)
4.4. Solvent Based
4.4.1. Market Assessment and Forecast, By Region, 2012-2022 ($Billion)
4.5. Epoxy Based
4.5.1. Market Assessment and Forecast, By Region, 2012-2022 ($Billion)
5. Intumescent Coatings Market, By Application
5.1. Introduction
5.2. Intumescent Coatings Market Assessment and Forecast, By Application, 2012-2022
5.3. Hydrocarbons
5.3.1. Market Assessment and Forecast, By Region, 2012-2022 ($Billion)
5.4. Cellulosic
5.4.1. Market Assessment and Forecast, By Region, 2012-2022 ($Billion)
6. Intumescent Coatings Market, By End User
6.1. Introduction
6.2. Intumescent Coatings Market Assessment and Forecast, By End User, 2012-2022 ($Billion)
6.3. Oil & Gas
6.3.1. Market Assessment and Forecast, By Region, 2012-2022 ($Billion)
6.4. Construction
6.4.1. Market Assessment and Forecast, By Region, 2012-2022 ($Billion)
6.5. Automotive
6.5.1. Market Assessment and Forecast, By Region, 2012-2022 ($Billion)
6.6. Other End Users
6.6.1. Market Assessment and Forecast, By Region, 2012-2022 ($Billion)
7. Intumescent Coatings Market, By Region
7.1. Introduction
7.2. Intumescent Coatings Market Assessment and Forecast, By Region, 2012-2022 ($Billion)
7.3. North America
7.3.1. Market Assessment and Forecast, By Country, 2012-2022 ($Billion)
7.3.2. Market Assessment and Forecast, By Technology, 2012-2022 ($Billion)
7.3.3. Market Assessment and Forecast, By Application, 2012-2022 ($Billion)
7.3.4. Market Assessment and Forecast, By End User, 2012-2022 ($Billion)
7.3.5. U.S.
7.3.5.1.1. Market Assessment and Forecast, By Technology, 2012-2022 ($Billion)
7.3.5.1.2. Market Assessment and Forecast, By Application, 2012-2022 ($Billion)
7.3.5.1.3. Market Assessment and Forecast, By End User, 2012-2022 ($Billion)
7.3.5.2. Canada
7.3.5.2.1. Market Assessment and Forecast, By Technology, 2012-2022 ($Billion)
7.3.5.2.2. Market Assessment and Forecast, By Application, 2012-2022 ($Billion)
7.3.5.2.3. Market Assessment and Forecast, By End User, 2012-2022 ($Billion)
7.3.5.3. Mexico
7.3.5.3.1. Market Assessment and Forecast, By Technology, 2012-2022 ($Billion)
7.3.5.3.2. Market Assessment and Forecast, By Application, 2012-2022 ($Billion)
7.3.5.3.3. Market Assessment and Forecast, By End User, 2012-2022 ($Billion)
7.4. Europe
7.4.1. Market Assessment and Forecast, By Country, 2012-2022 ($Billion)
7.4.2. Market Assessment and Forecast, By Technology, 2012-2022 ($Billion)
7.4.3. Market Assessment and Forecast, By End User, 2012-2022 ($Billion)
7.4.4. Market Assessment and Forecast, By End User, 2012-2022 ($Billion)
7.4.5. Germany
7.4.5.1.1. Market Assessment and Forecast, By Technology, 2012-2022 ($Billion)
7.4.5.1.2. Market Assessment and Forecast, By Application, 2012-2022 ($Billion)
7.4.5.1.3. Market Assessment and Forecast, By End User, 2012-2022 ($Billion)
7.4.6. France
7.4.6.1.1. Market Assessment and Forecast, By Technology, 2012-2022 ($Billion)
7.4.6.1.2. Market Assessment and Forecast, By Application, 2012-2022 ($Billion)
7.4.6.1.3. Market Assessment and Forecast, By End User, 2012-2022 ($Billion)
7.4.7. UK
7.4.7.1.1. Market Assessment and Forecast, By Technology, 2012-2022 ($Billion)
7.4.7.1.2. Market Assessment and Forecast, By Application, 2012-2022 ($Billion)
7.4.7.1.3. Market Assessment and Forecast, By End User, 2012-2022 ($Billion)
7.4.8. Italy
7.4.8.1.1. Market Assessment and Forecast, By Technology, 2012-2022 ($Billion)
7.4.8.1.2. Market Assessment and Forecast, By Application, 2012-2022 ($Billion)
7.4.8.1.3. Market Assessment and Forecast, By End User, 2012-2022 ($Billion)
7.4.9. Spain
7.4.9.1.1. Market Assessment and Forecast, By Technology, 2012-2022 ($Billion)
7.4.9.1.2. Market Assessment and Forecast, By Application, 2012-2022 ($Billion)
7.4.9.1.3. Market Assessment and Forecast, By End User, 2012-2022 ($Billion)
7.4.9.2. Rest of Europe
7.4.9.2.1. Market Assessment and Forecast, By Technology, 2012-2022 ($Billion)
7.4.9.2.2. Market Assessment and Forecast, By Application, 2012-2022 ($Billion)
7.4.9.2.3. Market Assessment and Forecast, By End User, 2012-2022 ($Billion)
8. Asia-Pacific
8.1.1. Market Assessment and Forecast, By Country, 2012-2022 ($Billion)
8.1.2. Market Assessment and Forecast, By Technology, 2012-2022 ($Billion)
8.1.3. Market Assessment and Forecast, By Application, 2012-2022 ($Billion)
8.1.4. Market Assessment and Forecast, By End User, 2012-2022 ($Billion)
8.1.4.1. Japan
8.1.4.1.1. Market Assessment and Forecast, By Technology, 2012-2022 ($Billion)
8.1.4.1.2. Market Assessment and Forecast, By Application, 2012-2022 ($Billion)
8.1.4.1.3. Market Assessment and Forecast, By End User, 2012-2022 ($Billion)
8.1.5. China
8.1.5.1.1. Market Assessment and Forecast, By Technology, 2012-2022 ($Billion)
8.1.5.1.2. Market Assessment and Forecast, By Application, 2012-2022 ($Billion)
8.1.5.1.3. Market Assessment and Forecast, By End User, 2012-2022 ($Billion)
8.1.6. Australia
8.1.6.1.1. Market Assessment and Forecast, By Technology, 2012-2022 ($Billion)
8.1.6.1.2. Market Assessment and Forecast, By Application, 2012-2022 ($Billion)
8.1.6.1.3. Market Assessment and Forecast, By End User, 2012-2022 ($Billion)
8.1.7. India
8.1.7.1.1. Market Assessment and Forecast, By Technology, 2012-2022 ($Billion)
8.1.7.1.2. Market Assessment and Forecast, By Application, 2012-2022 ($Billion)
8.1.7.1.3. Market Assessment and Forecast, By End User, 2012-2022 ($Billion)
8.1.8. South Korea
8.1.8.1.1. Market Assessment and Forecast, By Technology, 2012-2022 ($Billion)
8.1.8.1.2. Market Assessment and Forecast, By Application, 2012-2022 ($Billion)
8.1.8.1.3. Market Assessment and Forecast, By End User, 2012-2022 ($Billion)
8.1.9. Rest of Asia-Pacific
8.1.9.1.1. Market Assessment and Forecast, By Technology, 2012-2022 ($Billion)
8.1.9.1.2. Market Assessment and Forecast, By Application, 2012-2022 ($Billion)
8.1.9.1.3. Market Assessment and Forecast, By End User, 2012-2022 ($Billion)
9. Rest of the World
9.1.1. Market Assessment and Forecast, By Country, 2012-2022 ($Billion)
9.1.2. Market Assessment and Forecast, By Technology, 2012-2022 ($Billion)
9.1.3. Market Assessment and Forecast, By End User, 2012-2022 ($Billion)
9.1.4. Market Assessment and Forecast, By End User, 2012-2022 ($Billion)
9.1.5. Brazil
9.1.5.1.1. Market Assessment and Forecast, By Technology, 2012-2022 ($Billion)
9.1.5.1.2. Market Assessment and Forecast, By Application , 2012-2022 ($Billion)
9.1.5.1.3. Market Assessment and Forecast, By End User, 2012-2022 ($Billion)
9.1.6. Turkey
9.1.6.1.1. Market Assessment and Forecast, By Technology, 2012-2022 ($Billion)
9.1.6.1.2. Market Assessment and Forecast, By Application, 2012-2022 ($Billion)
9.1.6.1.3. Market Assessment and Forecast, By End User, 2012-2022 ($Billion)
9.1.7. Saudi Arabia
9.1.7.1.1. Market Assessment and Forecast, By Technology, 2012-2022 ($Billion)
9.1.7.1.2. Market Assessment and Forecast, By Application, 2012-2022 ($Billion)
9.1.7.1.3. Market Assessment and Forecast, By End User, 2012-2022 ($Billion)
9.1.8. South Africa
9.1.8.1.1. Market Assessment and Forecast, By Technology, 2012-2022 ($Billion)
9.1.8.1.2. Market Assessment and Forecast, By Application, 2012-2022 ($Billion)
9.1.8.1.3. Market Assessment and Forecast, By End User, 2012-2022 ($Billion)
9.1.9. United Arab Emirates
9.1.9.1.1. Market Assessment and Forecast, By Technology, 2012-2022 ($Billion)
9.1.9.1.2. Market Assessment and Forecast, By Application, 2012-2022 ($Billion)
9.1.9.1.3. Market Assessment and Forecast, By End User, 2012-2022 ($Billion)
9.1.10. Others
9.1.10.1.1. Market Assessment and Forecast, By Technology, 2012-2022 ($Billion)
9.1.10.1.2. Market Assessment and Forecast, By Application, 2012-2022 ($Billion)
9.1.10.1.3. Market Assessment and Forecast, By End User, 2012-2022 ($Billion)
10. Company Profiles
10.1. Jotun Group
10.1.1. Business Overview
10.1.2. Product Portfolio
10.1.3. Key Financials
10.1.4. Strategic Developments
10.2. Sherwin-Williams
10.2.1. Business Overview
10.2.2. Product Portfolio
10.2.3. Key Financials
10.2.4. Strategic Developments
10.3. Carboline
10.3.1. Business Overview
10.3.2. Product Portfolio
10.3.3. Key Financials
10.3.4. Strategic Developments
10.4. AkzoNobel
10.4.1. Business Overview
10.4.2. Product Portfolio
10.4.3. Key Financials
10.4.4. Strategic Developments
10.5. Contego International Inc.
10.5.1. Business Overview
10.5.2. Product Portfolio
10.5.3. Strategic Developments
10.6. Hempel Marine Paints
10.6.1. Business Overview
10.6.2. Product Portfolio
10.6.3. Strategic Developments
10.7. No-Burn Inc.
10.7.1. Business Overview
10.7.2. Product Portfolio
10.7.3. Strategic Developments
10.8. Null Fire
10.8.1. Business Overview
10.8.2. Product Portfolio
10.8.3. Strategic Developments
10.9. Albi Manufacturing
10.9.1. Business Overview
10.9.2. Product Portfolio
10.9.3. Strategic Developments
10.10.Leighs Paints
10.10.1. Business Overview
10.10.2. Product Portfolio
10.10.3. Strategic Developments
10.11.Isolatek International
10.11.1. Business Overview
10.11.2. Product Portfolio
10.11.3. Key Financials
10.11.4. Strategic Developments
List of Tables
Table 1.Global Intumescent Coatings Market, By Technology ($Billion), 2012-2022
Table 2.Water Based Market, By Region ($Billion), 2012-2022
Table 3.Solvent Based Market, By Region ($Billion), 2012-2022
Table 4.Epoxy Based Market, By Region ($Billion), 2012-2022
Table 5.Global Intumescent Coatings Market, By Application ($Billion), 2012-2022
Table 6.Hydrocarbons Market, By Region ($Billion), 2012-2022
Table 7.Cellulosic Market, By Region ($Billion), 2012-2022
Table 8.Global Intumescent Coatings Market, By End User ($Billion), 2012-2022
Table 9.Oil & Gas Market, By Region ($Billion), 2012-2022
Table 10.Construction Market, By Region ($Billion), 2012-2022
Table 11.Automotive Market, By Region ($Billion), 2012-2022
Table 12.Other End User Market, By Region ($Billion), 2012-2022
Table 13.North America Intumescent Coatings Market, By Country, 2012-2022 ($Billion)
Table 14.North America Intumescent Coatings Market, By Technology, 2012-2022 ($Billion)
Table 15.North America Intumescent Coatings Market, By Application, 2012-2022 ($Billion)
Table 16.North America Intumescent Coatings Market, By End User, 2012-2022 ($Billion)
Table 17.U.S. Intumescent Coatings Market, By Technology, 2012-2022 ($Billion)
Table 18.U.S. Intumescent Coatings Market, By Application, 2012-2022 ($Billion)
Table 19.U.S. Intumescent Coatings Market, By End User, 2012-2022 ($Billion)
Table 20.Canada Intumescent Coatings Market, By Technology, 2012-2022 ($Billion)
Table 21.Canada Intumescent Coatings Market, By Application, 2012-2022 ($Billion)
Table 22.Canada Intumescent Coatings Market, By End User, 2012-2022 ($Billion)
Table 23.Mexico Intumescent Coatings Market, By Technology, 2012-2022 ($Billion)
Table 24.Mexico Intumescent Coatings Market, By Application, 2012-2022 ($Billion)
Table 25.Mexico Intumescent Coatings Market, By End User, 2012-2022 ($Billion)
Table 26.Europe Intumescent Coatings Market, By Country, 2012-2022 ($Billion)
Table 27.Europe Intumescent Coatings Market, By Technology, 2012-2022 ($Billion)
Table 28.Europe Intumescent Coatings Market, By Application, 2012-2022 ($Billion)
Table 29.Europe Intumescent Coatings Market, By End User, 2012-2022 ($Billion)
Table 30.Germany Intumescent Coatings Market, By Technology, 2012-2022 ($Billion)
Table 31.Germany Intumescent Coatings Market, By Application, 2012-2022 ($Billion)
Table 32.Germany Intumescent Coatings Market, By End User, 2012-2022 ($Billion)
Table 33.France Intumescent Coatings Market, By Technology, 2012-2022 ($Billion)
Table 34.France Intumescent Coatings Market, By Application, 2012-2022 ($Billion)
Table 35.France Intumescent Coatings Market, By End User, 2012-2022 ($Billion)
Table 36.UK Intumescent Coatings Market, By Technology, 2012-2022 ($Billion)
Table 37.UK Intumescent Coatings Market, By Application, 2012-2022 ($Billion)
Table 38.UK Intumescent Coatings Market, By End User, 2012-2022 ($Billion)
Table 39.Italy Intumescent Coatings Market, By Technology, 2012-2022 ($Billion)
Table 40.Italy Intumescent Coatings Market, By Application, 2012-2022 ($Billion)
Table 41.Italy Intumescent Coatings Market, By End User, 2012-2022 ($Billion)
Table 42.Spain Intumescent Coatings Market, By Technology, 2012-2022 ($Billion)
Table 43.Spain Intumescent Coatings Market, By Application, 2012-2022 ($Billion)
Table 44.Spain Intumescent Coatings Market, By End User, 2012-2022 ($Billion)
Table 45.Rest of Europe Intumescent Coatings Market, By Technology, 2012-2022 ($Billion)
Table 46.Rest of Europe Intumescent Coatings Market, By Application, 2012-2022 ($Billion)
Table 47.Rest of Europe Intumescent Coatings Market, By End User, 2012-2022 ($Billion)
Table 48.Asia-Pacific Intumescent Coatings Market, By Country, 2012-2022 ($Billion)
Table 49.Asia-Pacific Intumescent Coatings Market, By Technology, 2012-2022 ($Billion)
Table 50.Asia-Pacific Intumescent Coatings Market, By Application, 2012-2022 ($Billion)
Table 51.Asia-Pacific Intumescent Coatings Market, By End User, 2012-2022 ($Billion)
Table 52.Japan Intumescent Coatings Market, By Technology, 2012-2022 ($Billion)
Table 53.Japan Intumescent Coatings Market, By Application, 2012-2022 ($Billion)
Table 54.Japan Intumescent Coatings Market, By End User, 2012-2022 ($Billion)
Table 55.China Intumescent Coatings Market, By Technology, 2012-2022 ($Billion)
Table 56.China Intumescent Coatings Market, By Application, 2012-2022 ($Billion)
Table 57.China Intumescent Coatings Market, By End User, 2012-2022 ($Billion)
Table 58.Australia Intumescent Coatings Market, By Technology, 2012-2022 ($Billion)
Table 59.Australia Intumescent Coatings Market, By Application, 2012-2022 ($Billion)
Table 60.Australia Intumescent Coatings Market, By End User, 2012-2022 ($Billion)
Table 61.India Intumescent Coatings Market, By Technology, 2012-2022 ($Billion)
Table 62.India Intumescent Coatings Market, By Application, 2012-2022 ($Billion)
Table 63.India Intumescent Coatings Market, By End User, 2012-2022 ($Billion)
Table 64.South Korea Intumescent Coatings Market, By Technology, 2012-2022 ($Billion)
Table 65.South Korea Intumescent Coatings Market, By Application, 2012-2022 ($Billion)
Table 66.South Korea Intumescent Coatings Market, By End User, 2012-2022 ($Billion)
Table 67.Rest of Asia-Pacific Intumescent Coatings Market, By Technology, 2012-2022 ($Billion)
Table 68.Rest of Asia-Pacific Intumescent Coatings Market, By Application, 2012-2022 ($Billion)
Table 69.Rest of Asia-Pacific Intumescent Coatings Market, By End User, 2012-2022 ($Billion)
Table 70.Rest of the World Intumescent Coatings Market, By Country, 2012-2022 ($Billion)
Table 71.Rest of the World Intumescent Coatings Market, By Technology, 2012-2022 ($Billion)
Table 72.Rest of the World Intumescent Coatings Market, By Application, 2012-2022 ($Billion)
Table 73.Rest of the World Intumescent Coatings Market, By End User, 2012-2022 ($Billion)
Table 74.Brazil Intumescent Coatings Market, By Technology, 2012-2022 ($Billion)
Table 75.Brazil Intumescent Coatings Market, By Application, 2012-2022 ($Billion)
Table 76.Brazil Intumescent Coatings Market, By End User, 2012-2022 ($Billion)
Table 77.Turkey Intumescent Coatings Market, By Technology, 2012-2022 ($Billion)
Table 78.Turkey Intumescent Coatings Market, By Application, 2012-2022 ($Billion)
Table 79.Turkey Intumescent Coatings Market, By End User, 2012-2022 ($Billion)
Table 80.Saudi Arabia Intumescent Coatings Market, By Technology, 2012-2022 ($Billion)
Table 81.Saudi Arabia Intumescent Coatings Market, By Application, 2012-2022 ($Billion)
Table 82.Saudi Arabia Intumescent Coatings Market, By End User, 2012-2022 ($Billion)
Table 83.South Africa Intumescent Coatings Market, By Technology, 2012-2022 ($Billion)
Table 84.South Africa Intumescent Coatings Market, By Application, 2012-2022 ($Billion)
Table 85.South Africa Intumescent Coatings Market, By End User, 2012-2022 ($Billion)
Table 86.United Arab Emirates Intumescent Coatings Market, By Technology, 2012-2022 ($Billion)
Table 87.United Arab Emirates Intumescent Coatings Market, By Application, 2012-2022 ($Billion)
Table 88.United Arab Emirates Intumescent Coatings Market, By End User, 2012-2022 ($Billion)
Table 89.Others Intumescent Coatings Market, By Technology, 2012-2022 ($Billion)
Table 90.Others Intumescent Coatings Market, By Application, 2012-2022 ($Billion)
Table 91.Others Intumescent Coatings Market, By End User, 2012-2022 ($Billion)
Table 92.Jotun Group Key Strategic Developments, 2017-2017
Table 93.Contego International Inc.: Key Strategic Developments, 2017-2017
Table 94.AkzoNobel: Key Strategic Developments, 2017-2017
Table 95.Hempel Marine Paints: Key Strategic Developments, 2017-2017
Table 96.No-Burn Inc.: Key Strategic Developments, 2017-2017
Table 97.Null Fire: Key Strategic Developments, 2017-2017
Table 98.Carboline: Key Strategic Developments, 2017-2017
Table 99.Albi Manufacturing: Key Strategic Developments, 2017-2017
Table 100.Leighs Paints: Key Strategic Developments, 2017-2017
Table 101.Isolatek International: Key Strategic Developments, 2017-2017
List of Figures
Figure 1.Intumescent Coatings Market Share, By Technology, 2017 & 2025 ($Billion)
Figure 2.Intumescent Coatings Market, By Application, 2017 & 2025 ($Billion)
Figure 3.Intumescent Coatings Market, By End User, 2017 & 2025 ($Billion)
Figure 4.Intumescent Coatings Market, By Region, 2017, ($Billion)
Figure 5.Jotun Group: Net Revenues, 2017-2017 ($Billion)
Figure 6.Jotun Group: Net Revenue Share, By Segment, 2017
Figure 7.Jotun Group: Net Revenue Share, By Geography, 2017
Figure 8.Sherwin-Williams: Net Revenues, 2017-2017 ($Billion)
Figure 9.Sherwin-Williams: Net Revenue Share, By Segment, 2017
Figure 10.Sherwin-Williams: Net Revenue Share, By Geography, 2017
Figure 11.AkzoNobel: Net Revenues, 2017-2017 ($Billion)
Figure 12.AkzoNobel: Net Revenue Share, By Segment, 2017
Figure 13.AkzoNobel: Net Revenue Share, By Geography, 2017
Figure 14.Carboline: Net Revenues, 2017-2017 ($Billion)
Figure 15.Carboline: Net Revenue Share, By Segment, 2017
Figure 16.Carboline: Net Revenue Share, By Geography, 2017
Figure 14.Isolatek International: Net Revenues, 2017-2017 ($Billion)
Figure 15.Isolatek International: Net Revenue Share, By Segment, 2017
Figure 16.Isolatek International: Net Revenue Share, By Geography, 2017
Research Methodology
We use both primary as well as secondary research for our market surveys, estimates and for developing forecast. Our research process commence by analyzing the problem which enable us to design the scope for our research study. Our research process is uniquely designed with enough flexibility to adjust according to changing nature of products and markets, while retaining core element to ensure reliability and accuracy in research findings. We understand both macro and micro-economic factors to evaluate and forecast different market segments.
Data Mining
Data is extensively collected through various secondary sources such as annual reports, investor presentations, SEC filings, and other corporate publications. We also refer trade magazines, technical journals, paid databases such as Factiva and Bloomberg, industry trade journals, scientific journals, and social media data to understand market dynamics and industry trends. Further, we also conduct primary research to understand market drivers, restraints, opportunities, challenges, and competitive scenario to build our analysis.
Data Collection Matrix
|
Data Collection Matrix |
Supply Side |
Demand Side |
|
Primary Data Sources |
|
|
|
Secondary Data Sources |
|
|
Market Modeling and Forecasting
We use epidemiology and capital equipment-based models to forecast market size of different segments at country and regional level.
- Epidemiology-based Forecasting Model: This method uses epidemiology data gathered through various publications and from physicians to estimate population of patients, flow of treatment of individual disease and therapies. The data collected through this method includes statics on incidence of disease, population suffering from disease, and treatment population. This method is used to understand:
- Number of patients for particular device or medical procedure and
- Repeated use of particular device depending on health and condition of patient
- Capital-based Forecasting Model: This method of forecasting is based on number of replacements, installed-based and new sales of capital equipment used in various healthcare and diagnostic centers. These three parameters are calculated and forecast is developed. Installation base is calculated as average number of units per facility; while sales for particular year is calculated from number of new and replace units. Secondary data is collected through various supply chain intermediaries and opinion leaders to arrive at installation and sales rate. These techniques help our analysts in validating market and developed market estimates and forecast.
We do forecast on basis of several parameters such as market drivers, market opportunities, industry trends government regulations, raw materials supply and trade dynamics to ensure relevance of forecast with market scenario. With increasing need to granulized information, we used bottom-up methodology for forecasting where we evaluate each regional segment differently and combined all forecast to develop final market forecast.
Data Validation
We believe primary research is a very important tool in analyzing and forecasting different markets. In order to make sure accuracy of our findings, our team conducts primary interviews at every stage of research to gain deep insights into current business environment and future trends and key developments in market. This includes use of various methods such as telephonic interviews, focus groups, face to face interviews and questionnaires to validate our research from all aspects. We validate our data through primary research from key industry leaders such as CEO, product managers, marketing managers, suppliers, distributors, and consumers are frequently interviewed. These interviews provide valuable insights which help us to have better market understanding besides validating our estimates and forecast.
Data Triangulation

Industry Analysis
|
Qualitative Data |
Quantitative Data (2017-2025) |
|
|