.png)
Intelligent Virtual Assistant (IVA) Market By Technology, Service, End User and Application - Global Industry Analysis and Forecast to 2022
Published On : November 2017 Pages : 150 Category: Emerging & Next Generation Technologies Report Code : SE11333
SEGMENTS & REGIONS:
- Regions: North America, Europe, Asia- Pacific, Latin America, Middle East & Africa
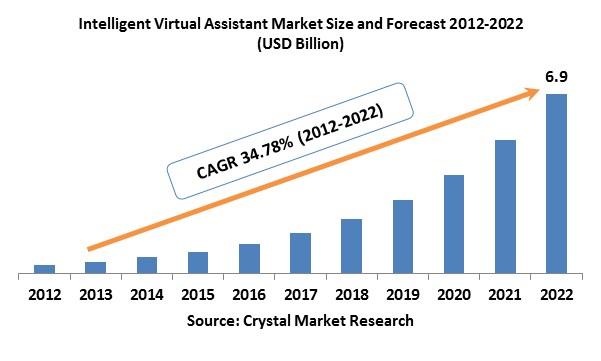
Industry Trend Analysis
The global Intelligent Virtual Assistant (IVA) market was evaluated around USD billion in the 2017 and is expected to reach approximately USD billion by the end of 2022 while registering itself at a compound annual growth rate (CAGR) of % over the forecast period owing to the increasing adoption of various applications involving automotive, healthcare and BFSI. Advancements in technologies involving voice and speech recognition technology like Amazons’ Alexa and Apple’s Siri has been the major drivers supporting the IVA market growth. Organizations over all fields have been gaining profits from virtual assistant technology. Large companies have extensively implemented the technology as well as they are turning into the initial engagement point with the company. Besides, developing outsourced assistance trend is expected to fuel the demand for IVA market during the future. An intelligent virtual assistant (IVA) brings down the operating expenditure by reforming the industry activities and also saves the training, interviewing and advertising costs for new employees assigned to any tasks. Furthermore, need for online healthcare interactions and services have been escalating. Customers are uninformed of the accessibility of their health-related records and most of the end-users require self-service options along with their doctors. IVAs like CIVA by CodeBaby render end-to-end solutions and make sure flawless consumer engagement.
Type Outlook and Trend Analysis
In 2017, speech recognition was evaluated at a market revenue share of around %, which is expected to chase the rising trend during the forecast years. The preference for speech recognition has progressively rising due to the implementation of mobile computing technology. Speech recognition establishes easy interaction between Smartphone and its application. It presents benefits like transcription, translation features, and hands-free computing, which is estimated to bestow in the growth of the segment.
Service Outlook and Trend Analysis
In 2017, customer service ruled the market with revenue of around %, which is projected to experience major growth during the next few years. Numerous factors are bestowing for its growth, which involves a colloquial agent as an immense majority user favors to seek queries online previous to getting in touch with a call centers. Furthermore, the calls are costly and enormously cost enterprises, which can be reduced by virtual assistants.
Application Outlook and Trend Analysis
BFSI section is projected to grow at a compound annual growth rate of over % during the forecast years. Increasing number of tablets and smartphones ownership has advocated the banks to counter customer’s demands and present more communication means. Automotive segment is developing as a highest growing section in the market, which is likely to experience constant growth during the projected period.
End-user Outlook and Trend Analysis
During the forecast period, the small and medium enterprises (SMEs) are expected to be the considerably rising end-user section and will persist to grow with a compound annual growth rate of around %. Numerous advantages like abbreviated operating cost and enhanced market quality are bestowing in the escalating penetration over the section.
Regional Outlook and Trend Analysis
In 2017, the North American regional market ruled the IVA market with over % of revenue share and the trend is anticipated to continue during the coming years due to the promising working remotely concept and augmented infiltration of smartphones. Technological innovations have ensued in amplified use of cloud-based tools like MS Office Online and Skype. It symbolizes that an escalating population is working distantly which offers massive opportunities for the growth of the global market. Asia Pacific regional market is likely to appear as extensively growing due to the increasing demand from emerging countries like China and India. Rising demand for self-reliance has fueled virtual agent adoption and acceptance.
Competitive Outlook and Trend Analysis
The major market players in global intelligent virtual assistant (IVA) market are [24]7 Customer Inc., Anboto Group, Clara Labs, Apple Inc., CodeBaby Corp., Artificial Solutions, Creative Virtual Ltd., CX Company, eGain Communications, Eidoserve Inc., Existor, Google, IBM Corporation, Intel Corporation, InteliWISE S.A., Nuance Communications, Next IT Corporation, Microsoft Corporation, Synthetix Ltd., Oracle Corporation, ViClone Corporation and Api.ai. Various companies in the global market are funding the development of the sophisticated IVA for diverse industry sectors like automotive platform in an attempt to knock the total potential of the market.
The global intelligent virtual assistant (IVA) market is segmented as follows –
By Type
- Speech recognition
- Text-To-Speech recognition
By Service
- Customer service
- Marketing assistant
By Application
- BFSI
- IT & Telecom
- Retail
- Automotive
- Healthcare
- Education
- Others
By End-user
- Small to medium enterprise
- Large enterprise
- Individual user
By Region
- North America
- U.S
- Canada
- Mexico
- Europe
- Germany
- France
- UK
- Italy
- Spain
- Rest of Europe
- Asia-Pacific
- Japan
- China
- Australia
- India
- South Korea
- Rest of Asia Pacific
- Rest of the World
- Brazil
- South Africa
- Saudi Arabia
- United Arab Emirates
- Others
Some of the key questions answered by the report are:
· What was the market size in 2017 and forecast from 2017 to 2022?
· What will be the industry market growth from 2017 to 2022?
· What are the major drivers, restraints, opportunities, challenges, and industry trends and their impact on the market forecast?
· What are the major segments leading the market growth and why?
· Which are the leading players in the market and what are the major strategies adopted by them to sustain the market competition?
- Intelligent Virtual Assistant (IVA) Market , By Technology, Estimates and Forecast, 2012-2022 ($Million)
- Speech Recognition
- Text-to-Speech
- Voice Recognition
- Intelligent Virtual Assistant (IVA) Market , By Service, Estimates and Forecast, 2012-2022 ($Million)
- Customer Service
- Marketing Assistant
- Intelligent Virtual Assistant (IVA) Market , By End User, Estimates and Forecast, 2012-2022 ($Million)
- SMBs
- Large Enterprises
- Individual Users
- Intelligent Virtual Assistant (IVA) Market , By Application, Estimates and Forecast, 2012-2022 ($Million)
- BFSI
- Automotive
- IT & Telecom
- Retail
- Healthcare
- Education
- Others
- Beer Market, By Region, Estimates and Forecast, 2012-2022 ($Million)
- North America
- North America Intelligent Virtual Assistant (IVA) Market , By Country
- North America Intelligent Virtual Assistant (IVA) Market , By Technology
- North America Intelligent Virtual Assistant (IVA) Market , By Service
- North America Intelligent Virtual Assistant (IVA) Market , By End User
- North America Intelligent Virtual Assistant (IVA) Market , By Application
- U.S. Intelligent Virtual Assistant (IVA) Market , By Technology
- U.S. Intelligent Virtual Assistant (IVA) Market , By Service
- U.S. Intelligent Virtual Assistant (IVA) Market , By End User
- U.S. Intelligent Virtual Assistant (IVA) Market , By Application
- Canada Intelligent Virtual Assistant (IVA) Market , By Technology
- Canada Intelligent Virtual Assistant (IVA) Market , By Service
- Canada Intelligent Virtual Assistant (IVA) Market , By End User
- Canada Intelligent Virtual Assistant (IVA) Market , By Application
- Mexico Intelligent Virtual Assistant (IVA) Market , By Technology
- Mexico Intelligent Virtual Assistant (IVA) Market , By Service
- Mexico Intelligent Virtual Assistant (IVA) Market , By End User
- Mexico Intelligent Virtual Assistant (IVA) Market , By Application
-
- Europe
- Europe Intelligent Virtual Assistant (IVA) Market , By Country
- Europe Intelligent Virtual Assistant (IVA) Market , By Technology
- Europe Intelligent Virtual Assistant (IVA) Market , By Service
- Europe Intelligent Virtual Assistant (IVA) Market , By End User
- Europe Intelligent Virtual Assistant (IVA) Market , By Application
- Germany Intelligent Virtual Assistant (IVA) Market , By Technology
- Germany Intelligent Virtual Assistant (IVA) Market , By Service
- Germany Intelligent Virtual Assistant (IVA) Market , By End User
- Germany Intelligent Virtual Assistant (IVA) Market , By Application
- France Intelligent Virtual Assistant (IVA) Market , By Technology
- France Intelligent Virtual Assistant (IVA) Market , By Service
- France Intelligent Virtual Assistant (IVA) Market , By End User
- France Intelligent Virtual Assistant (IVA) Market , By Application
- UK Intelligent Virtual Assistant (IVA) Market , By Technology
- UK Intelligent Virtual Assistant (IVA) Market , By Service
- UK Intelligent Virtual Assistant (IVA) Market , By End User
- UK Intelligent Virtual Assistant (IVA) Market , By Application
- Italy Intelligent Virtual Assistant (IVA) Market , By Technology
- Italy Intelligent Virtual Assistant (IVA) Market , By Service
- Italy Intelligent Virtual Assistant (IVA) Market , By End User
- Italy Intelligent Virtual Assistant (IVA) Market , By Application
- Spain Intelligent Virtual Assistant (IVA) Market , By Technology
- Spain Intelligent Virtual Assistant (IVA) Market , By Service
- Spain Intelligent Virtual Assistant (IVA) Market , By End User
- Spain Intelligent Virtual Assistant (IVA) Market , By Application
- Rest of Europe Intelligent Virtual Assistant (IVA) Market , By Technology
- Rest of Europe Intelligent Virtual Assistant (IVA) Market , By Service
- Rest of Europe Intelligent Virtual Assistant (IVA) Market , By End User
- Rest of Europe Intelligent Virtual Assistant (IVA) Market , By Application
-
- Asia-Pacific
- Asia-Pacific Intelligent Virtual Assistant (IVA) Market , By Country
- Asia-Pacific Intelligent Virtual Assistant (IVA) Market , By Technology
- Asia-Pacific Intelligent Virtual Assistant (IVA) Market , By Service
- Asia-Pacific Intelligent Virtual Assistant (IVA) Market , By End User
- Asia-Pacific Intelligent Virtual Assistant (IVA) Market , By Application
- Japan Intelligent Virtual Assistant (IVA) Market , By Technology
- Japan Intelligent Virtual Assistant (IVA) Market , By Service
- Japan Intelligent Virtual Assistant (IVA) Market , By End User
- Japan Intelligent Virtual Assistant (IVA) Market , By Application
- Australia Intelligent Virtual Assistant (IVA) Market , By Technology
- Australia Intelligent Virtual Assistant (IVA) Market , By Service
- Australia Intelligent Virtual Assistant (IVA) Market , By End User
- Australia Intelligent Virtual Assistant (IVA) Market , By Application
- India Intelligent Virtual Assistant (IVA) Market , By Technology
- India Intelligent Virtual Assistant (IVA) Market , By Service
- India Intelligent Virtual Assistant (IVA) Market , By End User
- India Intelligent Virtual Assistant (IVA) Market , By Application
- South Korea Intelligent Virtual Assistant (IVA) Market , By Technology
- South Korea Intelligent Virtual Assistant (IVA) Market , By Service
- South Korea Intelligent Virtual Assistant (IVA) Market , By End User
- South Korea Intelligent Virtual Assistant (IVA) Market , By Application
- Rest of Asia-Pacific Intelligent Virtual Assistant (IVA) Market , By Technology
- Rest of Asia-Pacific Intelligent Virtual Assistant (IVA) Market , By Service
- Rest of Asia-Pacific Intelligent Virtual Assistant (IVA) Market , By End User
- Rest of Asia-Pacific Intelligent Virtual Assistant (IVA) Market , By Application
-
- Rest of the World
- Rest of the World Intelligent Virtual Assistant (IVA) Market , By Country
- Rest of the World Intelligent Virtual Assistant (IVA) Market , By Technology
- Rest of the World Intelligent Virtual Assistant (IVA) Market , By Service
- Rest of the World Intelligent Virtual Assistant (IVA) Market , By End User
- Rest of the World Intelligent Virtual Assistant (IVA) Market , By Application
- Brazil Intelligent Virtual Assistant (IVA) Market , By Technology
- Brazil Intelligent Virtual Assistant (IVA) Market , By Service
- Brazil Intelligent Virtual Assistant (IVA) Market , By End User
- Brazil Intelligent Virtual Assistant (IVA) Market , By Application
- South Africa Intelligent Virtual Assistant (IVA) Market , By Technology
- South Africa Intelligent Virtual Assistant (IVA) Market , By Service
- South Africa Intelligent Virtual Assistant (IVA) Market , By End User
- South Africa Intelligent Virtual Assistant (IVA) Market , By Application
- Saudi Arabia Intelligent Virtual Assistant (IVA) Market , By Technology
- Saudi Arabia Intelligent Virtual Assistant (IVA) Market , By Service
- Saudi Arabia Intelligent Virtual Assistant (IVA) Market , By End User
- Saudi Arabia Intelligent Virtual Assistant (IVA) Market , By Application
- Turkey Intelligent Virtual Assistant (IVA) Market , By Technology
- Turkey Intelligent Virtual Assistant (IVA) Market , By Service
- Turkey Intelligent Virtual Assistant (IVA) Market , By End User
- Turkey Intelligent Virtual Assistant (IVA) Market , By Application
- United Arab Emirates Intelligent Virtual Assistant (IVA) Market , By Technology
- United Arab Emirates Intelligent Virtual Assistant (IVA) Market , By Service
- United Arab Emirates Intelligent Virtual Assistant (IVA) Market , By End User
- United Arab Emirates Intelligent Virtual Assistant (IVA) Market , By Application
- Others Intelligent Virtual Assistant (IVA) Market , By Technology
- Others Intelligent Virtual Assistant (IVA) Market , By Service
- Others Intelligent Virtual Assistant (IVA) Market , By End User
- Others Intelligent Virtual Assistant (IVA) Market , By Application
1. Introduction
1.1. Report Description
1.2. Research Methodology
1.2.1. Secondary Research
1.2.2. Primary Research
2. Executive Summary
2.1. Key Highlights
3. Market Overview
3.1. Introduction
3.1.1. Market Definition
3.1.2. Market Segmentation
3.2. Market Dynamics
3.2.1. Drivers
3.2.1.1. Rising Adoption Across Several Industry Verticals
3.2.1.2. High Demand for Outsourced Assistance
3.2.1.3. Rising Emphasis to Enhance Customer Satisfaction
3.2.2. Restraints
3.2.2.1. Lack of skilled professionals
3.2.3. Opportunities
3.2.3.1. Emerging Countries to Offer Lucrative Growth Opportunities
4. Intelligent Virtual Assistant (IVA) Market, By Technology
4.1. Introduction
4.2. Intelligent Virtual Assistant (IVA) Market Assessment and Forecast, By Technology, 2012-2022
4.3. Speech Recognition
4.3.1. Market Assessment and Forecast, By Region, 2012-2022 ($Million)
4.4. Text-to-Speech
4.4.1. Market Assessment and Forecast, By Region, 2012-2022 ($Million)
4.5. Voice Recognition
4.5.1. Market Assessment and Forecast, By Region, 2012-2022 ($Million)
5. Intelligent Virtual Assistant (IVA) Market, By Service
5.1. Introduction
5.2. Intelligent Virtual Assistant (IVA) Market Assessment and Forecast, By Service 2012-2022
5.3. Customer Service
5.3.1. Market Assessment and Forecast, By Region, 2012-2022 ($Million)
5.4. Marketing Assistant
5.4.1. Market Assessment and Forecast, By Region, 2012-2022 ($Million)
6. Intelligent Virtual Assistant (IVA) Market, By End User
6.1. Introduction
6.2. Intelligent Virtual Assistant (IVA) Market Assessment and Forecast, By End User 2012-2022 ($Million)
6.3. SMBs
6.3.1. Market Assessment and Forecast, By Region, 2012-2022 ($Million)
6.4. Large Enterprises
6.4.1. Market Assessment and Forecast, By Region, 2012-2022 ($Million)
6.5. Individual Users
6.5.1. Market Assessment and Forecast, By Region, 2012-2022 ($Million)
7. Intelligent Virtual Assistant (IVA) Market, By Application
7.1. Introduction
7.2. Intelligent Virtual Assistant (IVA) Market Assessment and Forecast, By Application, 2012-2022 ($Million)
7.3. BFSI
7.3.1. Market Assessment and Forecast, By Region, 2012-2022 ($Million)
7.4. Automotive
7.4.1. Market Assessment and Forecast, By Region, 2012-2022 ($Million)
7.5. IT & Telecom
7.5.1. Market Assessment and Forecast, By Region, 2012-2022 ($Million)
7.6. Retail
7.6.1. Market Assessment and Forecast, By Region, 2012-2022 ($Million)
7.7. Healthcare
7.7.1. Market Assessment and Forecast, By Region, 2012-2022 ($Million)
7.8. Education
7.8.1. Market Assessment and Forecast, By Region, 2012-2022 ($Million)
7.9. Other Applications
7.9.1. Market Assessment and Forecast, By Region, 2012-2022 ($Million)
8. Intelligent Virtual Assistant (IVA) Market, By Region
8.1. Introduction
8.2. Intelligent Virtual Assistant (IVA) Market Assessment and Forecast, By Region, 2012-2022 ($Million)
8.3. North America
8.3.1. Market Assessment and Forecast, By Country, 2012-2022 ($Million)
8.3.2. Market Assessment and Forecast, By Technology, 2012-2022 ($Million)
8.3.3. Market Assessment and Forecast, By Service, 2012-2022 ($Million)
8.3.4. Market Assessment and Forecast, By End User, 2012-2022 ($Million)
8.3.5. Market Assessment and Forecast, By Application, 2012-2022 ($Million)
8.3.6. U.S.
8.3.6.1.1. Market Assessment and Forecast, By Technology, 2012-2022 ($Million)
8.3.6.1.2. Market Assessment and Forecast, By Service, 2012-2022 ($Million)
8.3.6.1.3. Market Assessment and Forecast, By End User, 2012-2022 ($Million)
8.3.6.1.4. Market Assessment and Forecast, By Application, 2012-2022 ($Million)
8.3.7. Canada
8.3.7.1.1. Market Assessment and Forecast, By Technology, 2012-2022 ($Million)
8.3.7.1.2. Market Assessment and Forecast, By Service, 2012-2022 ($Million)
8.3.7.1.3. Market Assessment and Forecast, By End User, 2012-2022 ($Million)
8.3.7.1.4. Market Assessment and Forecast, By Application, 2012-2022 ($Million)
8.3.8. Mexico
8.3.8.1.1. Market Assessment and Forecast, By Technology, 2012-2022 ($Million)
8.3.8.1.2. Market Assessment and Forecast, By Service, 2012-2022 ($Million)
8.3.8.1.3. Market Assessment and Forecast, By End User, 2012-2022 ($Million)
8.3.8.1.4. Market Assessment and Forecast, By Application, 2012-2022 ($Million)
8.4. Europe
8.4.1. Market Assessment and Forecast, By Country, 2012-2022 ($Million)
8.4.2. Market Assessment and Forecast, By Technology, 2012-2022 ($Million)
8.4.3. Market Assessment and Forecast, By Service, 2012-2022 ($Million)
8.4.4. Market Assessment and Forecast, By End User, 2012-2022 ($Million)
8.4.5. Market Assessment and Forecast, By Application, 2012-2022 ($Million)
8.4.6. Germany
8.4.6.1.1. Market Assessment and Forecast, By Technology, 2012-2022 ($Million)
8.4.6.1.2. Market Assessment and Forecast, By Service, 2012-2022 ($Million)
8.4.6.1.3. Market Assessment and Forecast, By End User, 2012-2022 ($Million)
8.4.6.1.4. Market Assessment and Forecast, By Application, 2012-2022 ($Million)
8.4.7. France
8.4.7.1.1. Market Assessment and Forecast, By Technology, 2012-2022 ($Million)
8.4.7.1.2. Market Assessment and Forecast, By Service, 2012-2022 ($Million)
8.4.7.1.3. Market Assessment and Forecast, By End User, 2012-2022 ($Million)
8.4.7.1.4. Market Assessment and Forecast, By Application, 2012-2022 ($Million)
8.4.8. UK
8.4.8.1.1. Market Assessment and Forecast, By Technology, 2012-2022 ($Million)
8.4.8.1.2. Market Assessment and Forecast, By Service, 2012-2022 ($Million)
8.4.8.1.3. Market Assessment and Forecast, By End User, 2012-2022 ($Million)
8.4.8.1.4. Market Assessment and Forecast, By Application, 2012-2022 ($Million)
8.4.9. Italy
8.4.9.1.1. Market Assessment and Forecast, By Technology, 2012-2022 ($Million)
8.4.9.1.2. Market Assessment and Forecast, By Service, 2012-2022 ($Million)
8.4.9.1.3. Market Assessment and Forecast, By End User, 2012-2022 ($Million)
8.4.9.1.4. Market Assessment and Forecast, By Application, 2012-2022 ($Million)
8.4.10. Spain
8.4.10.1.1. Market Assessment and Forecast, By Technology, 2012-2022 ($Million)
8.4.10.1.2. Market Assessment and Forecast, By Service, 2012-2022 ($Million)
8.4.10.1.3. Market Assessment and Forecast, By End User, 2012-2022 ($Million)
8.4.10.1.4. Market Assessment and Forecast, By Application, 2012-2022 ($Million)
8.4.11. Rest of Europe
8.4.11.1.1. Market Assessment and Forecast, By Technology, 2012-2022 ($Million)
8.4.11.1.2. Market Assessment and Forecast, By Service, 2012-2022 ($Million)
8.4.11.1.3. Market Assessment and Forecast, By End User, 2012-2022 ($Million)
8.4.11.1.4. Market Assessment and Forecast, By Application, 2012-2022 ($Million)
8.5. Asia-Pacific
8.5.1. Market Assessment and Forecast, By Country, 2012-2022 ($Million)
8.5.2. Market Assessment and Forecast, By Technology, 2012-2022 ($Million)
8.5.3. Market Assessment and Forecast, By Service, 2012-2022 ($Million)
8.5.4. Market Assessment and Forecast, By End User, 2012-2022 ($Million)
8.5.5. Market Assessment and Forecast, By Application, 2012-2022 ($Million)
8.5.6. Japan
8.5.6.1.1. Market Assessment and Forecast, By Technology, 2012-2022 ($Million)
8.5.6.1.2. Market Assessment and Forecast, By Service, 2012-2022 ($Million)
8.5.6.1.3. Market Assessment and Forecast, By End User, 2012-2022 ($Million)
8.5.6.1.4. Market Assessment and Forecast, By Application, 2012-2022 ($Million)
8.5.7. China
8.5.7.1.1. Market Assessment and Forecast, By Technology, 2012-2022 ($Million)
8.5.7.1.2. Market Assessment and Forecast, By Service, 2012-2022 ($Million)
8.5.7.1.3. Market Assessment and Forecast, By End User, 2012-2022 ($Million)
8.5.7.1.4. Market Assessment and Forecast, By Application, 2012-2022 ($Million)
8.5.8. Australia
8.5.8.1.1. Market Assessment and Forecast, By Technology, 2012-2022 ($Million)
8.5.8.1.2. Market Assessment and Forecast, By Service, 2012-2022 ($Million)
8.5.8.1.3. Market Assessment and Forecast, By End User, 2012-2022 ($Million)
8.5.8.1.4. Market Assessment and Forecast, By Application, 2012-2022 ($Million)
8.5.9. India
8.5.9.1.1. Market Assessment and Forecast, By Technology, 2012-2022 ($Million)
8.5.9.1.2. Market Assessment and Forecast, By Service, 2012-2022 ($Million)
8.5.9.1.3. Market Assessment and Forecast, By End User, 2012-2022 ($Million)
8.5.9.1.4. Market Assessment and Forecast, By Application, 2012-2022 ($Million)
8.5.10. South Korea
8.5.10.1.1. Market Assessment and Forecast, By Technology, 2012-2022 ($Million)
8.5.10.1.2. Market Assessment and Forecast, By Service, 2012-2022 ($Million)
8.5.10.1.3. Market Assessment and Forecast, By End User, 2012-2022 ($Million)
8.5.10.1.4. Market Assessment and Forecast, By Application, 2012-2022 ($Million)
8.5.11. Rest of Asia-Pacific
8.5.11.1.1. Market Assessment and Forecast, By Technology, 2012-2022 ($Million)
8.5.11.1.2. Market Assessment and Forecast, By Service, 2012-2022 ($Million)
8.5.11.1.3. Market Assessment and Forecast, By End User, 2012-2022 ($Million)
8.5.11.1.4. Market Assessment and Forecast, By Application, 2012-2022 ($Million)
8.6. Rest of the World
8.6.1. Market Assessment and Forecast, By Country, 2012-2022 ($Million)
8.6.2. Market Assessment and Forecast, By Technology, 2012-2022 ($Million)
8.6.3. Market Assessment and Forecast, By Service, 2012-2022 ($Million)
8.6.4. Market Assessment and Forecast, By End User, 2012-2022 ($Million)
8.6.5. Market Assessment and Forecast, By Application, 2012-2022 ($Million)
8.6.5.1. Brazil
8.6.5.1.1. Market Assessment and Forecast, By Technology, 2012-2022 ($Million)
8.6.5.1.2. Market Assessment and Forecast, By Service, 2012-2022 ($Million)
8.6.5.1.3. Market Assessment and Forecast, By End User, 2012-2022 ($Million)
8.6.5.1.4. Market Assessment and Forecast, By Application, 2012-2022 ($Million)
8.6.5.2. Turkey
8.6.5.2.1. Market Assessment and Forecast, By Technology, 2012-2022 ($Million)
8.6.5.2.2. Market Assessment and Forecast, By Service, 2012-2022 ($Million)
8.6.5.2.3. Market Assessment and Forecast, By End User, 2012-2022 ($Million)
8.6.5.2.4. Market Assessment and Forecast, By Application, 2012-2022 ($Million)
8.6.5.3. Saudi Arabia
8.6.5.3.1. Market Assessment and Forecast, By Technology, 2012-2022 ($Million)
8.6.5.3.2. Market Assessment and Forecast, By Service, 2012-2022 ($Million)
8.6.5.3.3. Market Assessment and Forecast, By End User, 2012-2022 ($Million)
8.6.5.3.4. Market Assessment and Forecast, By Application, 2012-2022 ($Million)
8.6.5.4. South Africa
8.6.5.4.1. Market Assessment and Forecast, By Technology, 2012-2022 ($Million)
8.6.5.4.2. Market Assessment and Forecast, By Service, 2012-2022 ($Million)
8.6.5.4.3. Market Assessment and Forecast, By End User, 2012-2022 ($Million)
8.6.5.4.4. Market Assessment and Forecast, By Application, 2012-2022 ($Million)
8.6.5.5. United Arab Emirates
8.6.5.5.1. Market Assessment and Forecast, By Technology, 2012-2022 ($Million)
8.6.5.5.2. Market Assessment and Forecast, By Service, 2012-2022 ($Million)
8.6.5.5.3. Market Assessment and Forecast, By End User, 2012-2022 ($Million)
8.6.5.5.4. Market Assessment and Forecast, By Application, 2012-2022 ($Million)
8.6.5.6. Others
8.6.5.6.1. Market Assessment and Forecast, By Technology, 2012-2022 ($Million)
8.6.5.6.2. Market Assessment and Forecast, By Service, 2012-2022 ($Million)
8.6.5.6.3. Market Assessment and Forecast, By End User, 2012-2022 ($Million)
8.6.5.6.4. Market Assessment and Forecast, By Application, 2012-2022 ($Million)
9. Company Profiles
9.1. 24/7 CUSTOMER, INC.
9.1.1. Business Overview
9.1.2. Product Portfolio
9.1.3. Key Financials
9.1.4. Strategic Developments
9.2. Anboto
9.2.1. Business Overview
9.2.2. Product Portfolio
9.2.3. Key Financials
9.2.4. Strategic Developments
9.3. Apple Inc
9.3.1. Business Overview
9.3.2. Product Portfolio
9.3.3. Key Financials
9.3.4. Strategic Developments
9.4. Artificial Solutions
9.4.1. Business Overview
9.4.2. Product Portfolio
9.4.3. Key Financials
9.4.4. Strategic Developments
9.5. Clara Labs
9.5.1. Business Overview
9.5.2. Product Portfolio
9.5.3. Strategic Developments
9.6. CodeBaby Corporation
9.6.1. Business Overview
9.6.2. Product Portfolio
9.6.3. Strategic Developments
9.7. Creative Virtual Ltd.
9.7.1. Business Overview
9.7.2. Product Portfolio
9.7.3. Strategic Developments
9.8. CX Company
9.8.1. Business Overview
9.8.2. Product Portfolio
9.8.3. Strategic Developments
9.9. eGain Communications
9.9.1. Business Overview
9.9.2. Product Portfolio
9.9.3. Strategic Developments
9.10. Eidoserve Inc.
9.10.1. 9.10.1. Business Overview
9.10.2. Product Portfolio
9.10.3. Strategic Developments
9.11. Existor
9.11.1. Business Overview
9.11.2. Product Portfolio
9.11.3. Key Financials
9.11.4. Strategic Developments
List of Tables
Table 1.Global Intelligent Virtual Assistant (IVA) Market, By Technology, 2012-2022 ($Million)
Table 2.Speech Recognition Market, By Region, 2012-2022 ($Million)
Table 3.Text-to-Speech Market, By Region, 2012-2022 ($Million)
Table 4.Voice Recognition Market, By Region, 2012-2022 ($Million)
Table 5.Global Intelligent Virtual Assistant (IVA) Market, By Service, 2012-2022 ($Million)
Table 6.Customer Service Market, By Region, 2012-2022 ($Million)
Table 7.Marketing Assistant Market, By Region, 2012-2022 ($Million)
Table 8.Global Intelligent Virtual Assistant (IVA) Market, By End User, 2012-2022 ($Million)
Table 9.SMBs Market, By Region, 2012-2022 ($Million)
Table 10.Large Enterprises Market, By Region, 2012-2022 ($Million)
Table 11.Individual Users Market, By Region, 2012-2022 ($Million)
Table 12.Global Intelligent Virtual Assistant (IVA) Market, By Application, 2012-2022 ($Million)
Table 13.BFSI Market, By Region, 2012-2022 ($Million)
Table 14.Automotive Market, By Region, 2012-2022 ($Million)
Table 15.IT & Telecom Market, By Region, 2012-2022 ($Million)
Table 16.Retail Market, By Region, 2012-2022 ($Million)
Table 17.Healthcare Market, By Region, 2012-2022 ($Million)
Table 18.Education Market, By Region, 2012-2022 ($Million)
Table 19.Other Applications Market, By Region, 2012-2022 ($Million)
Table 20.North America Intelligent Virtual Assistant (IVA) Market, By Country, 2012-2022 ($Million)
Table 21.North America Intelligent Virtual Assistant (IVA) Market, By Technology, 2012-2022 ($Million)
Table 22.North America Intelligent Virtual Assistant (IVA) Market, By Service, 2012-2022 ($Million)
Table 23.North America Intelligent Virtual Assistant (IVA) Market, By End User, 2012-2022 ($Million)
Table 24.North America Intelligent Virtual Assistant (IVA) Market, By Application, 2012-2022 ($Million)
Table 25.U.S. Intelligent Virtual Assistant (IVA) Market, By Technology, 2012-2022 ($Million)
Table 26.U.S. Intelligent Virtual Assistant (IVA) Market, By Service, 2012-2022 ($Million)
Table 27.U.S. Intelligent Virtual Assistant (IVA) Market, By End User, 2012-2022 ($Million)
Table 28.U.S. Intelligent Virtual Assistant (IVA) Market, By Application, 2012-2022 ($Million)
Table 29.Canada Intelligent Virtual Assistant (IVA) Market, By Technology, 2012-2022 ($Million)
Table 30.Canada Intelligent Virtual Assistant (IVA) Market, By Service, 2012-2022 ($Million)
Table 31.Canada Intelligent Virtual Assistant (IVA) Market, By End User, 2012-2022 ($Million)
Table 32.Canada Intelligent Virtual Assistant (IVA) Market, By Application, 2012-2022 ($Million)
Table 33.Mexico Intelligent Virtual Assistant (IVA) Market, By Technology, 2012-2022 ($Million)
Table 34.Mexico Intelligent Virtual Assistant (IVA) Market, By Service, 2012-2022 ($Million)
Table 35.Mexico Intelligent Virtual Assistant (IVA) Market, By End User, 2012-2022 ($Million)
Table 36.Mexico Intelligent Virtual Assistant (IVA) Market, By Application, 2012-2022 ($Million)
Table 37.Europe Intelligent Virtual Assistant (IVA) Market, By Country, 2012-2022 ($Million)
Table 38.Europe Intelligent Virtual Assistant (IVA) Market, By Technology, 2012-2022 ($Million)
Table 39.Europe Intelligent Virtual Assistant (IVA) Market, By Service, 2012-2022 ($Million)
Table 40.Europe Intelligent Virtual Assistant (IVA) Market, By End User, 2012-2022 ($Million)
Table 41.Europe Intelligent Virtual Assistant (IVA) Market, By Application, 2012-2022 ($Million)
Table 42.Germany Intelligent Virtual Assistant (IVA) Market, By Technology, 2012-2022 ($Million)
Table 43.Germany Intelligent Virtual Assistant (IVA) Market, By Service, 2012-2022 ($Million)
Table 44.Germany Intelligent Virtual Assistant (IVA) Market, By End User, 2012-2022 ($Million)
Table 45.Germany Intelligent Virtual Assistant (IVA) Market, By Application, 2012-2022 ($Million)
Table 46.France Intelligent Virtual Assistant (IVA) Market, By Technology, 2012-2022 ($Million)
Table 47.France Intelligent Virtual Assistant (IVA) Market, By Service, 2012-2022 ($Million)
Table 48.France Intelligent Virtual Assistant (IVA) Market, By End User, 2012-2022 ($Million)
Table 49.France Intelligent Virtual Assistant (IVA) Market, By Application, 2012-2022 ($Million)
Table 50.UK Intelligent Virtual Assistant (IVA) Market, By Technology, 2012-2022 ($Million)
Table 51.UK Intelligent Virtual Assistant (IVA) Market, By Service, 2012-2022 ($Million)
Table 52.UK Intelligent Virtual Assistant (IVA) Market, By End User, 2012-2022 ($Million)
Table 53.UK Intelligent Virtual Assistant (IVA) Market, By Application, 2012-2022 ($Million)
Table 54.Italy Intelligent Virtual Assistant (IVA) Market, By Technology, 2012-2022 ($Million)
Table 55.Italy Intelligent Virtual Assistant (IVA) Market, By Service, 2012-2022 ($Million)
Table 56.Italy Intelligent Virtual Assistant (IVA) Market, By End User, 2012-2022 ($Million)
Table 57.Italy Intelligent Virtual Assistant (IVA) Market, By Application, 2012-2022 ($Million)
Table 58.Spain Intelligent Virtual Assistant (IVA) Market, By Technology, 2012-2022 ($Million)
Table 59.Spain Intelligent Virtual Assistant (IVA) Market, By Service, 2012-2022 ($Million)
Table 60.Spain Intelligent Virtual Assistant (IVA) Market, By End User, 2012-2022 ($Million)
Table 61.Spain Intelligent Virtual Assistant (IVA) Market, By Application, 2012-2022 ($Million)
Table 62.Russia Intelligent Virtual Assistant (IVA) Market, By Technology, 2012-2022 ($Million)
Table 63.Russia Intelligent Virtual Assistant (IVA) Market, By Service, 2012-2022 ($Million)
Table 64.Russia Intelligent Virtual Assistant (IVA) Market, By End User, 2012-2022 ($Million)
Table 65.Russia Intelligent Virtual Assistant (IVA) Market, By Application, 2012-2022 ($Million)
Table 66.Rest of Europe Intelligent Virtual Assistant (IVA) Market, By Technology, 2012-2022 ($Million)
Table 67.Rest of Europe Intelligent Virtual Assistant (IVA) Market, By Service, 2012-2022 ($Million)
Table 68.Rest of Europe Intelligent Virtual Assistant (IVA) Market, By End User, 2012-2022 ($Million)
Table 69.Rest of Europe Intelligent Virtual Assistant (IVA) Market, By Application, 2012-2022 ($Million)
Table 70.Asia-Pacific Intelligent Virtual Assistant (IVA) Market, By Country, 2012-2022 ($Million)
Table 71.Asia-Pacific Intelligent Virtual Assistant (IVA) Market, By Technology, 2012-2022 ($Million)
Table 72.Asia-Pacific Intelligent Virtual Assistant (IVA) Market, By Service, 2012-2022 ($Million)
Table 73.Asia-Pacific Intelligent Virtual Assistant (IVA) Market, By End User, 2012-2022 ($Million)
Table 74.Asia-Pacific Intelligent Virtual Assistant (IVA) Market, By Application, 2012-2022 ($Million)
Table 75.Japan Intelligent Virtual Assistant (IVA) Market, By Technology, 2012-2022 ($Million)
Table 76.Japan Intelligent Virtual Assistant (IVA) Market, By Service, 2012-2022 ($Million)
Table 77.Japan Intelligent Virtual Assistant (IVA) Market, By End User, 2012-2022 ($Million)
Table 78.Japan Intelligent Virtual Assistant (IVA) Market, By Application, 2012-2022 ($Million)
Table 79.China Intelligent Virtual Assistant (IVA) Market, By Technology, 2012-2022 ($Million)
Table 80.China Intelligent Virtual Assistant (IVA) Market, By Service, 2012-2022 ($Million)
Table 81.China Intelligent Virtual Assistant (IVA) Market, By End User, 2012-2022 ($Million)
Table 82.China Intelligent Virtual Assistant (IVA) Market, By Application, 2012-2022 ($Million)
Table 83.Australia Intelligent Virtual Assistant (IVA) Market, By Technology, 2012-2022 ($Million)
Table 84.Australia Intelligent Virtual Assistant (IVA) Market, By Service, 2012-2022 ($Million)
Table 85.Australia Intelligent Virtual Assistant (IVA) Market, By End User, 2012-2022 ($Million)
Table 86.Australia Intelligent Virtual Assistant (IVA) Market, By Application, 2012-2022 ($Million)
Table 87.India Intelligent Virtual Assistant (IVA) Market, By Technology, 2012-2022 ($Million)
Table 88.India Intelligent Virtual Assistant (IVA) Market, By Service, 2012-2022 ($Million)
Table 89.India Intelligent Virtual Assistant (IVA) Market, By End User, 2012-2022 ($Million)
Table 90.India Intelligent Virtual Assistant (IVA) Market, By Application, 2012-2022 ($Million)
Table 91.South Korea Intelligent Virtual Assistant (IVA) Market, By Technology, 2012-2022 ($Million)
Table 92.South Korea Intelligent Virtual Assistant (IVA) Market, By Service, 2012-2022 ($Million)
Table 93.South Korea Intelligent Virtual Assistant (IVA) Market, By End User, 2012-2022 ($Million)
Table 94.South Korea Intelligent Virtual Assistant (IVA) Market, By Application, 2012-2022 ($Million)
Table 95.Rest of Asia-Pacific Intelligent Virtual Assistant (IVA) Market, By Technology, 2012-2022 ($Million)
Table 96.Rest of Asia-Pacific Intelligent Virtual Assistant (IVA) Market, By Service, 2012-2022 ($Million)
Table 97.Rest of Asia-Pacific Intelligent Virtual Assistant (IVA) Market, By End User, 2012-2022 ($Million)
Table 98.Rest of Asia-Pacific Intelligent Virtual Assistant (IVA) Market, By Application, 2012-2022 ($Million)
Table 99.Rest of the World Intelligent Virtual Assistant (IVA) Market, By Country, 2012-2022 ($Million)
Table 100.Rest of the World Intelligent Virtual Assistant (IVA) Market, By Technology, 2012-2022 ($Million)
Table 101.Rest of the World Intelligent Virtual Assistant (IVA) Market, By Service, 2012-2022 ($Million)
Table 102.Rest of the World Intelligent Virtual Assistant (IVA) Market, By End User, 2012-2022 ($Million)
Table 103.Rest of the World Intelligent Virtual Assistant (IVA) Market, By Application, 2012-2022 ($Million)
Table 104.Brazil Intelligent Virtual Assistant (IVA) Market, By Technology, 2012-2022 ($Million)
Table 105.Brazil Intelligent Virtual Assistant (IVA) Market, By Service, 2012-2022 ($Million)
Table 106.Brazil Intelligent Virtual Assistant (IVA) Market, By End User, 2012-2022 ($Million)
Table 107.Brazil Intelligent Virtual Assistant (IVA) Market, By Application, 2012-2022 ($Million)
Table 108.Turkey Intelligent Virtual Assistant (IVA) Market, By Technology, 2012-2022 ($Million)
Table 109.Turkey Intelligent Virtual Assistant (IVA) Market, By Service, 2012-2022 ($Million)
Table 110.Turkey Intelligent Virtual Assistant (IVA) Market, By End User, 2012-2022 ($Million)
Table 111.Turkey Intelligent Virtual Assistant (IVA) Market, By Application, 2012-2022 ($Million)
Table 112.Saudi Arabia Intelligent Virtual Assistant (IVA) Market, By Technology, 2012-2022 ($Million)
Table 113.Saudi Arabia Intelligent Virtual Assistant (IVA) Market, By Service, 2012-2022 ($Million)
Table 114.Saudi Arabia Intelligent Virtual Assistant (IVA) Market, By End User, 2012-2022 ($Million)
Table 115.Saudi Arabia Intelligent Virtual Assistant (IVA) Market, By Application, 2012-2022 ($Million)
Table 116.South Africa Intelligent Virtual Assistant (IVA) Market, By Technology, 2012-2022 ($Million)
Table 117.South Africa Intelligent Virtual Assistant (IVA) Market, By Service, 2012-2022 ($Million)
Table 118.South Africa Intelligent Virtual Assistant (IVA) Market, By End User, 2012-2022 ($Million)
Table 119.South Africa Intelligent Virtual Assistant (IVA) Market, By Application, 2012-2022 ($Million)
Table 120.United Arab Emirates Intelligent Virtual Assistant (IVA) Market, By Technology, 2012-2022 ($Million)
Table 121.United Arab Emirates Intelligent Virtual Assistant (IVA) Market, By Service, 2012-2022 ($Million)
Table 122.United Arab Emirates Intelligent Virtual Assistant (IVA) Market, By End User, 2012-2022 ($Million)
Table 123.United Arab Emirates Intelligent Virtual Assistant (IVA) Market, By Application, 2012-2022 ($Million)
Table 124.Others Intelligent Virtual Assistant (IVA) Market, By Technology, 2012-2022 ($Million)
Table 125.Others Intelligent Virtual Assistant (IVA) Market, By Service, 2012-2022 ($Million)
Table 126.Others Intelligent Virtual Assistant (IVA) Market, By End User, 2012-2022 ($Million)
Table 127.Others Intelligent Virtual Assistant (IVA) Market, By Application, 2012-2022 ($Million)
Table 128.24/7 CUSTOMER, INC.: Key Strategic Developments, 2017-2017
Table 129.Anboto: Key Strategic Developments, 2017-2017
Table 130.Apple Inc.: Key Strategic Developments, 2017-2017
Table 131.Artificial Solutions: Key Strategic Developments, 2017-2017
Table 132.Clara Labs: Key Strategic Developments, 2017-2017
Table 133.CodeBaby Corporation: Key Strategic Developments, 2017-2017
Table 134.Creative Virtual Ltd.: Key Strategic Developments, 2017-2017
Table 135.CX Company: Key Strategic Developments, 2017-2017
Table 136.eGain Communications: Key Strategic Developments, 2017-2017
Table 137.Eidoserve Inc.: Key Strategic Developments, 2017-2017
Table 138.Existor: Key Strategic Developments, 2017-2017
List of Figures
Figure 1.Intelligent Virtual Assistant (IVA) Market Share, By Technology, 2017 & 2025 ($Million)
Figure 2.Intelligent Virtual Assistant (IVA) Market Share, By Service, 2017 & 2025 ($Million)
Figure 3.Intelligent Virtual Assistant (IVA) Market Share, By End User, 2017 & 2025 ($Million)
Figure 4.Intelligent Virtual Assistant (IVA) Market Share, By Application, 2017 & 2025 ($Million)
Figure 5.Intelligent Virtual Assistant (IVA) Market, By Region, 2017, ($Million)
Figure 6.24/7 CUSTOMER, INC.: Net Revenues, 2017-2017 ($Million)
Figure 7.24/7 CUSTOMER, INC.: Net Revenue Share, By Segment, 2017
Figure 8.24/7 CUSTOMER, INC.: Net Revenue Share, By Geography, 2017
Figure 9.Anboto: Net Revenues, 2017-2017 ($Million)
Figure 10.Anboto: Net Revenue Share, By Segment, 2017
Figure 11.Anboto: Net Revenue Share, By Geography, 2017
Figure 12.Apple Inc.: Net Revenues, 2017-2017 ($Million)
Figure 13.Apple Inc.: Net Revenue Share, By Segment, 2017
Figure 14.Apple Inc.: Net Revenue Share, By Geography, 2017
Figure 15.Artificial Solutions: Net Revenues, 2017-2017 ($Million)
Figure 16.Artificial Solutions: Net Revenue Share, By Segment, 2017
Figure 17.Artificial Solutions: Net Revenue Share, By Geography, 2017
Figure 18.Existor: Net Revenues, 2017-2017 ($Million)
Figure 19.Existor: Net Revenue Share, By Segment, 2017
Figure 20.Existor: Net Revenue Share, By Geography, 2017
Research Methodology
We use both primary as well as secondary research for our market surveys, estimates and for developing forecast. Our research process commence by analyzing the problem which enable us to design the scope for our research study. Our research process is uniquely designed with enough flexibility to adjust according to changing nature of products and markets, while retaining core element to ensure reliability and accuracy in research findings. We understand both macro and micro-economic factors to evaluate and forecast different market segments.
Data Mining
Data is extensively collected through various secondary sources such as annual reports, investor presentations, SEC filings, and other corporate publications. We also refer trade magazines, technical journals, paid databases such as Factiva and Bloomberg, industry trade journals, scientific journals, and social media data to understand market dynamics and industry trends. Further, we also conduct primary research to understand market drivers, restraints, opportunities, challenges, and competitive scenario to build our analysis.
Data Collection Matrix
|
Data Collection Matrix |
Supply Side |
Demand Side |
|
Primary Data Sources |
|
|
|
Secondary Data Sources |
|
|
Market Modeling and Forecasting
We use epidemiology and capital equipment-based models to forecast market size of different segments at country and regional level.
- Epidemiology-based Forecasting Model: This method uses epidemiology data gathered through various publications and from physicians to estimate population of patients, flow of treatment of individual disease and therapies. The data collected through this method includes statics on incidence of disease, population suffering from disease, and treatment population. This method is used to understand:
- Number of patients for particular device or medical procedure and
- Repeated use of particular device depending on health and condition of patient
- Capital-based Forecasting Model: This method of forecasting is based on number of replacements, installed-based and new sales of capital equipment used in various healthcare and diagnostic centers. These three parameters are calculated and forecast is developed. Installation base is calculated as average number of units per facility; while sales for particular year is calculated from number of new and replace units. Secondary data is collected through various supply chain intermediaries and opinion leaders to arrive at installation and sales rate. These techniques help our analysts in validating market and developed market estimates and forecast.
We do forecast on basis of several parameters such as market drivers, market opportunities, industry trends government regulations, raw materials supply and trade dynamics to ensure relevance of forecast with market scenario. With increasing need to granulized information, we used bottom-up methodology for forecasting where we evaluate each regional segment differently and combined all forecast to develop final market forecast.
Data Validation
We believe primary research is a very important tool in analyzing and forecasting different markets. In order to make sure accuracy of our findings, our team conducts primary interviews at every stage of research to gain deep insights into current business environment and future trends and key developments in market. This includes use of various methods such as telephonic interviews, focus groups, face to face interviews and questionnaires to validate our research from all aspects. We validate our data through primary research from key industry leaders such as CEO, product managers, marketing managers, suppliers, distributors, and consumers are frequently interviewed. These interviews provide valuable insights which help us to have better market understanding besides validating our estimates and forecast.
Data Triangulation

Industry Analysis
|
Qualitative Data |
Quantitative Data (2017-2025) |
|
|