.png)
Hybrid Power Solutions Market by System Type, Power Rating and End User - Global Industry Analysis and Forecast to 2023
Published On : November 2017 Pages : 90 Category: Energy & Mining Report Code : EM11369
SEGMENTS & REGIONS:
- Regions: North America, Europe, Asia- Pacific, Latin America, Middle East & Africa
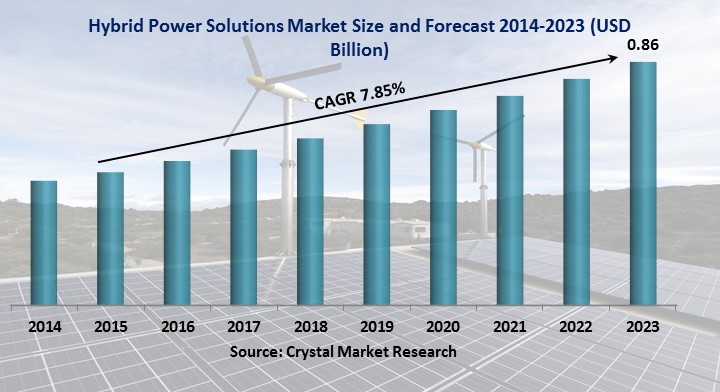
Industry Outlook and Trend Analysis
The Hybrid Power Solutions Market was worth USD billion in the year 2017 and is expected to reach approximately USD billion by 2023, while registering itself at a compound annual growth rate (CAGR) of % during the forecast period. Increasing burden from the political end to decrease CO2 emissions along with less maintenance and operational costs is predicted to be the prime element which propelling this market during the forecast period. With the aim to generate energy, hybrid power system is a mix of several technologies. This system integrates renewable sources of energy by combining it with secondary sources like fuel cell or diesel. Energy sources which are based on fossil fuel produce carbon, which leads to adverse effect on the human health as well as the environment. Some of the effects of the rising carbon emissions and many other greenhouse gases are greater risk of flooding, escalating temperature, ascending coastal erosion rates and heat waves. All of these elements have resulted to an increased predisposition towards the utilization of hybrid power. More and more need for generating clean energy along with the existence of major international market players is predicted to assist the global growth of this market. Because of the exclusive properties and characteristics linked with the decrease of carbon emissions, the insight of hybrid solutions in rising. Moreover, these solutions use less amount of fuel while giving expanded result. In addition, escalating awareness pertaining to the global warming has led to the shift of focus toward hybrid power solutions system in the market.
System Type Outlook and Trend Analysis
The customer is greatly benefited by solar diesel since it supplements value and renders stable and constant power grid along with recurring availability of energy. Solar diesel also leads to fuel savings, since PV generator can bear load in presence of adequate sunlight and diesel gensets can be taken off. Furthermore, it has the potential to equalize the existence of energy and demand of electricity during night time. All these factors are anticipated to attribute to the growth of the particular segment in the forthcoming years. With the help of diesel generator and wind turbine, wind-diesel system generates electricity. The system decreases the consumption of fuel and functional cost. In places where strong winds are circulated, such generators work with great efficiency. Solar-wind diesel system does not pollute the nature and is apt for places where the velocity of the wind in nearly 5 to 6m/s. Equally, renewable energies balance each other, which means, during the day, the batteries are charged using solar energy and during monsoon, wind is used to generate energy. Moreover, such systems are utilized to provide electricity for ecological development in rural areas and comprises of the potential to render prolonged machine life and reduced operating cost. Hence, the benefits given by these systems like decreasing constantly higher running cost of the generator are predicted to impel the market on a global level during the forecast period.
Power Rating Outlook and Trend Analysis
In 2017, the 11kW-100kW segment was the greatest and is anticipated to register at a higher compound annual growth rate (CAGR). Such kinds of solutions are utilized in hybrid power devices and electric vehicles. The hybrid electric vehicles are fabricated with electric motor and gasoline engine and retains the potential to efficiently control the issues with the environment like air pollution which is a resultant of CO2 emissions. Factors like these have escalated the general need for hybrid vehicles, which is as a result predicted to fuel the segment growth.
To satisfy the requirements of towns, above 100kW kind of product is sufficient, where the everyday consumption is more than 1000kW/day. These systems consists of many gensets which beards the overall load with great efficiency. Moreover, in places having enhanced solar resources, the system can create 1kW/hour from solar PV at the least cost as compared to its diesel equivalents. Factors like these are predicted to benefit the market’s growth over the forecast period.
End User Outlook and Trend Analysis
In 2017, commercial segment was the biggest which was accountable for % of the market share. Usually, during the noon and evening time, the load curve for residential application is more. Moreover, in the night time the energy demand in the rural areas is quite limited, which as a result leads to reduced load in comparison with the electricity demand in the morning. Diesel gensets on their own to do not meet the requirements in rural areas owing to restrictions like less efficiency and higher consumption of fuel. On the other hand, hybrid power solutions render a potential to resource load in the night which is likely to add lucratively to the need from residential segments in rural areas. Telecom industry is swelling across globe, particularly in remote areas. The use of diesel as an ecofriendly substitute for generating power has become quite difficult to justify. Hence, hybrid products are less reliant on diesel generators, which leads to more efficiency of energy along with cost management linked with power generators and fuel supply. Hybrid products are used as water pumps for irrigation purpose. Elements like irregular weather, dearth of electricity and greater investments in diesel pumping system poses an economic risk to the farmers. Several governments across the globe have attempted many initiatives for developing agriculture. For example, the Indo-German Energy Programme backs the solar water pumping efforts in India.
Regional Outlook and Trend Analysis
The Asia Pacific market with respect to product is anticipated to escalate at a considerable rate due to escalating awareness linked with damaging environmental effects of diesel-based power generators. Moreover, inadequate occurrence of grid-related infrastructure needed for conventional power generation products is anticipated to be the prime market growing driver in this region. The Middle East and Africa is ready to adopt hybrid power solutions due to the rising awareness pertaining to the superior product features like higher efficiency and less carbon emissions.
Competitive Outlook and Trend Analysis
Some of the major market manufacturers of this market are SMA Solar Technology AG, Siemens AG, Alpha Power Solutions, Danvest Energy A/S and ZTE Corporation. The market is categorized by the prevalence of companies which have incorporated functions via several distribution channels therefore letting them reach customers with ease. Moreover, market players of the product are aiming on creating inventive products to garner advantages with respect to cost, low maintenance, and easy process of manufacturing. SMA Solar Technology AG renders broad collection of hybrid power solutions and the company’s products consists turnkey solutions and off grid components. The company has partnered with MVV Energie AG for the purpose of direct marketing solar power to generate solutions for the operators of PV inverters having a productivity of more than 100kWp.
The global Hybrid Power Solutions Market is segmented as follows-
By System Type:
- Solar-diesel
- Wind-diesel
- Solar-Wind-diesel
- Others
By Power Rating:
- Up to 10kW
- 11kW - 100kW
- Above 100kW
By End User Outlook:
- Residential
- Commercial
- Telecommunication
- Others
By Region
- North America
- U.S
- Canada
- Mexico
- Europe
- Germany
- France
- UK
- Italy
- Spain
- Rest of Europe
- Asia-Pacific
- Japan
- China
- Australia
- India
- South Korea
- Rest of Asia Pacific
- Rest of the World
- Brazil
- South Africa
- Saudi Arabia
- United Arab Emirates
- Others
Some of the key questions answered by the report are:
- What was the market size in 2017 and forecast from 2017 to 2022?
- What will be the industry market growth from 2017 to 2022?
- What are the major drivers, restraints, opportunities, challenges, and industry trends and their impact on the market forecast?
- What are the major segments leading the market growth and why?
- Which are the leading players in the market and what are the major strategies adopted by them to sustain the market competition?
Market Classification
- Hybrid Power Solutions Market By System Type, Estimates and Forecast, 2014-2023($Million)
- Solar-diesel
- Wind-diesel
- Solar-Wind-diesel
- Other System Type
- Hybrid Power Solutions Market By Solutions Power, Estimates and Forecast, 2014-2023($Million)
- Up to 10kW
- 11kW - 100kW
- Above 100kW
- Hybrid Power Solutions Market By End User, Estimates and Forecast, 2014-2023($Million)
- Residential
- Commercial
- Telecommunication
- Other End Users
- Hybrid Power Solutions Market By Region, Estimates and Forecast, 2014-2023($Million)
- North America
- North America Hybrid Power Solutions Market, By Country
- North America Hybrid Power Solutions Market, By System Type
- North America Hybrid Power Solutions Market, By Solutions Power
- North America Hybrid Power Solutions Market, By End User
- U.S. Hybrid Power Solutions Market, By System Type
- U.S. Hybrid Power Solutions Market, By Solutions Power
- U.S. Hybrid Power Solutions Market, By End User
- Canada Hybrid Power Solutions Market, By System Type
- Canada Hybrid Power Solutions Market, By Solutions Power
- Canada Hybrid Power Solutions Market, By End User
- Mexico Hybrid Power Solutions Market, By System Type
- Mexico Hybrid Power Solutions Market, By Solutions Power
- Mexico Hybrid Power Solutions Market, By End User
-
- Europe
- Europe Hybrid Power Solutions Market, By Country
- Europe Hybrid Power Solutions Market, By System Type
- Europe Hybrid Power Solutions Market, By Solutions Power
- Europe Hybrid Power Solutions Market, By End User
- Germany Hybrid Power Solutions Market, By System Type
- Germany Hybrid Power Solutions Market, By Solutions Power
- Germany Hybrid Power Solutions Market, By End User
- France Hybrid Power Solutions Market, By System Type
- France Hybrid Power Solutions Market, By Solutions Power
- France Hybrid Power Solutions Market, By End User
- UK Hybrid Power Solutions Market, By System Type
- UK Hybrid Power Solutions Market, By Solutions Power
- UK Hybrid Power Solutions Market, By End User
- Italy Hybrid Power Solutions Market, By System Type
- Italy Hybrid Power Solutions Market, By Solutions Power
- Italy Hybrid Power Solutions Market, By End User
- Spain Hybrid Power Solutions Market, By System Type
- Spain Hybrid Power Solutions Market, By Solutions Power
- Spain Hybrid Power Solutions Market, By End User
- Rest of Europe Hybrid Power Solutions Market, By System Type
- Rest of Europe Hybrid Power Solutions Market, By Solutions Power
- Rest of Europe Hybrid Power Solutions Market, By End User
-
- Asia-Pacific
- Asia-Pacific Hybrid Power Solutions Market, By Country
- Asia-Pacific Hybrid Power Solutions Market, By System Type
- Asia-Pacific Hybrid Power Solutions Market, By Solutions Power
- Asia-Pacific Hybrid Power Solutions Market, By End User
- Japan Hybrid Power Solutions Market, By System Type
- Japan Hybrid Power Solutions Market, By Solutions Power
- Japan Hybrid Power Solutions Market, By End User
- China Hybrid Power Solutions Market, By System Type
- China Hybrid Power Solutions Market, By Solutions Power
- China Hybrid Power Solutions Market, By End User
- Australia Hybrid Power Solutions Market, By System Type
- Australia Hybrid Power Solutions Market, By Solutions Power
- Australia Hybrid Power Solutions Market, By End User
- India Hybrid Power Solutions Market, By System Type
- India Hybrid Power Solutions Market, By Solutions Power
- India Hybrid Power Solutions Market, By End User
- South Korea Hybrid Power Solutions Market, By System Type
- South Korea Hybrid Power Solutions Market, By Solutions Power
- South Korea Hybrid Power Solutions Market, By End User
- Rest of Asia-Pacific Hybrid Power Solutions Market, By System Type
- Rest of Asia-Pacific Hybrid Power Solutions Market, By Solutions Power
- Rest of Asia-Pacific Hybrid Power Solutions Market, By End User
- Asia-Pacific
-
- Rest of the World
- Rest of the World Hybrid Power Solutions Market, By Country
- Rest of the World Hybrid Power Solutions Market, By System Type
- Rest of the World Hybrid Power Solutions Market, By Solutions Power
- Rest of the World Hybrid Power Solutions Market, By End User
- Brazil Hybrid Power Solutions Market, By System Type
- Brazil Hybrid Power Solutions Market, By Solutions Power
- Brazil Hybrid Power Solutions Market, By End User
- South Africa Hybrid Power Solutions Market, By System Type
- South Africa Hybrid Power Solutions Market, By Solutions Power
- South Africa Hybrid Power Solutions Market, By End User
- Saudi Arabia Hybrid Power Solutions Market, By System Type
- Saudi Arabia Hybrid Power Solutions Market, By Solutions Power
- Saudi Arabia Hybrid Power Solutions Market, By End User
- Turkey Hybrid Power Solutions Market, By System Type
- Turkey Hybrid Power Solutions Market, By Solutions Power
- Turkey Hybrid Power Solutions Market, By End User
- United Arab Emirates Hybrid Power Solutions Market, By System Type
- United Arab Emirates Hybrid Power Solutions Market, By Solutions Power
- United Arab Emirates Hybrid Power Solutions Market, By End User
- Others Hybrid Power Solutions Market, By System Type
- Others Hybrid Power Solutions Market, By Solutions Power
- Others Hybrid Power Solutions Market, By End User
- Rest of the World
Table of Contents
1. Introduction
1.1. Report Description
1.2. Research Methodology
1.2.1. Secondary Research
1.2.2. Primary Research
2. Executive Summary
2.1. Key Highlights
3. Market Overview
3.1. Introduction
3.1.1. Market Definition
3.1.2. Market Segmentation
3.2. Market Dynamics
3.2.1. Drivers
3.2.1.1. Reduced Operational and Maintenance Cost
3.2.1.2. Reduction of Carbon Emission
3.2.2. Restraints
3.2.2.1. High initial investment
3.2.3. Opportunities
3.2.3.1. Emerging Markets to Offer Lucrative Growth Opportunities
4. Hybrid Power Solutions Market, By System Type
4.1. Introduction
4.2. Hybrid Power Solutions Market Assessment and Forecast, By System Type, 2017-2023
4.3. Solar-diesel
4.3.1. Market Assessment and Forecast, By Region, 2017-2023 ($Million)
4.4. Wind-diesel
4.4.1. Market Assessment and Forecast, By Region, 2017-2023 ($Million)
4.5. Solar-Wind-diesel
4.5.1. Market Assessment and Forecast, By Region, 2017-2023 ($Million)
4.6. Other Solutions Market
4.6.1. Market Assessment and Forecast, By Region, 2017-2023 ($Million)
5. Hybrid Power Solutions Market, By Power Rating
5.1. Introduction
5.2. Hybrid Power Solutions Market Assessment and Forecast, By Power Rating, 2017-2023
5.3. Up to 10kW
5.3.1. Market Assessment and Forecast, By Region, 2017-2023 ($Million)
5.4. 11kW - 100kW
5.4.1. Market Assessment and Forecast, By Region, 2017-2023 ($Million)
5.5. Above 100kW
5.5.1. Market Assessment and Forecast, By Region, 2017-2023 ($Million)
6. Hybrid Power Solutions Market, By End User
6.1. Introduction
6.2. Hybrid Power Solutions Market Assessment and Forecast, By End User, 2017-2023
6.3. Residential
6.3.1. Market Assessment and Forecast, By Region, 2017-2023 ($Million)
6.4. Commercial
6.4.1. Market Assessment and Forecast, By Region, 2017-2023 ($Million)
6.5. Telecommunication
6.5.1. Market Assessment and Forecast, By Region, 2017-2023 ($Million)
6.6. Other End Users
6.6.1. Market Assessment and Forecast, By Region, 2017-2023 ($Million)
7. Hybrid Power Solutions Market, By Region
7.1. Introduction
7.2. Hybrid Power Solutions Market Assessment and Forecast, By Region, 2017-2023 ($Million)
7.3. North America
7.3.1. Market Assessment and Forecast, By Country, 2017-2023 ($Million)
7.3.2. Market Assessment and Forecast, By System Type, 2017-2023 ($Million)
7.3.3. Market Assessment and Forecast, By Power Rating, 2017-2023 ($Million)
7.3.4. Market Assessment and Forecast, By End User, 2017-2023 ($Million)
7.3.5. U.S.
7.3.5.1. Market Assessment and Forecast, By System Type, 2017-2023 ($Million)
7.3.5.2. Market Assessment and Forecast, By Power Rating, 2017-2023 ($Million)
7.3.5.3. Market Assessment and Forecast, By End User, 2017-2023 ($Million)
7.3.6. Canada
7.3.6.1. Market Assessment and Forecast, By System Type, 2017-2023 ($Million)
7.3.6.2. Market Assessment and Forecast, By Power Rating, 2017-2023 ($Million)
7.3.6.3. Market Assessment and Forecast, By End User, 2017-2023 ($Million)
7.3.7. Mexico
7.3.7.1. Market Assessment and Forecast, By System Type, 2017-2023 ($Million)
7.3.7.2. Market Assessment and Forecast, By Power Rating, 2017-2023 ($Million)
7.3.7.3. Market Assessment and Forecast, By End User, 2017-2023 ($Million)
7.4. Europe
7.4.1. Market Assessment and Forecast, By Country, 2017-2023 ($Million)
7.4.2. Market Assessment and Forecast, By System Type, 2017-2023 ($Million)
7.4.3. Market Assessment and Forecast, By Power Rating, 2017-2023 ($Million)
7.4.4. Market Assessment and Forecast, By End User, 2017-2023 ($Million)
7.4.5. Germany
7.4.5.1. Market Assessment and Forecast, By System Type, 2017-2023 ($Million)
7.4.5.2. Market Assessment and Forecast, By Power Rating, 2017-2023 ($Million)
7.4.5.3. Market Assessment and Forecast, By End User, 2017-2023 ($Million)
7.4.6. France
7.4.6.1. Market Assessment and Forecast, By System Type, 2017-2023 ($Million)
7.4.6.2. Market Assessment and Forecast, By Power Rating, 2017-2023 ($Million)
7.4.6.3. Market Assessment and Forecast, By End User, 2017-2023 ($Million)
7.4.7. UK
7.4.7.1. Market Assessment and Forecast, By System Type, 2017-2023 ($Million)
7.4.7.2. Market Assessment and Forecast, By Power Rating, 2017-2023 ($Million)
7.4.7.3. Market Assessment and Forecast, By End User, 2017-2023 ($Million)
7.4.8. Italy
7.4.8.1. Market Assessment and Forecast, By System Type, 2017-2023 ($Million)
7.4.8.2. Market Assessment and Forecast, By Power Rating, 2017-2023 ($Million)
7.4.8.3. Market Assessment and Forecast, By End User, 2017-2023 ($Million)
7.4.9. Spain
7.4.9.1. Market Assessment and Forecast, By System Type, 2017-2023 ($Million)
7.4.9.2. Assessment and Forecast, By Power Rating, 2017-2023 ($Million)
7.4.9.3. Market Assessment and Forecast, By End User, 2017-2023 ($Million)
7.4.10. Rest of Europe
7.4.10.1. Market Assessment and Forecast, By System Type, 2017-2023 ($Million)
7.4.10.2. Assessment and Forecast, By Power Rating, 2017-2023 ($Million)
7.4.10.3. Market Assessment and Forecast, By End User, 2017-2023 ($Million)
7.5. Asia-Pacific
7.5.1. Market Assessment and Forecast, By Country, 2017-2023 ($Million)
7.5.2. Market Assessment and Forecast, By System Type, 2017-2023 ($Million)
7.5.3. Market Assessment and Forecast, By Power Rating, 2017-2023 ($Million)
7.5.4. Market Assessment and Forecast, By End User, 2017-2023 ($Million)
7.5.5. Japan
7.5.5.1. Market Assessment and Forecast, By System Type, 2017-2023 ($Million)
7.5.5.2. Market Assessment and Forecast, By Power Rating, 2017-2023 ($Million)
7.5.5.3. Market Assessment and Forecast, By End User, 2017-2023 ($Million)
7.5.6. China
7.5.6.1. Market Assessment and Forecast, By System Type, 2017-2023 ($Million)
7.5.6.2. Market Assessment and Forecast, By Power Rating, 2017-2023 ($Million)
7.5.6.3. Market Assessment and Forecast, By End User, 2017-2023 ($Million)
7.5.7. Australia
7.5.7.1. Market Assessment and Forecast, By System Type, 2017-2023 ($Million)
7.5.7.2. Market Assessment and Forecast, By Power Rating, 2017-2023 ($Million)
7.5.7.3. Market Assessment and Forecast, By End User, 2017-2023 ($Million)
7.5.8. India
7.5.8.1. Market Assessment and Forecast, By System Type, 2017-2023 ($Million)
7.5.8.2. Market Assessment and Forecast, By Power Rating, 2017-2023 ($Million)
7.5.8.3. Market Assessment and Forecast, By End User, 2017-2023 ($Million)
7.5.9. South Korea
7.5.9.1. Market Assessment and Forecast, By System Type, 2017-2023 ($Million)
7.5.9.2. Market Assessment and Forecast, By Power Rating, 2017-2023 ($Million)
7.5.9.3. Market Assessment and Forecast, By End User, 2017-2023 ($Million)
7.5.10. Rest of Asia-Pacific
7.5.10.1. Market Assessment and Forecast, By System Type, 2017-2023 ($Million)
7.5.10.2. Market Assessment and Forecast, By Power Rating, 2017-2023 ($Million)
7.5.10.3. Market Assessment and Forecast, By End User, 2017-2023 ($Million)
7.6. Rest of the World
7.6.1. Market Assessment and Forecast, By Country, 2017-2023 ($Million)
7.6.2. Market Assessment and Forecast, By System Type, 2017-2023 ($Million)
7.6.3. Market Assessment and Forecast, By Power Rating, 2017-2023 ($Million)
7.6.4. Market Assessment and Forecast, By End User, 2017-2023 ($Million)
7.6.5. Brazil
7.6.5.1. Market Assessment and Forecast, By System Type, 2017-2023 ($Million)
7.6.5.2. Market Assessment and Forecast, By Power Rating, 2017-2023 ($Million)
7.6.5.3. Market Assessment and Forecast, By End User, 2017-2023 ($Million)
7.6.6. Turkey
7.6.6.1. Market Assessment and Forecast, By System Type, 2017-2023 ($Million)
7.6.6.2. Market Assessment and Forecast, By Power Rating, 2017-2023 ($Million)
7.6.6.3. Market Assessment and Forecast, By End User, 2017-2023 ($Million)
7.6.7. Saudi Arabia
7.6.7.1. Market Assessment and Forecast, By System Type, 2017-2023 ($Million)
7.6.7.2. Market Assessment and Forecast, By Power Rating, 2017-2023 ($Million)
7.6.7.3. Market Assessment and Forecast, By End User, 2017-2023 ($Million)
7.6.8. South Africa
7.6.8.1. Market Assessment and Forecast, By System Type, 2017-2023 ($Million)
7.6.8.2. Market Assessment and Forecast, By Power Rating, 2017-2023 ($Million)
7.6.8.3. Market Assessment and Forecast, By End User, 2017-2023 ($Million)
7.6.9. United Arab Emirates
7.6.9.1. Market Assessment and Forecast, By System Type, 2017-2023 ($Million)
7.6.9.2. Market Assessment and Forecast, By Power Rating, 2017-2023 ($Million)
7.6.9.3. Market Assessment and Forecast, By End User, 2017-2023 ($Million)
7.6.10. Others
7.6.10.1. Market Assessment and Forecast, By System Type, 2017-2023 ($Million)
7.6.10.2. Market Assessment and Forecast, By Power Rating, 2017-2023 ($Million)
7.6.10.3. Market Assessment and Forecast, By End User, 2017-2023 ($Million)
8. Company Profiles
8.1. Siemens AG
8.1.1. Business Overview
8.1.2. Product Portfolio
8.1.3. Key Financials
8.1.4. Strategic Developments
8.2. SMA Solar Technology AG
8.2.1. Business Overview
8.2.2. Product Portfolio
8.2.3. Key Financials
8.2.4. Strategic Developments
8.3. Danvest Energy A/S
8.3.1. Business Overview
8.3.2. Product Portfolio
8.3.3. Key Financials
8.3.4. Strategic Developments
8.4. Alpha Power Solutions
8.4.1. Business Overview
8.4.2. Product Portfolio
8.4.3. Key Financials
8.4.4. Strategic Developments
8.5. ZTE Corporation
8.5.1. Business Overview
8.5.2. Product Portfolio
8.5.3. Strategic Developments
8.6. Ormat
8.6.1. Business Overview
8.6.2. Product Portfolio
8.6.3. Strategic Developments
8.7. AEG Power Solutions
8.7.1. Business Overview
8.7.2. Product Portfolio
8.7.3. Strategic Developments
8.8. PFISTERER Holding AG
8.8.1. Business Overview
8.8.2. Product Portfolio
8.8.3. Strategic Developments
8.9. Repowering Solutions
8.9.1. Business Overview
8.9.2. Product Portfolio
8.9.3. Strategic Developments
8.10. ReGen Powertech
8.10.1. Business Overview
8.10.2. Product Portfolio
8.10.3. Key Financials
8.10.4. Strategic Developments
List of Tables
Table 1.Hybrid Power Solutions Market, By System Type, 2017-2023, ($Million)
Table 2.Solar-diesel Market, By Region, 2017-2023, ($Million)
Table 3.Wind-diesel Market, By Region, 2017-2023, ($Million),
Table 4.Solar-Wind-diesel Market, By Region, 2017-2023, ($Million)
Table 5.Other System Types Market, By Region, 2017-2023, ($Million)
Table 6.Hybrid Power Solutions Market, By Power Rating, ($Million), 2017-2023
Table 7.Up to 10kW Market, By Region, 2017-2023, ($Million)
Table 8.11kW - 100kW Market, By Region, 2017-2023, ($Million)
Table 9.Above 100kW Market, By Region, 2017-2023, ($Million)
Table 10.Hybrid Power Solutions Market, By End User, 2017-2023, ($Million)
Table 11.Residential Market, By Region, 2017-2023 ($Million)
Table 12.Commercial Market, By Region, 2017-2023 ($Million)
Table 13.Telecommunication Market, By Region, 2017-2023 ($Million)
Table 14.Other End Users Market, By Region, 2017-2023 ($Million)
Table 15.North America Hybrid Power Solutions Market, By Country, 2017-2023 ($Million)
Table 16.North America Hybrid Power Solutions Market, By System Type, 2017-2023 ($Million)
Table 17.North America Hybrid Power Solutions Market, By Power Rating, 2017-2023 ($Million)
Table 18.North America Hybrid Power Solutions Market, By End User, 2017-2023 ($Million)
Table 19.U.S. Hybrid Power Solutions Market, by System Type, 2017-2023 ($Million)
Table 20.U.S. Hybrid Power Solutions Market, by Power Rating, 2017-2023 ($Million)
Table 21.U.S. Hybrid Power Solutions Market, by End User, 2017-2023 ($Million)
Table 22.Canada Hybrid Power Solutions Market, By System Type, 2017-2023 ($Million)
Table 23.Canada Hybrid Power Solutions Market, By Power Rating, 2017-2023 ($Million)
Table 24.Canada Hybrid Power Solutions Market, By End User, 2017-2023 ($Million)
Table 25.Mexico Hybrid Power Solutions Market, By System Type, 2017-2023 ($Million)
Table 26.Mexico Hybrid Power Solutions Market, By Power Rating, 2017-2023 ($Million)
Table 27.Mexico Hybrid Power Solutions Market, By End User, 2017-2023 ($Million)
Table 28.Europe Hybrid Power Solutions Market, By Country, 2017-2023 ($Million)
Table 29.Europe Hybrid Power Solutions Market, By System Type, 2017-2023 ($Million)
Table 30.Europe Hybrid Power Solutions Market, By Power Rating, 2017-2023 ($Million)
Table 31.Europe Hybrid Power Solutions Market, By End User, 2017-2023 ($Million)
Table 32.Germany Hybrid Power Solutions Market, By System Type, 2017-2023 ($Million)
Table 33.Germany Hybrid Power Solutions Market, By Power Rating, 2017-2023 ($Million)
Table 34.Germany Hybrid Power Solutions Market, By End User, 2017-2023 ($Million)
Table 35.France Hybrid Power Solutions Market, By System Type, 2017-2023 ($Million)
Table 36.France Hybrid Power Solutions Market, By Power Rating, 2017-2023 ($Million)
Table 37.France Hybrid Power Solutions Market, By End User, 2017-2023 ($Million)
Table 38.UK Hybrid Power Solutions Market, By System Type, 2017-2023 ($Million)
Table 39.UK Hybrid Power Solutions Market, By Power Rating, 2017-2023 ($Million)
Table 40.UK Hybrid Power Solutions Market, By End User, 2017-2023 ($Million)
Table 41.Italy Hybrid Power Solutions Market, By System Type, 2017-2023 ($Million)
Table 42.Italy Hybrid Power Solutions Market, By Power Rating, 2017-2023 ($Million)
Table 43.Italy Hybrid Power Solutions Market, By End User, 2017-2023 ($Million)
Table 44.Spain Hybrid Power Solutions Market, By System Type, 2017-2023 ($Million)
Table 45.Spain Hybrid Power Solutions Market, By Power Rating, 2017-2023 ($Million)
Table 46.Spain Hybrid Power Solutions Market, By End User, 2017-2023 ($Million)
Table 47.Rest of Europe Hybrid Power Solutions Market, By System Type, 2017-2023 ($Million)
Table 48.Rest of Europe Hybrid Power Solutions Market, By Power Rating, 2017-2023 ($Million)
Table 49.Rest of Europe Hybrid Power Solutions Market, By End User, 2017-2023 ($Million)
Table 50.Asia-Pacific Hybrid Power Solutions Market, By Country, 2017-2023 ($Million)
Table 51.Asia-Pacific Hybrid Power Solutions Market, By System Type, 2017-2023 ($Million)
Table 52.Asia-Pacific Hybrid Power Solutions Market, By Power Rating, 2017-2023 ($Million)
Table 53.Asia-Pacific Hybrid Power Solutions Market, By End User, 2017-2023 ($Million)
Table 54.Japan Hybrid Power Solutions Market, By System Type, 2017-2023 ($Million)
Table 55.Japan Hybrid Power Solutions Market, By Power Rating, 2017-2023 ($Million)
Table 56.Japan Hybrid Power Solutions Market, By End User, 2017-2023 ($Million)
Table 57.China Hybrid Power Solutions Market, By System Type, 2017-2023 ($Million)
Table 58.China Hybrid Power Solutions Market, By Power Rating, 2017-2023 ($Million)
Table 59.China Hybrid Power Solutions Market, By End User, 2017-2023 ($Million)
Table 60.Australia Hybrid Power Solutions Market, By System Type, 2017-2023 ($Million)
Table 61.Australia Hybrid Power Solutions Market, By Power Rating, 2017-2023 ($Million)
Table 62.Australia Hybrid Power Solutions Market, By End User, 2017-2023 ($Million)
Table 63.India Hybrid Power Solutions Market, By System Type, 2017-2023 ($Million)
Table 64.India Hybrid Power Solutions Market, By Power Rating, 2017-2023 ($Million)
Table 65.India Hybrid Power Solutions Market, By End User, 2017-2023 ($Million)
Table 66.South Korea Hybrid Power Solutions Market, By System Type, 2017-2023 ($Million)
Table 67.South Korea Hybrid Power Solutions Market, By Power Rating, 2017-2023 ($Million)
Table 68.South Korea Hybrid Power Solutions Market, By End User, 2017-2023 ($Million)
Table 69.Rest of Asia-Pacific Hybrid Power Solutions Market, By System Type, 2017-2023 ($Million)
Table 70.Rest of Asia-Pacific Hybrid Power Solutions Market, By Power Rating, 2017-2023 ($Million)
Table 71.Rest of Asia-Pacific Hybrid Power Solutions Market, By End User, 2017-2023 ($Million)
Table 72.Rest of the World Hybrid Power Solutions Market, By Country, 2017-2023 ($Million)
Table 73.Rest of the World Hybrid Power Solutions Market, By System Type, 2017-2023 ($Million)
Table 74.Rest of the World Hybrid Power Solutions Market, By Power Rating, 2017-2023 ($Million)
Table 75.Rest of the World Hybrid Power Solutions Market, By End User, 2017-2023 ($Million)
Table 76.Brazil Hybrid Power Solutions Market, By System Type, 2017-2023 ($Million)
Table 77.Brazil Hybrid Power Solutions Market, By Power Rating, 2017-2023 ($Million)
Table 78.Brazil Hybrid Power Solutions Market, By End User, 2017-2023 ($Million)
Table 79.Turkey Hybrid Power Solutions Market, By System Type, 2017-2023 ($Million)
Table 80.Turkey Hybrid Power Solutions Market, By Power Rating, 2017-2023 ($Million)
Table 81.Turkey Hybrid Power Solutions Market, By End User, 2017-2023 ($Million)
Table 82.Saudi Arabia Hybrid Power Solutions Market, By System Type, 2017-2023 ($Million)
Table 83.Saudi Arabia Hybrid Power Solutions Market, By Power Rating, 2017-2023 ($Million)
Table 84.Saudi Arabia Hybrid Power Solutions Market, By End User, 2017-2023 ($Million)
Table 85.South Africa Hybrid Power Solutions Market, By System Type, 2017-2023 ($Million)
Table 86.South Africa Hybrid Power Solutions Market, By Power Rating, 2017-2023 ($Million)
Table 87.South Africa Hybrid Power Solutions Market, By End User, 2017-2023 ($Million)
Table 88.United Arab Emirates Hybrid Power Solutions Market, By System Type, 2017-2023 ($Million)
Table 89.United Arab Emirates Hybrid Power Solutions Market, By Power Rating, 2017-2023 ($Million)
Table 90.United Arab Emirates Hybrid Power Solutions Market, By End User, 2017-2023 ($Million)
Table 91.Others Hybrid Power Solutions Market, By System Type, 2017-2023 ($Million)
Table 92.Others Hybrid Power Solutions Market, By Power Rating, 2017-2023 ($Million)
Table 93.Others Hybrid Power Solutions Market, By End User, 2017-2023 ($Million)
Table 94.Siemens AG: Key Strategic Developments, 2017-2017
Table 95.SMA Solar Technology AG: Key Strategic Developments, 2017-2017
Table 96 Danvest Energy A/S: Key Strategic Developments, 2017-2017
Table 97.Alpha Power Solutions: Key Strategic Developments, 2017-2017
Table 98.ZTE Corporation: Key Strategic Developments, 2017-2017
Table 99.Ormat: Key Strategic Developments, 2017-2017
Table 100.AEG Power Solutions: Key Strategic Developments, 2017-2017
Table 101.PFISTERER Holding AG: Key Strategic Developments, 2017-2017
Table 102.Repowering Solutions: Key Strategic Developments, 2017-2017
Table 103.ReGen Powertech: Key Strategic Developments, 2017-2017
List of Figures
Figure 1.Hybrid Power Solutions Market Share, By System Type, 2012 & 2022
Figure 2.Hybrid Power Solutions Market, By Power Rating, 2012 & 2022, ($Million)
Figure 3.Hybrid Power Solutions Market, By End User, 2012 & 2022, ($Million)
Figure 4.Hybrid Power Solutions Market, By Region, 2012 & 2022, ($Million)
Figure 5.Siemens AG: Net Revenues, 2017-2017 ($Million)
Figure 6.Siemens AG: Net Revenue Share, By Segment, 2017
Figure 7.Siemens AG: Net Revenue Share, By Geography, 2017
Figure 8.SMA Solar Technology AG: Net Revenues, 2017-2017 ($Million)
Figure 9.SMA Solar Technology AG: Net Revenue Share, By Segment, 2017
Figure 10.SMA Solar Technology AG: Net Revenue Share, By Geography, 2017
Figure 11.Danvest Energy A/S: Net Revenues, 2017-2017 ($Million)
Figure 12.Danvest Energy A/S: Net Revenue Share, By Segment, 2017
Figure13.Danvest Energy A/S: Net Revenue Share, By Geography, 2017
Figure14.Alpha Power Solutions: Net Revenues, 2017-2017 ($Million)
Figure15.Alpha Power Solutions: Net Revenue Share, By Segment, 2017
Figure16.Alpha Power Solutions: Net Revenue Share, By Geography, 2017
Figure17.ReGen Powertech: Net Revenues, 2017-2017 ($Million)
Figure18.ReGen Powertech: Net Revenue Share, By Segment, 2017
Figure19.ReGen Powertech: Net Revenue Share, By Geography, 2017
Research Methodology
We use both primary as well as secondary research for our market surveys, estimates and for developing forecast. Our research process commence by analyzing the problem which enable us to design the scope for our research study. Our research process is uniquely designed with enough flexibility to adjust according to changing nature of products and markets, while retaining core element to ensure reliability and accuracy in research findings. We understand both macro and micro-economic factors to evaluate and forecast different market segments.
Data Mining
Data is extensively collected through various secondary sources such as annual reports, investor presentations, SEC filings, and other corporate publications. We also refer trade magazines, technical journals, paid databases such as Factiva and Bloomberg, industry trade journals, scientific journals, and social media data to understand market dynamics and industry trends. Further, we also conduct primary research to understand market drivers, restraints, opportunities, challenges, and competitive scenario to build our analysis.
Data Collection Matrix
|
Data Collection Matrix |
Supply Side |
Demand Side |
|
Primary Data Sources |
|
|
|
Secondary Data Sources |
|
|
Market Modeling and Forecasting
We use epidemiology and capital equipment-based models to forecast market size of different segments at country and regional level.
- Epidemiology-based Forecasting Model: This method uses epidemiology data gathered through various publications and from physicians to estimate population of patients, flow of treatment of individual disease and therapies. The data collected through this method includes statics on incidence of disease, population suffering from disease, and treatment population. This method is used to understand:
- Number of patients for particular device or medical procedure and
- Repeated use of particular device depending on health and condition of patient
- Capital-based Forecasting Model: This method of forecasting is based on number of replacements, installed-based and new sales of capital equipment used in various healthcare and diagnostic centers. These three parameters are calculated and forecast is developed. Installation base is calculated as average number of units per facility; while sales for particular year is calculated from number of new and replace units. Secondary data is collected through various supply chain intermediaries and opinion leaders to arrive at installation and sales rate. These techniques help our analysts in validating market and developed market estimates and forecast.
We do forecast on basis of several parameters such as market drivers, market opportunities, industry trends government regulations, raw materials supply and trade dynamics to ensure relevance of forecast with market scenario. With increasing need to granulized information, we used bottom-up methodology for forecasting where we evaluate each regional segment differently and combined all forecast to develop final market forecast.
Data Validation
We believe primary research is a very important tool in analyzing and forecasting different markets. In order to make sure accuracy of our findings, our team conducts primary interviews at every stage of research to gain deep insights into current business environment and future trends and key developments in market. This includes use of various methods such as telephonic interviews, focus groups, face to face interviews and questionnaires to validate our research from all aspects. We validate our data through primary research from key industry leaders such as CEO, product managers, marketing managers, suppliers, distributors, and consumers are frequently interviewed. These interviews provide valuable insights which help us to have better market understanding besides validating our estimates and forecast.
Data Triangulation

Industry Analysis
|
Qualitative Data |
Quantitative Data (2017-2025) |
|
|