.png)
HPV Decontamination Systems Market by Type and Application - Global Industry Analysis and Forecast to 2022
Published On : September 2017 Pages : 105 Category: Medical Devices Report Code : HC09205
SEGMENTS & REGIONS:
- Regions: North America, Europe, Asia- Pacific, Latin America, Middle East & Africa
Industry Outlook and Trend Analysis
The decontamination of rooms is accomplished by dropping a consistent layer of microcondensed hydrogen peroxide vapor all over the surface inside the room. The definition of microcondensation is on the basis of a microscopic film of hydrogen peroxide vapor which is imperceptible to the naked eye. The procedure of microcondenssation renders the most suitable environment for biological inactivation and provides an entire three-dimensional kill. Vapor generators that are backed with nozzles and fans for distribution of gas that are high in speed deliver an equal segregation of hydrogen peroxide vapor. This vapor consists of oxygen and water vapor which makes this procedure debris-free. After this decontamination procedure is completed the cleaning of the surface is not required. When this procedure was initially introduced in the hospitals of the United States, it required technicians and specialists to perform the procedure. Nonetheless, with time this procedure has enhanced and the regular staff in hospitals can be trained to perform this procedure in a safe manner.
The increasing rates of infections that are acquired from healthcare make the environment of the hospital extensively exposed to pathogens. The people that are occupying the room can be infected with these pathogens. The risk of microbiological infection in a room can be reduced with regular cleansing. Hence, rising awareness with the aim of preventing viral infections is supplementing the growth of the hydrogen peroxide vapor decontamination system. Another factor that boosts the growth of the hydrogen peroxide vapor decontamination systems market is the international administrative organizations accentuate sterility tests and sterile processing. Manufacturers are compelled by these administrative organizations to propose sterility test processes in order to display that the product is produced in an aseptic environment. Hydrogen peroxide vapor decontamination systems are cost-efficient and have less spare time to business operations that is one of the major factors that boost the growth of this market. Incompetent decontamination of multi-bed units is said to be one of the prime factors to inhibit the growth of this market. The development of antibiotic resistance is anticipated to render significant growth opportunities to the Hydrogen peroxide vapor decontamination system market in the following years. Furthermore, strict rules being imposed in the healthcare sector and rising application of decontamination in spacecraft in the airline industry are factors that fuel the growth of this market.
The Hydrogen peroxide vapor decontamination systems market consists of top payers that are Howorth Air Technology, Getinge Group, TOMI Environmental Solutions, Inc., Angoss Software Corporation, Bioquell, plc, Labotal Scientific Equipment and Panasonic Biomedical Sales Europe B.V.
HPV Decontamination Systems Market Segmentation:
By Type:
- Movable HPV Decontamination Systems
- Fixed HPV Decontamination Systems
By Application:
- Incubators
- Autoclaves/Cage washers
- Isolators
- Rooms/facilities
By Region:
- North America
- U.S
- Canada
- Mexico
- Europe
- Germany
- France
- UK
- Italy
- Spain
- Rest of Europe
- Asia-Pacific
- Japan
- China
- Australia
- India
- South Korea
- Rest of Asia-Pacific
- Rest of the World
- Brazil
- South Africa
- Saudi Arabia
- Turkey
- United Arab Emirates
- Others
Some of the key questions answered by the report are:
- What was the market size in 2017 and forecast from 2017 to 2022?
- What will be the industry market growth from 2017 to 2022?
- What are the major drivers, restraints, opportunities, challenges, and industry trends and their impact on the market forecast?
- What are the major segments leading the market growth and why?
- Which are the leading players in the market and what are the major strategies adopted by them to sustain the market competition?
Market Classification
- HPV Decontamination Systems Market, By Type, Estimates and Forecast, 2012-2022 ($Million)
- Movable HPV Decontamination Systems
- Fixed HPV Decontamination Systems
- HPV Decontamination Systems Market, By Application, Estimates and Forecast, 2012-2022 ($Million)
- Incubators
- Autoclaves/Cage washers
- Isolators
- Rooms/facilities
- HPV Decontamination Systems Market, By Region, Estimates and Forecast, 2012-2022 ($Million)
- North America
- North America HPV Decontamination Systems Market, By Country
- North America HPV Decontamination Systems Market, By Type
- North America HPV Decontamination Systems Market, By Application
- U.S. HPV Decontamination Systems Market, By Type
- U.S. HPV Decontamination Systems Market, By Application
- Canada HPV Decontamination Systems Market, By Type
- Canada HPV Decontamination Systems Market, By Application
- Mexico HPV Decontamination Systems Market, By Type
- Mexico HPV Decontamination Systems Market, By Application
-
- Europe
- Europe HPV Decontamination Systems Market, By Country
- Europe HPV Decontamination Systems Market, By Type
- Europe HPV Decontamination Systems Market, By Application
- Germany HPV Decontamination Systems Market, By Type
- Germany HPV Decontamination Systems Market, By Application
- France HPV Decontamination Systems Market, By Type
- France HPV Decontamination Systems Market, By Application
- UK HPV Decontamination Systems Market, By Type
- UK HPV Decontamination Systems Market, By Application
- Italy HPV Decontamination Systems Market, By Type
- Italy HPV Decontamination Systems Market, By Application
- Spain HPV Decontamination Systems Market, By Type
- Spain HPV Decontamination Systems Market, By Application
- Rest of Europe HPV Decontamination Systems Market, By Type
- Rest of Europe HPV Decontamination Systems Market, By Application
-
- Asia-Pacific
- Asia-Pacific HPV Decontamination Systems Market, By Country
- Asia-Pacific HPV Decontamination Systems Market, By Type
- Asia-Pacific HPV Decontamination Systems Market, By Application
- Japan HPV Decontamination Systems Market, By Type
- Japan HPV Decontamination Systems Market, By Application
- Australia HPV Decontamination Systems Market, By Type
- Australia HPV Decontamination Systems Market, By Application
- India HPV Decontamination Systems Market, By Type
- India HPV Decontamination Systems Market, By Application
- South Korea HPV Decontamination Systems Market, By Type
- South Korea HPV Decontamination Systems Market, By Application
- Rest of Asia-Pacific HPV Decontamination Systems Market, By Type
- Rest of Asia-Pacific HPV Decontamination Systems Market, By Application
- Asia-Pacific
-
- Rest of the World
- Rest of the World HPV Decontamination Systems Market, By Country
- Rest of the World HPV Decontamination Systems Market, By Type
- Rest of the World HPV Decontamination Systems Market, By Application
- Brazil HPV Decontamination Systems Market, By Type
- Brazil HPV Decontamination Systems Market, By Application
- South Africa HPV Decontamination Systems Market, By Type
- South Africa HPV Decontamination Systems Market, By Application
- Saudi Arabia HPV Decontamination Systems Market, By Type
- Saudi Arabia HPV Decontamination Systems Market, By Application
- Turkey HPV Decontamination Systems Market, By Type
- Turkey HPV Decontamination Systems Market, By Application
- United Arab Emirates HPV Decontamination Systems Market, By Type
- United Arab Emirates HPV Decontamination Systems Market, By Application
- Others HPV Decontamination Systems Market, By Type
- Others HPV Decontamination Systems Market, By Application
- Rest of the World
TABLE OF CONTENTS
1.Introduction
1.1.Report Description
1.2.Research Methodology
1.2.1. Secondary Research
1.2.2. Primary Research
2.Executive Summary
2.1.Key Highlights
3.Market Overview
3.1.Introduction
3.1.1. Market Definition
3.1.2. Market Segmentation
3.2.Market Share Analysis
3.3.Market Dynamics
3.3.1. Drivers
3.3.1.1.Increasing demand for prevention of viral infections
3.3.1.2.International regulatory bodies projects sterility tests and aseptic processing
3.3.2. Restraints
3.3.2.1.Inefficient decontamination of open-plan multi-bed units
3.3.3. Opportunities
3.3.3.1.Growth of products manufactured under sterile circumstance
3.4.Key Industry Trends
4.Global HPV Decontamination Systems Market, By Type
4.1.Introduction
4.2.Global HPV Decontamination Systems Market Assessment and Forecast, By Type, 2012-2022
4.3.Movable HPV Decontamination Systems
4.3.1. Market Assessment and Forecast, By Region, 2012-2022 ($Million)
4.4.Fixed HPV Decontamination Systems
4.4.1. Market Assessment and Forecast, By Region, 2012-2022 ($Million)
5.Global HPV Decontamination Systems Market, By Application
5.1.Introduction
5.2.Global HPV Decontamination Systems Market Assessment and Forecast, By Application, 2012-2022
5.3.Incubators
5.3.1.1.Market Assessment and Forecast, By Region, 2012-2022 ($Million)
5.4.Autoclaves/Cage washers
5.4.1.1.Market Assessment and Forecast, By Region, 2012-2022 ($Million)
5.5.Isolators
5.5.1.1.Market Assessment and Forecast, By Region, 2012-2022 ($Million)
5.6.Rooms/facilities
5.6.1.1.Market Assessment and Forecast, By Region, 2012-2022 ($Million)
6.Global HPV Decontamination Systems Market, By Region
6.1.Introduction
6.2.Global HPV Decontamination Systems Market Assessment and Forecast, By Region, 2012-2022 ($Million)
6.3.North America
6.3.1. Market Assessment and Forecast, By Country, 2012-2022 ($Million)
6.3.2. Market Assessment and Forecast, By Type, 2012-2022 ($Million)
6.3.3. Market Assessment and Forecast, By Application, 2012-2022 ($Million)
6.3.4. U.S.
6.3.4.1.Market Assessment and Forecast, By Type, 2012-2022 ($Million)
6.3.4.2.Market Assessment and Forecast, By Application, 2012-2022 ($Million)
6.3.5. Canada
6.3.5.1.Market Assessment and Forecast, By Type, 2012-2022 ($Million)
6.3.5.2.Market Assessment and Forecast, By Application, 2012-2022 ($Million)
6.3.6. Mexico
6.3.6.1.Market Assessment and Forecast, By Type, 2012-2022 ($Million)
6.3.6.2.Market Assessment and Forecast, By Application, 2012-2022 ($Million)
6.4.Europe
6.4.1. Market Assessment and Forecast, By Country, 2012-2022 ($Million)
6.4.2. Market Assessment and Forecast, By Type, 2012-2022 ($Million)
6.4.3. Market Assessment and Forecast, By Application, 2012-2022 ($Million)
6.4.4. Germany
6.4.4.1.Market Assessment and Forecast, By Type, 2012-2022 ($Million)
6.4.4.2.Market Assessment and Forecast, By Application, 2012-2022 ($Million)
6.4.5. France
6.4.5.1.Market Assessment and Forecast, By Type, 2012-2022 ($Million)
6.4.5.2.Market Assessment and Forecast, By Type, 2012-2022 ($Million)
6.4.6. UK
6.4.6.1.Market Assessment and Forecast, By Type, 2012-2022 ($Million)
6.4.6.2.Market Assessment and Forecast, By Application, 2012-2022 ($Million)
6.4.7. Italy
6.4.7.1.Market Assessment and Forecast, By Type, 2012-2022 ($Million)
6.4.7.2.Market Assessment and Forecast, By Application, 2012-2022 ($Million)
6.4.8. Spain
6.4.8.1.Market Assessment and Forecast, By Type, 2012-2022 ($Million)
6.4.8.2.Market Assessment and Forecast, By Application, 2012-2022 ($Million)
6.4.9. Russia
6.4.9.1.Market Assessment and Forecast, By Type, 2012-2022 ($Million)
6.4.9.2.Market Assessment and Forecast, By Application, 2012-2022 ($Million)
6.4.10.Rest of Europe
6.4.10.1.Market Assessment and Forecast, By Type, 2012-2022 ($Million)
6.4.10.2.Market Assessment and Forecast, By Application, 2012-2022 ($Million)
6.5.Asia-Pacific
6.5.1. Market Assessment and Forecast, By Country, 2012-2022 ($Million)
6.5.2. Market Assessment and Forecast, By Type, 2012-2022 ($Million)
6.5.3. Market Assessment and Forecast, By Application, 2012-2022 ($Million)
6.5.4. Japan
6.5.4.1.Market Assessment and Forecast, By Type, 2012-2022 ($Million)
6.5.4.2.Market Assessment and Forecast, By Application, 2012-2022 ($Million)
6.5.5. China
6.5.5.1.Market Assessment and Forecast, By Type, 2012-2022 ($Million)
6.5.5.2.Market Assessment and Forecast, By Application, 2012-2022 ($Million)
6.5.6. Australia
6.5.6.1.Market Assessment and Forecast, By Type, 2012-2022 ($Million)
6.5.6.2.Market Assessment and Forecast, By Application, 2012-2022 ($Million)
6.5.7. India
6.5.7.1.Market Assessment and Forecast, By Type, 2012-2022 ($Million)
6.5.7.2.Market Assessment and Forecast, By Application, 2012-2022 ($Million)
6.5.8. South Korea
6.5.8.1.Market Assessment and Forecast, By Type, 2012-2022 ($Million)
6.5.8.2.Market Assessment and Forecast, By Application, 2012-2022 ($Million)
6.5.9. Taiwan
6.5.9.1.Market Assessment and Forecast, By Type, 2012-2022 ($Million)
6.5.9.2.Market Assessment and Forecast, By Application, 2012-2022 ($Million)
6.5.10.Rest of Asia-Pacific
6.5.10.1.Market Assessment and Forecast, By Type, 2012-2022 ($Million)
6.5.10.2.Market Assessment and Forecast, By Application, 2012-2022 ($Million)
6.6.Rest of the World
6.6.1. Market Assessment and Forecast, By Country, 2012-2022 ($Million)
6.6.2. Market Assessment and Forecast, By Type, 2012-2022 ($Million)
6.6.3. Market Assessment and Forecast, By Application, 2012-2022 ($Million)
6.6.4. Brazil
6.6.4.1.Market Assessment and Forecast, By Type, 2012-2022 ($Million)
6.6.4.2.Market Assessment and Forecast, By Application, 2012-2022 ($Million)
6.6.5. Turkey
6.6.5.1.Market Assessment and Forecast, By Type, 2012-2022 ($Million)
6.6.5.2.Market Assessment and Forecast, By Application, 2012-2022 ($Million)
6.6.6. Saudi Arabia
6.6.6.1.Market Assessment and Forecast, By Type, 2012-2022 ($Million)
6.6.6.2.Market Assessment and Forecast, By Application, 2012-2022 ($Million)
6.6.7. South Africa
6.6.7.1.Market Assessment and Forecast, By Type, 2012-2022 ($Million)
6.6.7.2.Market Assessment and Forecast, By Application, 2012-2022 ($Million)
6.6.8. United Arab Emirates
6.6.8.1.Market Assessment and Forecast, By Type, 2012-2022 ($Million)
6.6.8.2.Market Assessment and Forecast, By Application, 2012-2022 ($Million)
6.6.9. Others
6.6.9.1.Market Assessment and Forecast, By Type, 2012-2022 ($Million)
6.6.9.2.Market Assessment and Forecast, By Application, 2012-2022 ($Million)
7.Company Profiles
7.1.Bioquell, plc
7.1.1. Business Overview
7.1.2. Product Portfolio
7.1.3. Key Financials
7.1.4. Strategic Developments
7.2.Panasonic Biomedical Sales Europe B.V.
7.2.1. Business Overview
7.2.2. Product Portfolio
7.2.3. Key Financials
7.2.4. Strategic Developments
7.3.STERIS plc.
7.3.1. Business Overview
7.3.2. Product Portfolio
7.3.3. Key Financials
7.3.4. Strategic Developments
7.4.Getinge AB.
7.4.1. Business Overview
7.4.2. Product Portfolio
7.4.3. Key Financials
7.4.4. Strategic Developments
7.5.Fedegari Autoclavi S.p.A.
7.5.1. Business Overview
7.5.2. Product Portfolio
7.5.3. Strategic Developments
7.6.Tomi Environmental Solutions, Inc
7.6.1. Business Overview
7.6.2. Product Portfolio
7.6.3. Key Financials
7.6.4. Strategic Developments
7.7.The MBRAUN Group
7.7.1. Business Overview
7.7.2. Product Portfolio
7.7.3. Strategic Developments
7.8.Howorth Air Technology
7.8.1. Business Overview
7.8.2. Product Portfolio
7.8.3. Strategic Developments
7.9.Sterilucent, Inc.
7.9.1. Business Overview
7.9.2. Product Portfolio
7.9.3. Strategic Developments
List of Tables
Table 1.Global HPV Decontamination Systems Market, By Type ($Million), 2012-2022
Table 2.Movable HPV Decontamination Systems Market, By Region ($Million), 2012-2022
Table 3.Fixed HPV Decontamination Systems Market, By Region ($Million), 2012-2022
Table 4.Global HPV Decontamination Systems Market, By Application ($Million), 2012-2022
Table 5.Incubators Market, By Region ($Million), 2012-2022
Table 6.Autoclaves/Cage washers Market, By Region ($Million), 2012-2022
Table 7.Isolators Market, By Region ($Million), 2012-2022
Table 8.Rooms/facilities Market, By Region ($Million), 2012-2022
Table 9.Global HPV Decontamination Systems Market, By Region ($Million), 2012-2022
Table 10.North America Global HPV Decontamination Systems Market, By Country, 2012-2022 ($Million)
Table 11.North America Global HPV Decontamination Systems Market, By Type, 2012-2022 ($Million)
Table 12.North America Global HPV Decontamination Systems Market, By Application, 2012-2022 ($Million)
Table 13.U.S. Global HPV Decontamination Systems Market, By Type, 2012-2022 ($Million)
Table 14.U.S. Global HPV Decontamination Systems Market, By Application, 2012-2022 ($Million)
Table 15.Canada Global HPV Decontamination Systems Market, By Type, 2012-2022 ($Million)
Table 16.Canada Global HPV Decontamination Systems Market, By Application, 2012-2022 ($Million)
Table 17.Mexico Global HPV Decontamination Systems Market, By Type, 2012-2022 ($Million)
Table 18.Mexico Global HPV Decontamination Systems Market, By Application, 2012-2022 ($Million)
Table 19.Europe Global HPV Decontamination Systems Market, By Country, 2012-2022 ($Million)
Table 20.Europe Global HPV Decontamination Systems Market, By Type, 2012-2022 ($Million)
Table 21.Europe Global HPV Decontamination Systems Market, By Application, 2012-2022 ($Million)
Table 22.Germany Global HPV Decontamination Systems Market, By Type, 2012-2022 ($Million)
Table 23.Germany Global HPV Decontamination Systems Market, By Application, 2012-2022 ($Million)
Table 24.France Global HPV Decontamination Systems Market, By Type, 2012-2022 ($Million)
Table 25.France Global HPV Decontamination Systems Market, By Application, 2012-2022 ($Million)
Table 26.UK Global HPV Decontamination Systems Market, By Type, 2012-2022 ($Million)
Table 27.UK Global HPV Decontamination Systems Market, By Application, 2012-2022 ($Million)
Table 28.Italy Global HPV Decontamination Systems Market, By Type, 2012-2022 ($Million)
Table 29.Italy Global HPV Decontamination Systems Market, By Application, 2012-2022 ($Million)
Table 30.Spain Global HPV Decontamination Systems Market, By Type, 2012-2022 ($Million)
Table 31.Spain Global HPV Decontamination Systems Market, By Application, 2012-2022 ($Million)
Table 32.Russia Global HPV Decontamination Systems Market, By Type, 2012-2022 ($Million)
Table 33.Russia Global HPV Decontamination Systems Market, By Application, 2012-2022 ($Million)
Table 34.Rest of Europe Global HPV Decontamination Systems Market, By Type, 2012-2022 ($Million)
Table 35.Rest of Europe Global HPV Decontamination Systems Market, By Application, 2012-2022 ($Million)
Table 36.Asia-Pacific Global HPV Decontamination Systems Market, By Country, 2012-2022 ($Million)
Table 37.Asia-Pacific Global HPV Decontamination Systems Market, By Type, 2012-2022 ($Million)
Table 38.Asia-Pacific Global HPV Decontamination Systems Market, By Application, 2012-2022 ($Million)
Table 39.Japan Global HPV Decontamination Systems Market, By Type, 2012-2022 ($Million)
Table 40.Japan Global HPV Decontamination Systems Market, By Application, 2012-2022 ($Million)
Table 41.China Global HPV Decontamination Systems Market, By Type, 2012-2022 ($Million)
Table 42.China Global HPV Decontamination Systems Market, By Application, 2012-2022 ($Million)
Table 43.Australia Global HPV Decontamination Systems Market, By Type, 2012-2022 ($Million)
Table 44.Australia Global HPV Decontamination Systems Market, By Application, 2012-2022 ($Million)
Table 45.India Global HPV Decontamination Systems Market, By Type, 2012-2022 ($Million)
Table 46.India Global HPV Decontamination Systems Market, By Application, 2012-2022 ($Million)
Table 47.South Korea Global HPV Decontamination Systems Market, By Type, 2012-2022 ($Million)
Table 48.South Korea Global HPV Decontamination Systems Market, By Application, 2012-2022 ($Million)
Table 49.Taiwan Global HPV Decontamination Systems Market, By Type, 2012-2022 ($Million)
Table 50.Taiwan Global HPV Decontamination Systems Market, By Application, 2012-2022 ($Million)
Table 51.Rest of Asia-Pacific Global HPV Decontamination Systems Market, By Type, 2012-2022 ($Million)
Table 52.Rest of Asia-Pacific Global HPV Decontamination Systems Market, By Application, 2012-2022 ($Million)
Table 53.Rest of the World Global HPV Decontamination Systems Market, By Country, 2012-2022 ($Million)
Table 54.Rest of the World Global HPV Decontamination Systems Market, By Type, 2012-2022 ($Million)
Table 55.Rest of the World Global HPV Decontamination Systems Market, By Application, 2012-2022 ($Million)
Table 56.Brazil Global HPV Decontamination Systems Market, By Type, 2012-2022 ($Million)
Table 57.Brazil Global HPV Decontamination Systems Market, By Application, 2012-2022 ($Million)
Table 58.Turkey Global HPV Decontamination Systems Market, By Type, 2012-2022 ($Million)
Table 59.Turkey Global HPV Decontamination Systems Market, By Application, 2012-2022 ($Million)
Table 60.Saudi Arabia Global HPV Decontamination Systems Market, By Type, 2012-2022 ($Million)
Table 61.Saudi Arabia Global HPV Decontamination Systems Market, By Application, 2012-2022 ($Million)
Table 62.South Africa Global HPV Decontamination Systems Market, By Type, 2012-2022 ($Million)
Table 63.South Africa Global HPV Decontamination Systems Market, By Application, 2012-2022 ($Million)
Table 64.United Arab Emirates Global HPV Decontamination Systems Market, By Type, 2012-2022 ($Million)
Table 65.United Arab Emirates Global HPV Decontamination Systems Market, By Application, 2012-2022 ($Million)
Table 66.Others Global HPV Decontamination Systems Market, By Type, 2012-2022 ($Million)
Table 67.Others Global HPV Decontamination Systems Market, By Application, 2012-2022 ($Million)
Table 68.Bioquell, plc: Key Strategic Developments, 2017-2017
Table 69.Panasonic Biomedical Sales Europe B.V.: Key Strategic Developments, 2017-2017
Table 70.STERIS plc: Key Strategic Developments, 2017-2017
Table 71.Getinge AB.: Key Strategic Developments, 2017-2017
Table 72.Fedegari Autoclavi S.p.A.: Key Strategic Developments, 2017-2017
Table 73.Tomi Environmental Solutions, Inc: Key Strategic Developments, 2017-2017
Table 74.The MBRAUN Group: Key Strategic Developments, 2017-2017
Table 75.Howorth Air Technology: Key Strategic Developments, 2017-2017
Table 76.Sterilucent, Inc.: Key Strategic Developments, 2017-2017
List of Figures
Figure 1.Global HPV Decontamination Systems Market Share, By Type, 2012 & 2022 ($Million)
Figure 2.Global HPV Decontamination Systems Market, By Application, 2012 & 2022 ($Million)
Figure 4.Global HPV Decontamination Systems Market, By Region, 2017, ($Million)
Figure 5.Bioquell, plc: Net Revenues, 2017-2017 ($Million)
Figure 6.Bioquell, plc: Net Revenue Share, By Segment, 2017
Figure 7.Bioquell, plc: Net Revenue Share, By Geography, 2017
Figure 8.Panasonic Biomedical Sales Europe B.V.: Net Revenues, 2017-2017 ($Million)
Figure 9.Panasonic Biomedical Sales Europe B.V.: Net Revenue Share, By Segment, 2017
Figure 10.Panasonic Biomedical Sales Europe B.V.: Net Revenue Share, By Geography, 2017
Figure 11.STERIS plc: Net Revenues, 2017-2017 ($Million)
Figure 12.STERIS plc: Net Revenue Share, By Segment, 2017
Figure 13.STERIS plc: Net Revenue Share, By Geography, 2017
Figure 14.Getinge AB.: Net Revenues, 2017-2017 ($Million)
Figure 15.Getinge AB.: Net Revenue Share, By Segment, 2017
Figure 16.Getinge AB.: Net Revenue Share, By Geography, 2017
Figure 17.Tomi Environmental Solutions, Inc: Net Revenues, 2017-2017 ($Million)
Figure 18.Tomi Environmental Solutions, Inc: Net Revenue Share, By Segment, 2017
Figure 19.Tomi Environmental Solutions, Inc: Net Revenue Share, By Geography, 2017
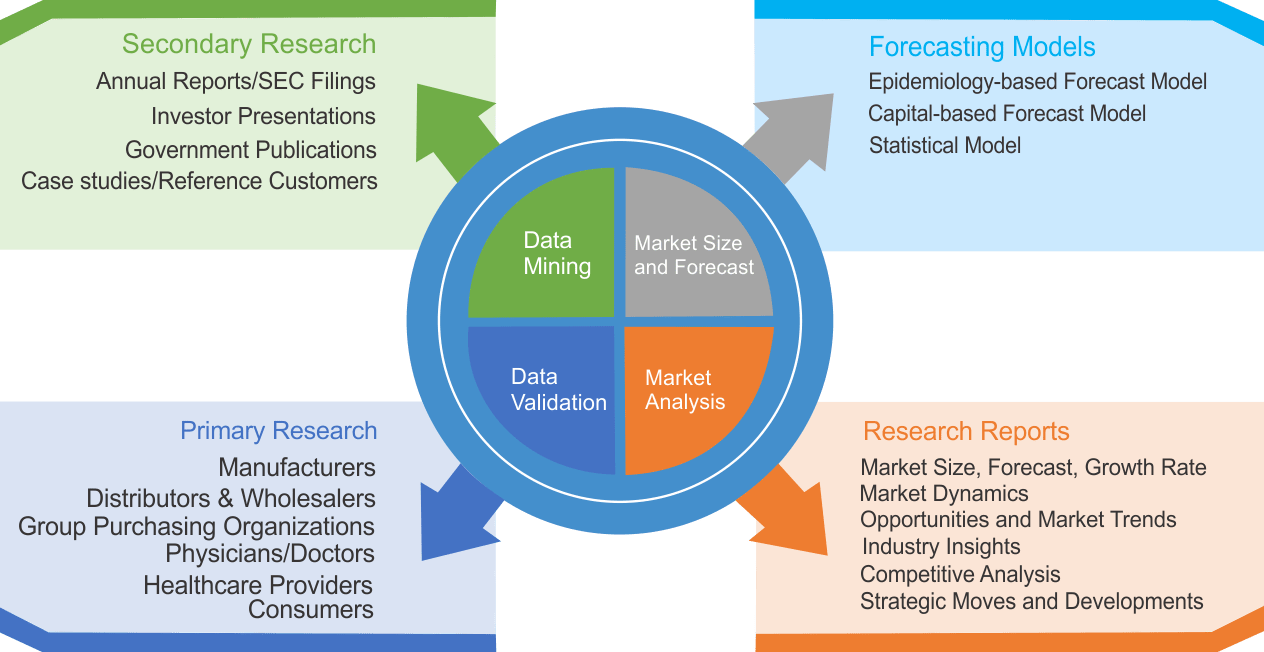
Research Methodology
We use both primary as well as secondary research for our market surveys, estimates and for developing forecast. Our research process commence by analyzing the problem which enable us to design the scope for our research study. Our research process is uniquely designed with enough flexibility to adjust according to changing nature of products and markets, while retaining core element to ensure reliability and accuracy in research findings. We understand both macro and micro-economic factors to evaluate and forecast different market segments.
Data Mining
Data is extensively collected through various secondary sources such as annual reports, investor presentations, SEC filings, and other corporate publications. We also refer trade magazines, technical journals, paid databases such as Factiva and Bloomberg, industry trade journals, scientific journals, and social media data to understand market dynamics and industry trends. Further, we also conduct primary research to understand market drivers, restraints, opportunities, challenges, and competitive scenario to build our analysis.
Data Collection Matrix
|
Data Collection Matrix |
Supply Side |
Demand Side |
|
Primary Data Sources |
|
|
|
Secondary Data Sources |
|
|
Market Modeling and Forecasting
We use epidemiology and capital equipment-based models to forecast market size of different segments at country and regional level.
- Epidemiology-based Forecasting Model: This method uses epidemiology data gathered through various publications and from physicians to estimate population of patients, flow of treatment of individual disease and therapies. The data collected through this method includes statics on incidence of disease, population suffering from disease, and treatment population. This method is used to understand:
- Number of patients for particular device or medical procedure and
- Repeated use of particular device depending on health and condition of patient
- Capital-based Forecasting Model: This method of forecasting is based on number of replacements, installed-based and new sales of capital equipment used in various healthcare and diagnostic centers. These three parameters are calculated and forecast is developed. Installation base is calculated as average number of units per facility; while sales for particular year is calculated from number of new and replace units. Secondary data is collected through various supply chain intermediaries and opinion leaders to arrive at installation and sales rate. These techniques help our analysts in validating market and developed market estimates and forecast.
We do forecast on basis of several parameters such as market drivers, market opportunities, industry trends government regulations, raw materials supply and trade dynamics to ensure relevance of forecast with market scenario. With increasing need to granulized information, we used bottom-up methodology for forecasting where we evaluate each regional segment differently and combined all forecast to develop final market forecast.
Data Validation
We believe primary research is a very important tool in analyzing and forecasting different markets. In order to make sure accuracy of our findings, our team conducts primary interviews at every stage of research to gain deep insights into current business environment and future trends and key developments in market. This includes use of various methods such as telephonic interviews, focus groups, face to face interviews and questionnaires to validate our research from all aspects. We validate our data through primary research from key industry leaders such as CEO, product managers, marketing managers, suppliers, distributors, and consumers are frequently interviewed. These interviews provide valuable insights which help us to have better market understanding besides validating our estimates and forecast.
Data Triangulation
Industry Analysis
|
Qualitative Data |
Quantitative Data (2017-2025) |
|
|