.png)
Automotive Plastics Market By Product and Application - Global Industry Analysis and Forecast to 2022
Published On : October 2017 Pages : 150 Category: Industrial Automation Report Code : ME10273
SEGMENTS & REGIONS:
- Regions: North America, Europe, Asia- Pacific, Latin America, Middle East & Africa
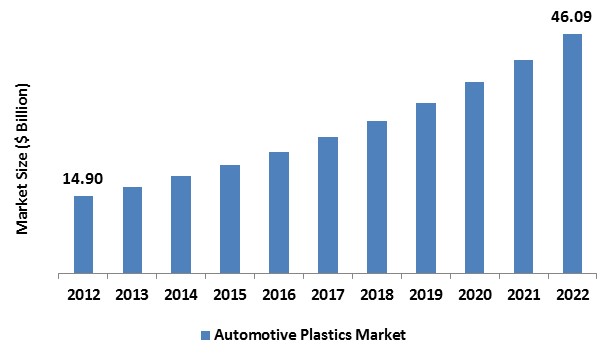
Industry Trend Analysis
In 2017, the global automotive plastics market was valued around USD billion and is anticipated to reach approximately USD billion by 2022, while maintaining a compound annual growth rate (CAGR) of % during the forecast period owing to global resurgence in the automobile segment, enhanced vehicle design and the rising significance of emission control and weight reduction are major factors fueling the growth of the global market. Plastics are extensively used in automotive parts and components due to their potential sourcing from reusable raw materials, relative ease of improved design and easiness of manufacturing. PU, PC, and ABS are a few alternative materials utilized for component and part applications of the vehicle. Generally, depending on performance requirements and fuel economy standards, an average car contains around % to % of plastics. This proportion is anticipated to augment during the approaching years, due to the increasing demand from customers for fuel-efficient, high-performance, and lightweight vehicles. Weight decline also extends a lucrative way to trim down fuel consumption and greenhouse gases emission. The polymerization of plastic monomers using catalysts in chemical reactions to create co-polymers and polymers and are twisted into polyethylene, polypropylene, polyvinyl chloride, polystyrene, polycarbonate and other polymerized plastic monomers. These materials hold extremely enhanced properties more than their individual monomers and are tremendously stable for utilizing in fabrication and molding. Designing an automotive is a vital factor as it is related to a variety of exterior forces and also the chance of major impacts. To protect the vehicle’s structural integrity, the materials used in its construction then turn into vital factors for stability and safety. Even though they are comparatively less costly, their manufacturing equipment and design parameters are extremely expensive, which is anticipated to present a challenge for market players.
Product Type Outlook and Trend Analysis
In 2017, polypropylene (PP) issued as the top product type and reported for around % of the overall volume. Polypropylene (PP) offers brilliant electrical and chemical resistance at high temperatures. PP is translucent, semi-rigid and also renders integral hinge characteristic. It is light in weight relative to other materials and extensively utilized as a noise & vibration dampeners and thermal insulator in automotive parts. In 2017, Polyurethane (PU) came out as the subsequent leading product section. PU demonstrates advanced properties like abrasive strength, high tensile strength, abrasion resistance, hardness, and impact. Rising demand from electronic appliance manufacturers and automotive OEMs for applications like seat cushioning, refrigeration insulation, and interior trims have considerably influenced the growth of the global market.
Application Outlook and Trend Analysis
In 2017, interior furnishings came out as the top application and reported for around % of the overall volume. Plastics are extensively used for automobile interiors counting seat covers, light displays & panels, fascia systems, and steering wheels. Several other interior parts like load floors, seat bases, rear package shelves, and headliners are being built completely from high-performance plastics like ABS & GMT composites, rather than traditional metal and rubber, to promote weight savings. Expansion of digitalization has nurtured the plastics demand integrated into vehicle dashboards to hold highly sophisticated electronics with innovative features & technology. High electrical insulation properties and safety concerns of plastics have fueled their demand of plastics in instrument panels carrying the advanced electronic systems.
Regional Outlook and Trend Analysis
In 2017, Asia Pacific region was the leading market and reported for almost % of the overall industry volume. The change in production setting towards developing countries of Asia Pacific region, predominantly India, China, Thailand, Indonesia and Vietnam is anticipated to influence market growth positively. Intensifying production base and rising investments in sophisticated technologies for automobile production are anticipated to bring a new automobile era, which will impact the sector positively. Customers in Asia Pacific and Europe region are highly aware of fuel efficiency contrary to nations with plenty crude oil reserves, for example, China and the United States. These are the driving factors sustainable plastics demand in developing countries across the world. Europe region has followed Asia Pacific region and in 2017, reported for approximately % of the total market revenue share. Automobile manufacturers in European regional market are also using high-performance plastics as they assist in the weight reduction of the automobile and also they are energy efficient. European economies have to fulfill advanced emission standards due to which automotive manufacturers have to move towards electrified motors from diesel engines.
Competitive Outlook and Trend Analysis
The major players in the global automotive plastics market are BASF SE, AkzoNobel N.V, Covestro, Johnson Controls, Evonik Industries AG, Magna International, SABIC, Momentive Performance Materials Inc., Borealis AG, The Dow Chemical Company, Hanwha Azdel Inc., Lear Corp., Grupo Antolin, Owens Corning, Teijin Ltd., Royal DSM N.V, and Quadrant AG. The industry has the existence of key multinational participants that are dynamically engaged in technological innovations, research and development, mergers and acquisitions and other collaborations to amend their market value and position. Moreover, companies like BASF and Hanwha Azdel Inc. have invested in the development of their manufacturing capabilities to improve their regional presence and portfolios.
The global automotive plastics market is segmented as follows :
By Product
- Polypropylene
- Polyurethanes
- Polyvinyl Chloride
- ABS
- HDPE
- Polycarbonates
- PMMA
- Polyamide
- PET
By Application
- Interior
- Exterior
- Under bonnet
By Region
- North America
- U.S
- Canada
- Mexico
- Europe
- Germany
- France
- UK
- Italy
- Spain
- Rest of Europe
- Asia-Pacific
- Japan
- China
- Australia
- India
- South Korea
- Rest of Asia Pacific
- Rest of the World
- Brazil
- South Africa
- Saudi Arabia
- United Arab Emirates
- Others
Some of the key questions answered by the report are:
- What was the market size in 2017 and forecast from 2017 to 2022?
- What will be the industry market growth from 2017 to 2022?
- What are the major drivers, restraints, opportunities, challenges, and industry trends and their impact on the market forecast?
- What are the major segments leading the market growth and why?
- Which are the leading players in the market and what are the major strategies adopted by them to sustain the market competition?
Market Classification
- Automotive Plastics Market, By Product, Estimates and Forecast, 2012-2022 ($Million)
- Polypropylene
- Polyurethanes
- Polyvinyl Chloride
- ABS
- HDPE
- Polycarbonates
- PMMA
- Polyamide
- PET
- Automotive Plastics Market, By Application, Estimates and Forecast, 2012-2022 ($Million)
- Interior
- Exterior
- Under bonnet
- Automotive Plastics Market, By Region, Estimates and Forecast, 2012-2022 ($Million)
- North America
- North America Automotive Plastics Market, By Country
- North America Automotive Plastics Market, By Product
- North America Automotive Plastics Market, By Application
- U.S. Automotive Plastics Market, By Product
- U.S. Automotive Plastics Market, By Application
- Canada Automotive Plastics Market, By Product
- Canada Automotive Plastics Market, By Application
- Mexico Automotive Plastics Market, By Product
- Mexico Automotive Plastics Market, By Application
- North America
-
- Europe
- Europe Automotive Plastics Market, By Country
- Europe Automotive Plastics Market, By Product
- Europe Automotive Plastics Market, By Application
- Germany Automotive Plastics Market, By Product
- Germany Automotive Plastics Market, By Application
- France Automotive Plastics Market, By Product
- France Automotive Plastics Market, By Application
- UK Automotive Plastics Market, By Product
- UK Automotive Plastics Market, By Application
- Italy Automotive Plastics Market, By Product
- Italy Automotive Plastics Market, By Application
- Spain Automotive Plastics Market, By Product
- Spain Automotive Plastics Market, By Application
- Rest of Europe Automotive Plastics Market, By Product
- Rest of Europe Automotive Plastics Market, By Application
-
- Asia-Pacific
- Asia-Pacific Automotive Plastics Market, By Country
- Asia-Pacific Automotive Plastics Market, By Product
- Asia-Pacific Automotive Plastics Market, By Application
- Japan Automotive Plastics Market, By Product
- Japan Automotive Plastics Market, By Application
- Australia Automotive Plastics Market, By Product
- Australia Automotive Plastics Market, By Application
- India Automotive Plastics Market, By Product
- India Automotive Plastics Market, By Application
- South Korea Automotive Plastics Market, By Product
- South Korea Automotive Plastics Market, By Application
- Rest of Asia-Pacific Automotive Plastics Market, By Product
- Rest of Asia-Pacific Automotive Plastics Market, By Application
- Asia-Pacific
-
- Rest of the World
- Rest of the World Automotive Plastics Market, By Country
- Rest of the World Automotive Plastics Market, By Product
- Rest of the World Automotive Plastics Market, By Application
- Brazil Automotive Plastics Market, By Product
- Brazil Automotive Plastics Market, By Application
- South Africa Automotive Plastics Market, By Product
- South Africa Automotive Plastics Market, By Application
- Saudi Arabia Automotive Plastics Market, By Product
- Saudi Arabia Automotive Plastics Market, By Application
- Turkey Automotive Plastics Market, By Product
- Turkey Automotive Plastics Market, By Application
- United Arab Emirates Automotive Plastics Market, By Product
- United Arab Emirates Automotive Plastics Market, By Application
- Others Automotive Plastics Market, By Product
- Others Automotive Plastics Market, By Application
- Rest of the World
Table of Contents
1. Introduction
1.1. Report Description
1.2. Research Methodology
2. Executive Summary
2.1. Key Highlights
3. Market Overview
3.1. Introduction
3.1.1. Market Definition
3.1.2. Market Segmentation
3.2. Market Dynamics
3.2.1. Drivers
3.2.1.1. Rising Demand for Light Weight Vehicles
3.2.1.2. Development in Recycling Processes
3.2.2. Restraints
3.2.2.1. High Pricing of the Raw Materials
3.2.2.2. Increasing Environmental Concerns
3.2.3. Opportunities
3.2.3.1. Emerging Markets to Offer Lucrative Growth Opportunities
4. Automotive Plastics Market, By Product
4.1. Introduction
4.2. Automotive Plastics Market Assessment and Forecast, By Product, 2012-2022
4.3. Polypropylene
4.3.1. Market Assessment and Forecast, By Region, 2012-2022 ($Million)
4.4. Polyurethanes
4.4.1. Market Assessment and Forecast, By Region, 2012-2022 ($Million)
4.5. Polyvinyl Chloride
4.5.1. Market Assessment and Forecast, By Region, 2012-2022 ($Million)
4.6. ABS
4.6.1. Market Assessment and Forecast, By Region, 2012-2022 ($Million)
4.7. HDPE
4.7.1. Market Assessment and Forecast, By Region, 2012-2022 ($Million)
4.8. Polycarbonates
4.8.1. Market Assessment and Forecast, By Region, 2012-2022 ($Million)
4.9. PMMA
4.9.1. Market Assessment and Forecast, By Region, 2012-2022 ($Million)
4.10. Polyamide
4.10.1. Market Assessment and Forecast, By Region, 2012-2022 ($Million)
4.11. PET
4.11.1. Market Assessment and Forecast, By Region, 2012-2022 ($Million)
5. Automotive Plastics Market, By Application
5.1. Introduction
5.2. The Automotive Plastics Market Assessment and Forecast, By Application, 2012-2022
5.3. Interior
5.3.1. Market Assessment and Forecast, By Region, 2012-2022 ($Million)
5.4. Exterior
5.4.1. Market Assessment and Forecast, By Region, 2012-2022 ($Million)
5.5. Under bonnet
5.5.1. Market Assessment and Forecast, By Region, 2012-2022 ($Million)
6. Automotive Plastics Market, By Region
6.1. Introduction
6.2. Automotive Plastics Market Assessment and Forecast, By Product, 2012-2022 ($Million)
6.3. Automotive Plastics Market Assessment and Forecast, By Application , 2012-2022 ($Million)
6.4. North America
6.4.1. Market Assessment and Forecast, By Country, 2012-2022 ($Million)
6.4.2. Market Assessment and Forecast, By Product, 2012-2022 ($Million)
6.4.3. Market Assessment and Forecast, By Application, 2012-2022 ($Million)
6.4.4. U.S.
6.4.4.1. Market Assessment and Forecast, By Product, 2012-2022 ($Million)
6.4.4.2. Market Assessment and Forecast, By Application, 2012-2022 ($Million)
6.4.5. Canada
6.4.5.1. Market Assessment and Forecast, By Product, 2012-2022 ($Million)
6.4.5.2. Market Assessment and Forecast, By Application, 2012-2022 ($Million)
6.4.6. Mexico
6.4.6.1. Market Assessment and Forecast, By Product, 2012-2022 ($Million)
6.4.6.2. Market Assessment and Forecast, By Application, 2012-2022 ($Million)
6.5. Europe
6.5.1. Market Assessment and Forecast, By Country, 2012-2022 ($Million)
6.5.2. Market Assessment and Forecast, By Product, 2012-2022 ($Million)
6.5.3. Market Assessment and Forecast, By Application, 2012-2022 ($Million)
6.5.4. Germany
6.5.4.1. Market Assessment and Forecast, By Product, 2012-2022 ($Million)
6.5.4.2. Market Assessment and Forecast, By Application, 2012-2022 ($Million)
6.5.5. France
6.5.5.1. Market Assessment and Forecast, By Product, 2012-2022 ($Million)
6.5.5.2. Market Assessment and Forecast, By Application, 2012-2022 ($Million)
6.5.6. UK
6.5.6.1. Market Assessment and Forecast, By Product, 2012-2022 ($Million)
6.5.6.2. Market Assessment and Forecast, By Application, 2012-2022 ($Million)
6.5.7. Italy
6.5.7.1. Market Assessment and Forecast, By Product, 2012-2022 ($Million)
6.5.7.2. Market Assessment and Forecast, By Application, 2012-2022 ($Million)
6.5.8. Spain
6.5.8.1. Market Assessment and Forecast, By Product, 2012-2022 ($Million)
6.5.8.2. Market Assessment and Forecast, By Application, 2012-2022 ($Million)
6.5.9. Rest of Europe
6.5.9.1. Market Assessment and Forecast, By Product, 2012-2022 ($Million)
6.5.9.2. Market Assessment and Forecast, By Application, 2012-2022 ($Million)
6.6. Asia-Pacific
6.6.1. Market Assessment and Forecast, By Country, 2012-2022 ($Million)
6.6.2. Market Assessment and Forecast, By Product, 2012-2022 ($Million)
6.6.3. Market Assessment and Forecast, By Application, 2012-2022 ($Million)
6.6.4. Japan
6.6.4.1. Market Assessment and Forecast, By Product, 2012-2022 ($Million)
6.6.4.2. Market Assessment and Forecast, By Application, 2012-2022 ($Million)
6.6.5. China
6.6.5.1. Market Assessment and Forecast, By Product, 2012-2022 ($Million)
6.6.5.2. Market Assessment and Forecast, By Application, 2012-2022 ($Million)
6.6.6. Australia
6.6.6.1. Market Assessment and Forecast, By Product, 2012-2022 ($Million)
6.6.6.2. Market Assessment and Forecast, By Application, 2012-2022 ($Million)
6.6.7. India
6.6.7.1. Market Assessment and Forecast, By Product, 2012-2022 ($Million)
6.6.7.2. Market Assessment and Forecast, By Application, 2012-2022 ($Million)
6.6.8. South Korea
6.6.8.1. Market Assessment and Forecast, By Product, 2012-2022 ($Million)
6.6.8.2. Market Assessment and Forecast, By Application, 2012-2022 ($Million)
6.6.9. Rest of Asia-Pacific
6.6.9.1. Market Assessment and Forecast, By Product, 2012-2022 ($Million)
6.6.9.2. Market Assessment and Forecast, By Application, 2012-2022 ($Million)
6.7. Rest of the World
6.7.1. Market Assessment and Forecast, By Country, 2012-2022 ($Million)
6.7.2. Market Assessment and Forecast, By Product, 2012-2022 ($Million)
6.7.3. Market Assessment and Forecast, By Application, 2012-2022 ($Million)
6.7.4. Brazil
6.7.4.1. Market Assessment and Forecast, By Product, 2012-2022 ($Million)
6.7.4.2. Market Assessment and Forecast, By Application, 2012-2022 ($Million)
6.7.5. Turkey
6.7.5.1. Market Assessment and Forecast, By Product, 2012-2022 ($Million)
6.7.5.2. Market Assessment and Forecast, By Application, 2012-2022 ($Million)
6.7.6. Saudi Arabia
6.7.6.1. Market Assessment and Forecast, By Product, 2012-2022 ($Million)
6.7.6.2. Market Assessment and Forecast, By Application, 2012-2022 ($Million)
6.7.7. South Africa
6.7.7.1. Market Assessment and Forecast, By Product, 2012-2022 ($Million)
6.7.7.2. Market Assessment and Forecast, By Application, 2012-2022 ($Million)
6.7.8. United Arab Emirates
6.7.8.1. Market Assessment and Forecast, By Product, 2012-2022 ($Million)
6.7.8.2. Market Assessment and Forecast, By Application, 2012-2022 ($Million)
6.7.9. Others
6.7.9.1. Market Assessment and Forecast, By Product, 2012-2022 ($Million)
6.7.9.2. Market Assessment and Forecast, By Application, 2012-2022 ($Million)
7. Company Profiles
7.1. AkzoNobel N.V.
7.1.1. Business Overview
7.1.2. Product Portfolio
7.1.3. Key Financials
7.1.4. Strategic Developments
7.2. BASF SE
7.2.1. Business Overview
7.2.2. Product Portfolio
7.2.3. Key Financials
7.2.4. Strategic Developments
7.3. Covestro
7.3.1. Business Overview
7.3.2. Product Portfolio
7.3.3. Key Financials
7.3.4. Strategic Developments
7.4. Evonik Industries AG
7.4.1. Business Overview
7.4.2. Product Portfolio
7.4.3. Key Financials
7.4.4. Strategic Developments
7.5. Johnson Controls
7.5.1. Business Overview
7.5.2. Product Portfolio
7.5.3. Key Financials
7.5.4. Strategic Developments
7.6. Magna International
7.6.1. Business Overview
7.6.2. Product Portfolio
7.6.3. Key Financials
7.6.4. Strategic Developments
7.7. Momentive Performance Materials Inc.
7.7.1. Business Overview
7.7.2. Product Portfolio
7.7.3. Strategic Developments
7.8. SABIC
7.8.1. Business Overview
7.8.2. Product Portfolio
7.8.3. Key Financials
7.8.4. Strategic Developments
7.9. The Dow Chemical Company
7.9.1. Business Overview
7.9.2. Product Portfolio
7.9.3. Key Financials
7.9.4. Strategic Developments
7.10. Borealis AG
7.10.1. Business Overview
7.10.2. Product Portfolio
7.10.3. Key Financials
7.10.4. Strategic Developments
List of Tables
Table 1.Global Automotive Plastics Market, By Product, 2012-2022 ($Million)
Table 2.PolypropyleneMarket, By Region, 2012-2022 ($Million)
Table 4.Polyurethanes Market, By Region, 2012-2022 ($Million)
Table 5.Polyvinyl Chloride Market, By Region, 2012-2022 ($Million)
Table 6.ABS Market, By Application, 2012-2022 ($Million)
Table 7.HDPE Market, By Region, 2012-2022 ($Million)
Table 8.PolycarbonatesMarket, By Region, 2012-2022 ($Million)
Table 9.PMMA Market, By Region, 2012-2022 ($Million)
Table 10.Polyamide Market, By Region, 2012-2022 ($Million)
Table 11.PET Market, By Region, 2012-2022 ($Million)
Table 12.Automotive Plastics Market, By Application, 2012-2022 ($Million)
Table 13.Interior Market, By Application, 2012-2022 ($Million)
Table 14.Exterior Market, By Region, 2012-2022 ($Million)
Table 15.Under bonnet Market, By Region, 2012-2022 ($Million)
Table 16.North America Automotive Plastics Market, By Product, 2012-2022 ($Million)
Table 17.North America Automotive Plastics Market, By Application, 2012-2022 ($Million)
Table 18.U.S. Automotive Plastics Market, By Product, 2012-2022 ($Million)
Table 19.U.S. Automotive Plastics Market, By Application, 2012-2022 ($Million)
Table 20.Canada Automotive Plastics Market, By Product, 2012-2022 ($Million)
Table 21.Canada Automotive Plastics Market, By Application, 2012-2022 ($Million)
Table 22.Mexico Automotive Plastics Market, By Product, 2012-2022 ($Million)
Table 23.Mexico Automotive Plastics Market, By Application, 2012-2022 ($Million)
Table 24.Europe Automotive Plastics Market, By Country, 2012-2022 ($Million)
Table 25.Europe Automotive Plastics Market, By Product, 2012-2022 ($Million)
Table 26.Europe Automotive Plastics Market, By Application, 2012-2022 ($Million)
Table 27.Germany Automotive Plastics Market, By Product, 2012-2022 ($Million)
Table 28.Germany Automotive Plastics Market, By Application, 2012-2022 ($Million)
Table 29.France Automotive Plastics Market, By Product, 2012-2022 ($Million)
Table 30.France Automotive Plastics Market, By Application, 2012-2022 ($Million)
Table 31.UK Automotive Plastics Market, By Product, 2012-2022 ($Million)
Table 32.UK Automotive Plastics Market, By Application, 2012-2022 ($Million)
Table 33.Italy Automotive Plastics Market, By Product, 2012-2022 ($Million)
Table 34.Italy Automotive Plastics Market, By Application, 2012-2022 ($Million)
Table 35.Spain Automotive Plastics Market, By Product, 2012-2022 ($Million)
Table 36.Spain Automotive Plastics Market, By Application, 2012-2022 ($Million)
Table 37.Rest of Europe Automotive Plastics Market, By Product, 2012-2022 ($Million)
Table 38.Rest of Europe Automotive Plastics Market, By Application, 2012-2022 ($Million)
Table 39.Asia-Pacific Automotive Plastics Market, By Country, 2012-2022 ($Million)
Table 40.Asia-Pacific Automotive Plastics Market, By Product, 2012-2022 ($Million)
Table 41.Asia-Pacific Automotive Plastics Market, By Application, 2012-2022 ($Million)
Table 42.Japan Automotive Plastics Market, By Product, 2012-2022 ($Million)
Table 43.Japan Automotive Plastics Market, By Application, 2012-2022 ($Million)
Table 44.China Automotive Plastics Market, By Product, 2012-2022 ($Million)
Table 45.China Automotive Plastics Market, By Application, 2012-2022 ($Million)
Table 46.Australia Automotive Plastics Market, By Product, 2012-2022 ($Million)
Table 47.Australia Automotive Plastics Market, By Application, 2012-2022 ($Million)
Table 48.India Automotive Plastics Market, By Product, 2012-2022 ($Million)
Table 49.India Automotive Plastics Market, By Application, 2012-2022 ($Million)
Table 50.South Korea Automotive Plastics Market, By Product, 2012-2022 ($Million)
Table 51.South Korea Automotive Plastics Market, By Application, 2012-2022 ($Million)
Table 52.Rest of Asia-Pacific Automotive Plastics Market, By Product, 2012-2022 ($Million)
Table 53.Rest of Asia-Pacific Automotive Plastics Market, By Application, 2012-2022 ($Million)
Table 54.Rest of the World Automotive Plastics Market, By Country, 2012-2022 ($Million)
Table 55.Rest of the World Automotive Plastics Market, By Product, 2012-2022 ($Million)
Table 56.Rest of the World Automotive Plastics Market, By Application, 2012-2022 ($Million)
Table 57.Brazil Automotive Plastics Market, By Product, 2012-2022 ($Million)
Table 58.Brazil Automotive Plastics Market, By Application, 2012-2022 ($Million)
Table 59.Turkey Automotive Plastics Market, By Product, 2012-2022 ($Million)
Table 60.Turkey Automotive Plastics Market, By Application, 2012-2022 ($Million)
Table 61.Saudi Arabia Automotive Plastics Market, By Product, 2012-2022 ($Million)
Table 62.Saudi Arabia Automotive Plastics Market, By Application, 2012-2022 ($Million)
Table 63.South Africa Automotive Plastics Market, By Product, 2012-2022 ($Million)
Table 64.South Africa Automotive Plastics Market, By Application, 2012-2022 ($Million)
Table 65.United Arab Emirates Automotive Plastics Market, By Product, 2012-2022 ($Million)
Table 66.United Arab Emirates Automotive Plastics Market, By Application, 2012-2022 ($Million)
Table 67.Others Automotive Plastics Market, By Product, 2012-2022 ($Million)
Table 68.Others Automotive Plastics Market, By Application, 2012-2022 ($Million)
Table 69.AkzoNobel N.V.: Key Strategic Developments, 2017-2017
Table 70.BASF SE: Key Strategic Developments, 2017-2017
Table 71.Covestro: Key Strategic Developments, 2017-2017
Table 72.Evonik Industries AG: Key Strategic Developments, 2017-2017
Table 73.Johnson Controls: Key Strategic Developments, 2017-2017
Table 74.Magna International: Key Strategic Developments, 2017-2017
Table 75.Momentive Performance Materials Inc.: Key Strategic Developments, 2017-2017
Table 76.SABIC: Key Strategic Developments, 2017-2017
Table 77.The Dow Chemical Company: Key Strategic Developments, 2017-2017
Table 78.Borealis AG: Key Strategic Developments, 2017-2017
List of Figures
Figure 1.Global Automotive Plastics Market Share, By Product, 2017 & 2025
Figure 2.Global Automotive Plastics Market, By Application, 2017, ($Million)
Figure 3.Global Automotive Plastics Market, By Region, 2017, ($Million)
Figure 4.AkzoNobel N.V.: Net Revenues, 2017-2017 ($Million)
Figure 5.AkzoNobel N.V.: Net Revenue Share, By Segment, 2017
Figure 6.AkzoNobel N.V.: Net Revenue Share, By Geography, 2017
Figure 7.BASF SE: Net Revenues, 2017-2017 ($Million)
Figure 8.BASF SE: Net Revenue Share, By Segment, 2017
Figure 9.BASF SE: Net Revenue Share, By Geography, 2017
Figure 10.Covestro: Net Revenues, 2017-2017 ($Million)
Figure 11.Covestro: Net Revenue Share, By Segment, 2017
Figure 12.Covestro: Net Revenue Share, By Geography, 2017
Figure 10.Evonik Industries AG: Net Revenues, 2017-2017 ($Million)
Figure 11.Evonik Industries AG: Net Revenue Share, By Segment, 2017
Figure 12.Evonik Industries AG: Net Revenue Share, By Geography, 2017
Figure 10.Johnson Controls: Net Revenues, 2017-2017 ($Million)
Figure 11.Johnson Controls: Net Revenue Share, By Segment, 2017
Figure 12.Johnson Controls: Net Revenue Share, By Geography, 2017
Figure 10.Magna International: Net Revenues, 2017-2017 ($Million)
Figure 11.Magna International: Net Revenue Share, By Segment, 2017
Figure 12.Magna International: Net Revenue Share, By Geography, 2017
Figure 10.SABIC: Net Revenues, 2017-2017 ($Million)
Figure 11.SABIC: Net Revenue Share, By Segment, 2017
Figure 12.SABIC: Net Revenue Share, By Geography, 2017
Figure 10.The Dow Chemical Company: Net Revenues, 2017-2017 ($Million)
Figure 11.The Dow Chemical Company: Net Revenue Share, By Segment, 2017
Figure 12.The Dow Chemical Company: Net Revenue Share, By Geography, 2017
Figure 10.Borealis AG: Net Revenues, 2017-2017 ($Million)
Figure 11.Borealis AG: Net Revenue Share, By Segment, 2017
Figure 12.Borealis AG: Net Revenue Share, By Geography, 2017
Research Methodology
We use both primary as well as secondary research for our market surveys, estimates and for developing forecast. Our research process commence by analyzing the problem which enable us to design the scope for our research study. Our research process is uniquely designed with enough flexibility to adjust according to changing nature of products and markets, while retaining core element to ensure reliability and accuracy in research findings. We understand both macro and micro-economic factors to evaluate and forecast different market segments.
Data Mining
Data is extensively collected through various secondary sources such as annual reports, investor presentations, SEC filings, and other corporate publications. We also refer trade magazines, technical journals, paid databases such as Factiva and Bloomberg, industry trade journals, scientific journals, and social media data to understand market dynamics and industry trends. Further, we also conduct primary research to understand market drivers, restraints, opportunities, challenges, and competitive scenario to build our analysis.
Data Collection Matrix
|
Data Collection Matrix |
Supply Side |
Demand Side |
|
Primary Data Sources |
|
|
|
Secondary Data Sources |
|
|
Market Modeling and Forecasting
We use epidemiology and capital equipment-based models to forecast market size of different segments at country and regional level.
- Epidemiology-based Forecasting Model: This method uses epidemiology data gathered through various publications and from physicians to estimate population of patients, flow of treatment of individual disease and therapies. The data collected through this method includes statics on incidence of disease, population suffering from disease, and treatment population. This method is used to understand:
- Number of patients for particular device or medical procedure and
- Repeated use of particular device depending on health and condition of patient
- Capital-based Forecasting Model: This method of forecasting is based on number of replacements, installed-based and new sales of capital equipment used in various healthcare and diagnostic centers. These three parameters are calculated and forecast is developed. Installation base is calculated as average number of units per facility; while sales for particular year is calculated from number of new and replace units. Secondary data is collected through various supply chain intermediaries and opinion leaders to arrive at installation and sales rate. These techniques help our analysts in validating market and developed market estimates and forecast.
We do forecast on basis of several parameters such as market drivers, market opportunities, industry trends government regulations, raw materials supply and trade dynamics to ensure relevance of forecast with market scenario. With increasing need to granulized information, we used bottom-up methodology for forecasting where we evaluate each regional segment differently and combined all forecast to develop final market forecast.
Data Validation
We believe primary research is a very important tool in analyzing and forecasting different markets. In order to make sure accuracy of our findings, our team conducts primary interviews at every stage of research to gain deep insights into current business environment and future trends and key developments in market. This includes use of various methods such as telephonic interviews, focus groups, face to face interviews and questionnaires to validate our research from all aspects. We validate our data through primary research from key industry leaders such as CEO, product managers, marketing managers, suppliers, distributors, and consumers are frequently interviewed. These interviews provide valuable insights which help us to have better market understanding besides validating our estimates and forecast.
Data Triangulation

Industry Analysis
|
Qualitative Data |
Quantitative Data (2017-2025) |
|
|