.png)
Amino Acids Market by Product Type and Application - Global Industry Analysis and Forecast to 2022
Published On : October 2017 Pages : 177 Category: Animal Feed and Feed Additives Report Code : FB10264
SEGMENTS & REGIONS:
- Regions: North America, Europe, Asia- Pacific, Latin America, Middle East & Africa
Industry Trend Analysis
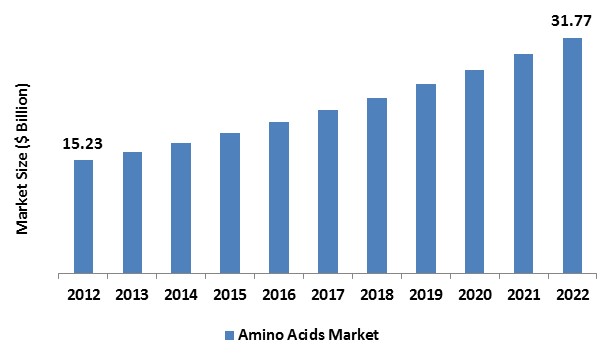
In 2017, the global amino acid market was valued around USD billion and is anticipated to reach approximately USD billion by 2022, while maintaining a compound annual growth rate (CAGR) of % during the forecast period owing to increasing consumption of meat together with increased production of livestock such as cattle, swine, and broiler. This trend is anticipated to remain as a major factor driving the market growth during the next few years. Lysine, threonine, methionine, and tryptophan are extensively utilized in animal feed additives since they are necessary for regulating all metabolic processes and good health. Animal feed helps in appropriate weight gain and faster growth of the livestock. Rising consumption of meat as a protein source around the globe is intended to influence the global market growth positively. Rising awareness about the benefits of animal feed additives together with the recent outburst of illnesses has impelled the amplified the additives consumption in animal feed. Rising population combined with rising disposable earnings per person, particularly in developing countries of Asia Pacific like India and China are anticipated to boost the demand for animal feed additives and consecutively, boost the growth of global amino acids industry. Growing demand for food & dietary supplements due to geriatric population along with amending health measures is anticipated to boost global demand. Rising prevalence of obesity amongst the younger population in the United States and the United Kingdom is expected to drive dietary supplements industry and boost the global market growth. The geriatric population in Brazil and Japan are also projected to augment the consumption of food & dietary supplements. Rising demand for sports supplements from bodybuilders and athletes particularly in the United States and the United Kingdom is anticipated to positively impact the global market growth. Growing demand of L-glutamate from food & beverage market due to flavor enhancement characteristic is estimated to boost the growth of the global market. L-Glutamate is extensively utilized in convenience and processed food, on account of brilliant flavor enhancing characteristics. L-glutamate acid’s sodium salt renders an umami taste that escalates savory and meaty flavor of food. Growing consumption of processed food in developing countries of Latin America and Asia Pacific due to altering food habits along with hectic routine is anticipated to fuel the L-glutamate demand and consecutively propel the global market. Growing living standards together with an elevated buying power of consumers are anticipated to boost the demand of product for the pharmaceutical application. Increasing demand for sweeteners from ready-to-drink beverages and convenience food is expected to fuel demand for phenylalanine and L-aspartic acid. Rigid supply of raw material is projected to lay challenges for market participants and might hamper global market growth. Rising costs of raw materials like wheat, soybean, and corn in the recent period is likely to affect the profitability of market. The introduction of microfiltration process for escalating yield is predicted to render lucrative growth opportunities for market players.
Product Outlook and Trend Analysis
In 2017, L-Glutamate was the top product and reported for nearly half of global market volume. L-Glutamate is widely utilized in food & beverage industry owing to flavor enhancing characteristics. It is a component of fermented or aged foods like soy sauce and cheese. Rising consumption of processed food is anticipated to boost the demand of L-Glutamate during the forecast period. Methionine, lysine, tryptophan, and threonine together reported for the largest share of amino acids industry for animal feed additives market. Methionine is extensively required for the poultry industry while Lysine is widely consumed in the pork industry. Rising demand for food & dietary supplements in the United States and the United Kingdom due to the geriatric population and growing awareness levels among consumers is encouraging the global market growth. Creatine, Citrulline, tyrosine, and proline are utilized in the production of dietary supplements.
Source Outlook and Trend Analysis
Over the past few years, plant-based raw materials have been the major amino acid source. Wheat, soybean, and corn-based acids are extensively utilized in end-user industries like food & dietary supplements, animal feed additives, the pharmaceutical industry and flavor enhancer due to its elevated health benefits. Rising preference of consumer for bio-based products is projected to produce a high requirement for plant-based acids further. Animal-based staples like meat meal and fish silage are predicted to experience average growth due to the ban on meat & bone food in Europe and customer sentiments. Inadequate availability of plant-based raw material is anticipated to hamper the growth of the global market.
Application Outlook and Trend Analysis
In 2017, animal feed applications ruled the global market. Methionine, lysine, threonine, and tryptophan are widely utilized in the industry of animal feed additives, due to health benefits like weight gain and high metabolism. Growing consumption of meat in Latin America and Asia Pacific is anticipated to boost the growth of the global market during the projected period. The introduction of innovative animal based and plant based acids are projected to render lucrative growth opportunities to market players. Food & Dietary Supplements are one more major application industry, expected to show major growth on account of demographics together with varying food habits. Rising demand of sports supplements is intended to impact the global demand positively. Requirements from pharmaceutical applications are anticipated to expand at the considerable rate due to growing application like buffering agents in antiperspirants, antacids, and analgesics.
Regional Outlook and Trend Analysis
In 2017, Asia Pacific regional amino acids market ruled global demand and is anticipated to maintain its supremacy during the projected period. China has been a major pork supplier during the last few years, with the inland industry distinguished by the existence of several small-scale market participants. Europe region is projected to experience average growth in demand during the forecast years due to rising demand from food & dietary supplements segment. The North American regional amino acids market is likely to experience stable growth during the projected period. Increasing CVD and obesity occurrence is anticipated to propel food & dietary supplements demand in this region.
Competitive Outlook and Trend Analysis
The global amino acids marke4t is extremely competitive with regular strategic alliances, acquisitions, and mergers. Major market players are Cargill Inc., Ajinomoto Co., Inc., Evonik Industries AG, Prinova U.S. LLC, Royal DSM, and ADM. Market players like Kemin Europa and Royal DSM are totally incorporated over the whole value chain, using sesame seeds, soy meal and other elements for the production of amino acid. Beijing FortuneStar S&T Development Co., Ltd. utilizes amino acids for chelates production.
The global amino acids market is segmented as follows –
By Product
- Lysine
- L-Glutamate
- Methionine
- Tryptophan
- Threonine
- Iso-leucine
- Valine
- Leucine
- Arginine
- Glutamine
- Phenylalanine
- Glycine
- Citrulline
- Creatine
- Serine
- Tyrosine
- Proline
- Others
By Source
- Plant based
- Animal based
By Application
- Animal Feed
- Animal feed by livestock
- Poultry
- Swine
- Cattle
- Others
- Animal feed by livestock
- Food & dietary supplements
- Pharmaceuticals
By Region
- North America
- U.S
- Canada
- Mexico
- Europe
- Germany
- France
- UK
- Italy
- Spain
- Rest of Europe
- Asia-Pacific
- Japan
- China
- Australia
- India
- South Korea
- Rest of Asia Pacific
- Rest of the World
- Brazil
- South Africa
- Saudi Arabia
- United Arab Emirates
- Others
Some of the key questions answered by the report are:
- What was the market size in 2017 and forecast from 2017 to 2022?
- What will be the industry market growth from 2017 to 2022?
- What are the major drivers, restraints, opportunities, challenges, and industry trends and their impact on the market forecast?
- What are the major segments leading the market growth and why?
- Which are the leading players in the market and what are the major strategies adopted by them to sustain the market competition?
Market Classification
- Amino Acids Market, By Product, Estimates and Forecast, 2012-2022 ($Million)
- Tryptophan
- Leucine
- Iso-leucine
- Valine
- Glutamine
- L-Glutamate
- Lysine
- Methionine
- Threonine
- Creatine
- Proline
- Serine
- Arginine
- Glycine
- Phenylalanine
- Tyrosine
- Citrulline
- Other Products
- Amino Acids Market, By Raw Material, Estimates and Forecast, 2012-2022 ($Million)
- Animal-based
- Plant-based
- Amino Acids Market, By Product, Estimates and Forecast, 2012-2022 ($Million)
- Animal-based
- Plant-based
- Food & Dietary Supplements
- Animal feed
- Animal feed by livestock
- Swine
- Poultry
- Cattle
- Other Animal feeds
- Animal feed by livestock
- Pharmaceuticals
- Amino Acids Market, By Region, Estimates and Forecast, 2012-2022 ($Million)
- North America
- North America Amino Acids Market, By Country
- North America Amino Acids Market, By Product
- North America Amino Acids Market, By Raw Material
- North America Amino Acids Market, By Application
- U.S. Amino Acids Market, By Product
- U.S. Amino Acids Market, By Raw Material
- U.S. Amino Acids Market, By Application
- Canada Amino Acids Market, By Product
- Canada Amino Acids Market, By Raw Material
- Canada Amino Acids Market, By Application
- Mexico Amino Acids Market, By Product
- Mexico Amino Acids Market, By Raw Material
- Mexico Amino Acids Market, By Application
-
- Europe
- Europe Amino Acids Market, By Country
- Europe Amino Acids Market, By Product
- Europe Amino Acids Market, By Raw Material
- Europe Amino Acids Market, By Application
- Germany Amino Acids Market, By Product
- Germany Amino Acids Market, By Raw Material
- Germany Amino Acids Market, By Application
- France Amino Acids Market, By Product
- France Amino Acids Market, By Raw Material
- France Amino Acids Market, By Application
- UK Amino Acids Market, By Product
- UK Amino Acids Market, By Raw Material
- UK Amino Acids Market, By Application
- Italy Amino Acids Market, By Product
- Italy Amino Acids Market, By Raw Material
- Italy Amino Acids Market, By Application
- Spain Amino Acids Market, By Product
- Spain Amino Acids Market, By Raw Material
- Spain Amino Acids Market, By Application
- Rest of Europe Amino Acids Market, By Product
- Rest of Europe Amino Acids Market, By Raw Material
- Rest of Europe Amino Acids Market, By Application
-
- Asia-Pacific
- Asia-Pacific Amino Acids Market, By Country
- Asia-Pacific Amino Acids Market, By Product
- Asia-Pacific Amino Acids Market, By Raw Material
- Asia-Pacific Amino Acids Market, By Application
- Japan Amino Acids Market, By Product
- Japan Amino Acids Market, By Raw Material
- Japan Amino Acids Market, By Application
- Australia Amino Acids Market, By Product
- Australia Amino Acids Market, By Raw Material
- Australia Amino Acids Market, By Application
- India Amino Acids Market, By Product
- India Amino Acids Market, By Raw Material
- India Amino Acids Market, By Application
- South Korea Amino Acids Market, By Product
- South Korea Amino Acids Market, By Raw Material
- South Korea Amino Acids Market, By Application
- Rest of Asia-Pacific Amino Acids Market, By Product
- Rest of Asia-Pacific Amino Acids Market, By Raw Material
- Rest of Asia-Pacific Amino Acids Market, By Application
- Asia-Pacific
-
- Rest of the World
- Rest of the World Amino Acids Market, By Country
- Rest of the World Amino Acids Market, By Product
- Rest of the World Amino Acids Market, By Raw Material
- Rest of the World Amino Acids Market, By Application
- Brazil Amino Acids Market, By Product
- Brazil Amino Acids Market, By Raw Material
- Brazil Amino Acids Market, By Application
- South Africa Amino Acids Market, By Product
- South Africa Amino Acids Market, By Raw Material
- South Africa Amino Acids Market, By Application
- Saudi Arabia Amino Acids Market, By Product
- Saudi Arabia Amino Acids Market, By Raw Material
- Saudi Arabia Amino Acids Market, By Application
- Turkey Amino Acids Market, By Product
- Turkey Amino Acids Market, By Raw Material
- Turkey Amino Acids Market, By Application
- United Arab Emirates Amino Acids Market, By Product
- United Arab Emirates Amino Acids Market, By Raw Material
- United Arab Emirates Amino Acids Market, By Application
- Others Amino Acids Market, By Product
- Others Amino Acids Market, By Raw Material
- Others Amino Acids Market, By Application
- Rest of the World
Table of Contents
1. Introduction
1.1. Report Description
1.2. Research Methodology
1.2.1. Secondary Research
1.2.2. Primary Research
2. Executive Summary
2.1. Key Highlights
3. Market Overview
3.1. Introduction
3.1.1. Market Definition
3.1.2. Market Segmentation
3.2. Market Dynamics
3.2.1. Drivers
3.2.1.1. Growing meat consumption
3.2.1.2. Rising dietary supplements demand
3.2.1.3. Increasing demand of sweeteners
3.2.2. Restraints
3.2.2.1. Un-stabilize supply of Raw Materials
3.2.3. Opportunities
3.2.3.1. Technological advancement in dietary supplements
4. Amino Acids Market, By Product
4.1. Introduction
4.2. Amino Acids Market Assessment and Forecast, By Product, 2012-2022
4.3. Tryptophan
4.3.1. Market Assessment and Forecast, By Region, 2012-2022 ($Million)
4.4. Leucine
4.4.1. Market Assessment and Forecast, By Region, 2012-2022 ($Million)
4.5. Iso-leucine
4.5.1. Market Assessment and Forecast, By Region, 2012-2022 ($Million)
4.6. Valine
4.6.1. Market Assessment and Forecast, By Region, 2012-2022 ($Million)
4.7. Glutamine
4.7.1. Market Assessment and Forecast, By Region, 2012-2022 ($Million)
4.8. L-Glutamate
4.8.1. Market Assessment and Forecast, By Region, 2012-2022 ($Million)
4.9. Lysine
4.9.1. Market Assessment and Forecast, By Region, 2012-2022 ($Million)
4.10. Methionine
4.10.1. Market Assessment and Forecast, By Region, 2012-2022 ($Million)
4.11. Threonine
4.11.1. Market Assessment and Forecast, By Region, 2012-2022 ($Million)
4.12. Creatine
4.12.1. Market Assessment and Forecast, By Region, 2012-2022 ($Million)
4.13. Proline
4.13.1. Market Assessment and Forecast, By Region, 2012-2022 ($Million)
4.14. Serine
4.14.1. Market Assessment and Forecast, By Region, 2012-2022 ($Million)
4.15. Arginine
4.15.1. Market Assessment and Forecast, By Region, 2012-2022 ($Million)
4.16. Glycine
4.16.1. Market Assessment and Forecast, By Region, 2012-2022 ($Million)
4.17. Phenylalanine
4.17.1. Market Assessment and Forecast, By Region, 2012-2022 ($Million)
4.18. Tyrosine
4.18.1. Market Assessment and Forecast, By Region, 2012-2022 ($Million)
4.19. Citrulline
4.19.1. Market Assessment and Forecast, By Region, 2012-2022 ($Million)
4.20. Other Products
4.20.1. Market Assessment and Forecast, By Region, 2012-2022 ($Million)
5. Amino Acids Market, By Raw Material
5.1. Introduction
5.2. Amino Acids Market Assessment and Forecast, By Raw Material, 2012-2022
5.3. Animal-based
5.3.1. Market Assessment and Forecast, By Region, 2012-2022 ($Million)
5.4. Plant-based
5.4.1. Market Assessment and Forecast, By Region, 2012-2022 ($Million)
6. Amino Acids Market, By Application
6.1. Introduction
6.2. Amino Acids Market Assessment and Forecast, By Application, 2012-2022 ($Million)
6.3. Food & Dietary Supplements
6.3.1. Market Assessment and Forecast, By Region, 2012-2022 ($Million)
6.4. Animal feed
6.4.1. Market Assessment and Forecast, By Type, 2012-2022 ($Million)
6.4.2. Market Assessment and Forecast, By Region, 2012-2022 ($Million)
6.4.2.1. Animal feed by livestock
6.4.2.1.1. Market Assessment and Forecast, By Type, 2012-2022 ($Million)
6.4.2.1.2. Market Assessment and Forecast, By Region, 2012-2022 ($Million)
6.4.2.1.2.1.Swine
6.4.2.1.2.1.1. Market Assessment and Forecast, By Region, 2012-2022 ($Million)
6.4.2.1.2.2.Poultry
6.4.2.1.2.2.1. Market Assessment and Forecast, By Region, 2012-2022 ($Million)
6.4.2.1.2.3.Cattle
6.4.2.1.2.3.1. Market Assessment and Forecast, By Region, 2012-2022 ($Million)
6.4.2.1.2.4.Other Animal feeds
6.4.2.1.2.4.1. Market Assessment and Forecast, By Region, 2012-2022 ($Million)
6.5. Pharmaceuticals
6.5.1. Market Assessment and Forecast, By Region, 2012-2022 ($Million)
7. Amino Acids Market, By Region
7.1. Introduction
7.2. Amino Acids Market Assessment and Forecast, By Region, 2012-2022 ($Million)
7.3. North America
7.3.1. Market Assessment and Forecast, By Country, 2012-2022 ($Million)
7.3.2. Market Assessment and Forecast, By Product, 2012-2022 ($Million)
7.3.3. Market Assessment and Forecast, By Raw Material, 2012-2022 ($Million)
7.3.4. Market Assessment and Forecast, By Application, 2012-2022 ($Million)
7.3.4.1. U.S.
7.3.4.1.1. Market Assessment and Forecast, By Product, 2012-2022 ($Million)
7.3.4.1.2. Market Assessment and Forecast, By Raw Material, 2012-2022 ($Million)
7.3.4.1.3. Market Assessment and Forecast, By Application, 2012-2022 ($Million)
7.3.4.2. Canada
7.3.4.2.1. Market Assessment and Forecast, By Product, 2012-2022 ($Million)
7.3.4.2.2. Market Assessment and Forecast, By Raw Material, 2012-2022 ($Million)
7.3.4.2.3. Market Assessment and Forecast, By Application, 2012-2022 ($Million)
7.3.4.3. Mexico
7.3.4.3.1. Market Assessment and Forecast, By Product, 2012-2022 ($Million)
7.3.4.3.2. Market Assessment and Forecast, By Raw Material, 2012-2022 ($Million)
7.3.4.3.3. Market Assessment and Forecast, By Application, 2012-2022 ($Million)
7.4. Europe
7.4.1. Market Assessment and Forecast, By Country, 2012-2022 ($Million)
7.4.2. Market Assessment and Forecast, By Product, 2012-2022 ($Million)
7.4.3. Market Assessment and Forecast, By Raw Material, 2012-2022 ($Million)
7.4.4. Market Assessment and Forecast, By Application, 2012-2022 ($Million)
7.4.4.1. Germany
7.4.4.1.1. Market Assessment and Forecast, By Product, 2012-2022 ($Million)
7.4.4.1.2. Market Assessment and Forecast, By Raw Material, 2012-2022 ($Million)
7.4.4.1.3. Market Assessment and Forecast, By Application, 2012-2022 ($Million)
7.4.4.2. France
7.4.4.2.1. Market Assessment and Forecast, By Product, 2012-2022 ($Million)
7.4.4.2.2. Market Assessment and Forecast, By Raw Materials, 2012-2022 ($Million)
7.4.4.2.3. Market Assessment and Forecast, By Application, 2012-2022 ($Million)
7.4.4.3. UK
7.4.4.3.1. Market Assessment and Forecast, By Product, 2012-2022 ($Million)
7.4.4.3.2. Market Assessment and Forecast, By Raw Material, 2012-2022 ($Million)
7.4.4.3.3. Market Assessment and Forecast, By Application, 2012-2022 ($Million)
7.4.4.4. Italy
7.4.4.4.1. Market Assessment and Forecast, By Product, 2012-2022 ($Million)
7.4.4.4.2. Market Assessment and Forecast, By Raw Material, 2012-2022 ($Million)
7.4.4.4.3. Market Assessment and Forecast, By Application, 2012-2022 ($Million)
7.4.4.5. Spain
7.4.4.5.1. Market Assessment and Forecast, By Product, 2012-2022 ($Million)
7.4.4.5.2. Market Assessment and Forecast, By Raw Material, 2012-2022 ($Million)
7.4.4.5.3. Market Assessment and Forecast, By Application, 2012-2022 ($Million)
7.4.4.6. Rest of Europe
7.4.4.6.1. Market Assessment and Forecast, By Product, 2012-2022 ($Million)
7.4.4.6.2. Market Assessment and Forecast, By Raw Material, 2012-2022 ($Million)
7.4.4.6.3. Market Assessment and Forecast, By Application, 2012-2022 ($Million)
7.5. Asia-Pacific
7.5.1. Market Assessment and Forecast, By Country, 2012-2022 ($Million)
7.5.2. Market Assessment and Forecast, By Product, 2012-2022 ($Million)
7.5.3. Market Assessment and Forecast, By Raw Material, 2012-2022 ($Million)
7.5.4. Market Assessment and Forecast, By Application, 2012-2022 ($Million)
7.5.4.1. Japan
7.5.4.1.1. Market Assessment and Forecast, By Product, 2012-2022 ($Million)
7.5.4.1.2. Market Assessment and Forecast, By Raw Material, 2012-2022 ($Million)
7.5.4.1.3. Market Assessment and Forecast, By Application, 2012-2022 ($Million)
7.5.4.2. China
7.5.4.2.1. Market Assessment and Forecast, By Product, 2012-2022 ($Million)
7.5.4.2.2. Market Assessment and Forecast, By Raw Material, 2012-2022 ($Million)
7.5.4.2.3. Market Assessment and Forecast, By Application, 2012-2022 ($Million)
7.5.4.3. Australia
7.5.4.3.1. Market Assessment and Forecast, By Product, 2012-2022 ($Million)
7.5.4.3.2. Market Assessment and Forecast, By Raw Material, 2012-2022 ($Million)
7.5.4.3.3. Market Assessment and Forecast, By Application, 2012-2022 ($Million)
7.5.4.4. India
7.5.4.4.1. Market Assessment and Forecast, By Product, 2012-2022 ($Million)
7.5.4.4.2. Market Assessment and Forecast, By Raw Material, 2012-2022 ($Million)
7.5.4.4.3. Market Assessment and Forecast, By Application, 2012-2022 ($Million)
7.5.4.5. South Korea
7.5.4.5.1. Market Assessment and Forecast, By Product, 2012-2022 ($Million)
7.5.4.5.2. Market Assessment and Forecast, By Raw Material, 2012-2022 ($Million)
7.5.4.5.3. Market Assessment and Forecast, By Application, 2012-2022 ($Million)
7.5.4.6. Rest of Asia-Pacific
7.5.4.6.1. Market Assessment and Forecast, By Product, 2012-2022 ($Million)
7.5.4.6.2. Market Assessment and Forecast, By Raw Material, 2012-2022 ($Million)
7.5.4.6.3. Market Assessment and Forecast, By Application, 2012-2022 ($Million)
7.6. Rest of the World
7.6.1. Market Assessment and Forecast, By Country, 2012-2022 ($Million)
7.6.2. Market Assessment and Forecast, By Product, 2012-2022 ($Million)
7.6.3. Market Assessment and Forecast, By Raw Material, 2012-2022 ($Million)
7.6.4. Market Assessment and Forecast, By Application, 2012-2022 ($Million)
7.6.4.1. Brazil
7.6.4.1.1. Market Assessment and Forecast, By Product, 2012-2022 ($Million)
7.6.4.1.2. Market Assessment and Forecast, By Raw Material, 2012-2022 ($Million)
7.6.4.1.3. Market Assessment and Forecast, By Application, 2012-2022 ($Million)
7.6.4.2. Turkey
7.6.4.2.1. Market Assessment and Forecast, By Product, 2012-2022 ($Million)
7.6.4.2.2. Market Assessment and Forecast, By Raw Material, 2012-2022 ($Million)
7.6.4.2.3. Market Assessment and Forecast, By Application, 2012-2022 ($Million)
7.6.4.3. Saudi Arabia
7.6.4.3.1. Market Assessment and Forecast, By Product, 2012-2022 ($Million)
7.6.4.3.2. Market Assessment and Forecast, By Raw Material, 2012-2022 ($Million)
7.6.4.3.3. Market Assessment and Forecast, By Application, 2012-2022 ($Million)
7.6.4.4. South Africa
7.6.4.4.1. Market Assessment and Forecast, By Product, 2012-2022 ($Million)
7.6.4.4.2. Market Assessment and Forecast, By Raw Material, 2012-2022 ($Million)
7.6.4.4.3. Market Assessment and Forecast, By Application, 2012-2022 ($Million)
7.6.4.5. United Arab Emirates
7.6.4.5.1. Market Assessment and Forecast, By Product, 2012-2022 ($Million)
7.6.4.5.2. Market Assessment and Forecast, By Raw Material, 2012-2022 ($Million)
7.6.4.5.3. Market Assessment and Forecast, By Application, 2012-2022 ($Million)
7.6.4.6. Others
7.6.4.6.1. Market Assessment and Forecast, By Product, 2012-2022 ($Million)
7.6.4.6.2. Market Assessment and Forecast, By Raw Material, 2012-2022 ($Million)
7.6.4.6.3. Market Assessment and Forecast, By Application, 2012-2022 ($Million)
8. Company Profiles
8.1. Bluestar Adisseo Co., Ltd.
8.1.1. Business Overview
8.1.2. Product Portfolio
8.1.3. Key Financials
8.1.4. Strategic Developments
8.2. Novus International Inc.
8.2.1. Business Overview
8.2.2. Product Portfolio
8.2.3. Strategic Developments
8.3. Cargill Inc.
8.3.1. Business Overview
8.3.2. Product Portfolio
8.3.3. Key Financials
8.3.4. Strategic Developments
8.4. Kemin Industries, Inc.
8.4.1. Business Overview
8.4.2. Product Portfolio
8.4.3. Strategic Developments
8.5. KYOWA HAKKO BIO CO., LTD.
8.5.1. Business Overview
8.5.2. Product Portfolio
8.5.3. Strategic Developments
8.6. Sunrise Nutrachem Group
8.6.1. Business Overview
8.6.2. Product Portfolio
8.6.3. Strategic Developments
8.7. Royal DSM
8.7.1. Business Overview
8.7.2. Product Portfolio
8.7.3. Key Financials
8.7.4. Strategic Developments
8.8. Evonik Industries AG
8.8.1. Business Overview
8.8.2. Product Portfolio
8.8.3. Key Financials
8.8.4. Strategic Developments
8.9. Global Bio-chem Technology Group Company Limited
8.9.1. Business Overview
8.9.2. Product Portfolio
8.9.3. Key Financials
8.9.4. Strategic Developments
8.10. Ajinomoto Co., Inc.
8.10.1. Business Overview
8.10.2. Product Portfolio
8.10.3. Key Financials
8.10.4. Strategic Developments
8.11. AnaSpec, Inc.
8.11.1. Business Overview
8.11.2. Product Portfolio
8.11.3. Strategic Developments
8.12. Archer Daniels Midland Company
8.12.1. Business Overview
8.12.2. Product Portfolio
8.12.3. Key Financials
8.12.4. Strategic Developments
List of Tables
Table 1.Amino Acids Market, By Product ($Million), 2012-2022
Table 2.Tryptophan Market, By Region ($Million), 2012-2022
Table 3.Leucine Market, By Region ($Million), 2012-2022
Table 4.Iso-leucine Market, By Region ($Million), 2012-2022
Table 5.Valine Market, By Region ($Million), 2012-2022
Table 6.Glutamine Market, By Region ($Million), 2012-2022
Table 7.L-Glutamate Market, By Region ($Million), 2012-2022
Table 8.Lysine Market, By Region ($Million), 2012-2022
Table 9.Methionine Market, By Region ($Million), 2012-2022
Table 10.Threonine Market, By Region ($Million), 2012-2022
Table 11.Creatine Market, By Region ($Million), 2012-2022
Table 12.Proline Market, By Region ($Million), 2012-2022
Table 13.Serine Market, By Region ($Million), 2012-2022
Table 14.Arginine Market, By Region ($Million), 2012-2022
Table 15.Glycine Market, By Region ($Million), 2012-2022
Table 16.Phenylalanine Market, By Region ($Million), 2012-2022
Table 17.Tyrosine Market, By Region ($Million), 2012-2022
Table 18.Citrulline Market, By Region ($Million), 2012-2022
Table 19.Other Products Market, By Region ($Million), 2012-2022
Table 20.Amino Acids Market, By Raw Material ($Million), 2012-2022
Table 21.Animal-based Market, By Region ($Million), 2012-2022
Table 22.Plant-based Market, By Region ($Million), 2012-2022
Table 23.Amino Acids Market, By Application ($Million), 2012-2022
Table 23.Food & Dietary Supplements Market, By Region ($Million), 2012-2022
Table 24.Animal feed Market, By Region ($Million), 2012-2022
Table 25.Animal feed by livestock Market, By Region ($Million), 2012-2022
Table 26.Swine Market, By Region ($Million), 2012-2022
Table 27.Poultry Market, By Region ($Million), 2012-2022
Table 28.Cattle Market, By Region ($Million), 2012-2022
Table 29.Other Animal feeds Market, By Region ($Million), 2012-2022
Table 30.Pharmaceuticals Market, By Region ($Million), 2012-2022
Table 31.Amino Acids Market, By Region ($Million), 2012-2022
Table 32.North America Amino Acids Market, By Country, 2012-2022 ($Million)
Table 33.North America Amino Acids Market, By Product, 2012-2022 ($Million)
Table 34.North America Amino Acids Market, By Raw Material, 2012-2022 ($Million)
Table 35.North America Amino Acids Market, By Application, 2012-2022 ($Million)
Table 36.U.S. Amino Acids Market, By Product, 2012-2022 ($Million)
Table 37.U.S. Amino Acids Market, By Raw Material, 2012-2022 ($Million)
Table 38.U.S. Amino Acids Market, By Application, 2012-2022 ($Million)
Table 39.Canada Amino Acids Market, By Product, 2012-2022 ($Million)
Table 40.Canada Amino Acids Market, By Raw Material, 2012-2022 ($Million)
Table 41.Canada Amino Acids Market, By Application, 2012-2022 ($Million)
Table 42.Mexico Amino Acids Market, By Product, 2012-2022 ($Million)
Table 43.Mexico Amino Acids Market, By Raw Material, 2012-2022 ($Million)
Table 44.Mexico Amino Acids Market, By Application, 2012-2022 ($Million)
Table 45.Europe Amino Acids Market, By Country, 2012-2022 ($Million)
Table 46.Europe Amino Acids Market, By Product, 2012-2022 ($Million)
Table 47.Europe Amino Acids Market, By Raw Material, 2012-2022 ($Million)
Table 48.Europe Amino Acids Market, By Application, 2012-2022 ($Million)
Table 49.Germany Amino Acids Market, By Product, 2012-2022 ($Million)
Table 50.Germany Amino Acids Market, By Raw Material, 2012-2022 ($Million)
Table 51.Germany Amino Acids Market, By Application, 2012-2022 ($Million)
Table 52.France Amino Acids Market, By Product, 2012-2022 ($Million)
Table 53.France Amino Acids Market, By Raw Material, 2012-2022 ($Million)
Table 54.France Amino Acids Market, By Application, 2012-2022 ($Million)
Table 55.UK Amino Acids Market, By Product, 2012-2022 ($Million)
Table 56.UK Amino Acids Market, By Raw Material, 2012-2022 ($Million)
Table 57.UK Amino Acids Market, By Application, 2012-2022 ($Million)
Table 58.Italy Amino Acids Market, By Product, 2012-2022 ($Million)
Table 59.Italy Amino Acids Market, By Raw Material, 2012-2022 ($Million)
Table 60.Italy Amino Acids Market, By Application, 2012-2022 ($Million)
Table 61.Spain Amino Acids Market, By Product, 2012-2022 ($Million)
Table 62.Spain Amino Acids Market, By Raw Material, 2012-2022 ($Million)
Table 63.Spain Amino Acids Market, By Application, 2012-2022 ($Million)
Table 67.Rest of Europe Amino Acids Market, By Product, 2012-2022 ($Million)
Table 68.Rest of Europe Amino Acids Market, By Raw Material, 2012-2022 ($Million)
Table 69.Rest of Europe Amino Acids Market, By Application, 2012-2022 ($Million)
Table 70.Asia-Pacific Amino Acids Market, By Country, 2012-2022 ($Million)
Table 71.Asia-Pacific Amino Acids Market, By Product, 2012-2022 ($Million)
Table 72.Asia-Pacific Amino Acids Market, By Raw Material, 2012-2022 ($Million)
Table 73.Asia-Pacific Amino Acids Market, By Application, 2012-2022 ($Million)
Table 74.Japan Amino Acids Market, By Product, 2012-2022 ($Million)
Table 75.Japan Amino Acids Market, By Raw Material, 2012-2022 ($Million)
Table 76.Japan Amino Acids Market, By Application, 2012-2022 ($Million)
Table 77.China Amino Acids Market, By Product, 2012-2022 ($Million)
Table 78.China Amino Acids Market, By Raw Material, 2012-2022 ($Million)
Table 79.China Amino Acids Market, By Application, 2012-2022 ($Million)
Table 80.Australia Amino Acids Market, By Product, 2012-2022 ($Million)
Table 81.Australia Amino Acids Market, By Raw Material, 2012-2022 ($Million)
Table 82.Australia Amino Acids Market, By Application, 2012-2022 ($Million)
Table 83.India Amino Acids Market, By Product, 2012-2022 ($Million)
Table 84.India Amino Acids Market, By Raw Material, 2012-2022 ($Million)
Table 85.India Amino Acids Market, By Application, 2012-2022 ($Million)
Table 86.South Korea Amino Acids Market, By Product, 2012-2022 ($Million)
Table 87.South Korea Amino Acids Market, By Raw Material, 2012-2022 ($Million)
Table 88.South Korea Amino Acids Market, By Application, 2012-2022 ($Million)
Table 92.Rest of Asia-Pacific Amino Acids Market, By Product, 2012-2022 ($Million)
Table 93.Rest of Asia-Pacific Amino Acids Market, By Raw Material, 2012-2022 ($Million)
Table 94.Rest of Asia-Pacific Amino Acids Market, By Application, 2012-2022 ($Million)
Table 95.Rest of the World Amino Acids Market, By Country, 2012-2022 ($Million)
Table 96.Rest of the World Amino Acids Market, By Product, 2012-2022 ($Million)
Table 97.Rest of the World Amino Acids Market, By Raw Material, 2012-2022 ($Million)
Table 98.Rest of the World Amino Acids Market, By Application, 2012-2022 ($Million)
Table 99.Brazil Amino Acids Market, By Product, 2012-2022 ($Million)
Table 100.Brazil Amino Acids Market, By Raw Material, 2012-2022 ($Million)
Table 101.Brazil Amino Acids Market, By Application, 2012-2022 ($Million)
Table 102.Turkey Amino Acids Market, By Product, 2012-2022 ($Million)
Table 103.Turkey Amino Acids Market, By Raw Material, 2012-2022 ($Million)
Table 104.Turkey Amino Acids Market, By Application, 2012-2022 ($Million)
Table 105.Saudi Arabia Amino Acids Market, By Product, 2012-2022 ($Million)
Table 106.Saudi Arabia Amino Acids Market, By Raw Material, 2012-2022 ($Million)
Table 107.Saudi Arabia Amino Acids Market, By Application, 2012-2022 ($Million)
Table 108.South Africa Amino Acids Market, By Product, 2012-2022 ($Million)
Table 109.South Africa Amino Acids Market, By Raw Material, 2012-2022 ($Million)
Table 110.South Africa Amino Acids Market, By Application, 2012-2022 ($Million)
Table 111.United Arab Emirates Amino Acids Market, By Product, 2012-2022 ($Million)
Table 112.United Arab Emirates Amino Acids Market, By Raw Material, 2012-2022 ($Million)
Table 123.United Arab Emirates Amino Acids Market, By Application, 2012-2022 ($Million)
Table 124.Others Amino Acids Market, By Product, 2012-2022 ($Million)
Table 125.Others Amino Acids Market, By Raw Material, 2012-2022 ($Million)
Table 126.Others Amino Acids Market, By Application, 2012-2022 ($Million)
Table 127.Bluestar Adisseo Co., Ltd.: Key Strategic Developments, 2017-2017
Table 128.Novus International Inc.: Key Strategic Developments, 2017-2017
Table 129.Cargill Inc.: Key Strategic Developments, 2017-2017
Table 130.Kemin Industries, Inc.: Key Strategic Developments, 2017-2017
Table 131.KYOWA HAKKO BIO CO.,LTD.: Key Strategic Developments, 2017-2017
Table 132.Sunrise Nutrachem Group: Key Strategic Developments, 2017-2017
Table 133.Royal DSM: Key Strategic Developments, 2017-2017
Table 134.Evonik Industries AG: Key Strategic Developments, 2017-2017
Table 135.Global Bio-chem Technology Group Company Limited: Key Strategic Developments, 2017-2017
Table 136.Ajinomoto Co., Inc.: Key Strategic Developments, 2017-2017
Table 137.AnaSpec, Inc: Key Strategic Developments, 2017-2017
Table 138.Archer Daniels Midland Company: Key Strategic Developments, 2017-2017
List of Figures
Figure 1.Amino Acids Market Share, By Product, 2012 & 2022 ($Million)
Figure 2.Amino Acids Market, By Raw Material, 2012 & 2022 ($Million)
Figure 3.Amino Acids Market, By Application, 2012 & 2022 ($Million)
Figure 4.Amino Acids Market, By Region, 2017, ($Million)
Figure 5.Bluestar Adisseo Co., Ltd.: Net Revenues, 2017-2017 ($Million)
Figure 6.Bluestar Adisseo Co., Ltd.: Net Revenue Share, By Segment, 2017
Figure 7.Bluestar Adisseo Co., Ltd.: Net Revenue Share, By Geography, 2017
Figure 8.Cargill Inc.: Net Revenues, 2017-2017 ($Million)
Figure 9.Cargill Inc.: Net Revenue Share, By Segment, 2017
Figure 10.Cargill Inc.: Net Revenue Share, By Geography, 2017
Figure 11.Royal DSM: Net Revenues, 2017-2017 ($Million)
Figure 12.Royal DSM: Net Revenue Share, By Segment, 2017
Figure 13.Royal DSM: Net Revenue Share, By Geography, 2017
Figure 14.Evonik Industries AG: Net Revenues, 2017-2017 ($Million)
Figure 15.Evonik Industries AG: Net Revenue Share, By Segment, 2017
Figure 16.Evonik Industries AG: Net Revenue Share, By Geography, 2017
Figure 17.Global Bio-chem Technology Group Company Limited, LLC.: Net Revenues, 2017-2017 ($Million)
Figure 18.Global Bio-chem Technology Group Company Limited, LLC.: Net Revenue Share, By Segment, 2017
Figure 19.Global Bio-chem Technology Group Company Limited, LLC.: Net Revenue Share, By Geography, 2017
Figure 20.Ajinomoto Co., Inc.: Net Revenues, 2017-2017 ($Million)
Figure 21.Ajinomoto Co., Inc.: Net Revenue Share, By Segment, 2017
Figure 22.Ajinomoto Co., Inc.: Net Revenue Share, By Geography, 2017
Figure 23.Archer Daniels Midland Company: Net Revenues, 2017-2017 ($Million)
Figure 24.Archer Daniels Midland Company: Net Revenue Share, By Segment, 2017
Figure 25.Archer Daniels Midland Company: Net Revenue Share, By Geography, 2017
Research Methodology
We use both primary as well as secondary research for our market surveys, estimates and for developing forecast. Our research process commence by analyzing the problem which enable us to design the scope for our research study. Our research process is uniquely designed with enough flexibility to adjust according to changing nature of products and markets, while retaining core element to ensure reliability and accuracy in research findings. We understand both macro and micro-economic factors to evaluate and forecast different market segments.
Data Mining
Data is extensively collected through various secondary sources such as annual reports, investor presentations, SEC filings, and other corporate publications. We also refer trade magazines, technical journals, paid databases such as Factiva and Bloomberg, industry trade journals, scientific journals, and social media data to understand market dynamics and industry trends. Further, we also conduct primary research to understand market drivers, restraints, opportunities, challenges, and competitive scenario to build our analysis.
Data Collection Matrix
|
Data Collection Matrix |
Supply Side |
Demand Side |
|
Primary Data Sources |
|
|
|
Secondary Data Sources |
|
|
Market Modeling and Forecasting
We use epidemiology and capital equipment-based models to forecast market size of different segments at country and regional level.
- Epidemiology-based Forecasting Model: This method uses epidemiology data gathered through various publications and from physicians to estimate population of patients, flow of treatment of individual disease and therapies. The data collected through this method includes statics on incidence of disease, population suffering from disease, and treatment population. This method is used to understand:
- Number of patients for particular device or medical procedure and
- Repeated use of particular device depending on health and condition of patient
- Capital-based Forecasting Model: This method of forecasting is based on number of replacements, installed-based and new sales of capital equipment used in various healthcare and diagnostic centers. These three parameters are calculated and forecast is developed. Installation base is calculated as average number of units per facility; while sales for particular year is calculated from number of new and replace units. Secondary data is collected through various supply chain intermediaries and opinion leaders to arrive at installation and sales rate. These techniques help our analysts in validating market and developed market estimates and forecast.
We do forecast on basis of several parameters such as market drivers, market opportunities, industry trends government regulations, raw materials supply and trade dynamics to ensure relevance of forecast with market scenario. With increasing need to granulized information, we used bottom-up methodology for forecasting where we evaluate each regional segment differently and combined all forecast to develop final market forecast.
Data Validation
We believe primary research is a very important tool in analyzing and forecasting different markets. In order to make sure accuracy of our findings, our team conducts primary interviews at every stage of research to gain deep insights into current business environment and future trends and key developments in market. This includes use of various methods such as telephonic interviews, focus groups, face to face interviews and questionnaires to validate our research from all aspects. We validate our data through primary research from key industry leaders such as CEO, product managers, marketing managers, suppliers, distributors, and consumers are frequently interviewed. These interviews provide valuable insights which help us to have better market understanding besides validating our estimates and forecast.
Data Triangulation

Industry Analysis
|
Qualitative Data |
Quantitative Data (2017-2025) |
|
|