.png)
Aerosol Market by Application - Global Industry Analysis and Forecast to 2027
Published On : September 2017 Pages : 125 Category: Advanced Materials Report Code : CM09198
SEGMENTS & REGIONS:
- Regions: North America, Europe, Asia- Pacific, Latin America, Middle East & Africa
Industry trend analysis
The global aerosol market was worth USD billion in the year of 2017 and is anticipated to reach approximately USD billion by 2027, while registering itself at a compound annual growth rate (CAGR) of % during the forecast period. This growth is owing to factors such as increasing amount of implementation in fields such as automotive, household, food and beverages. In addition, swift industrialization taking place in countries that are developing coupled with accelerating awareness of health personal care are factors that boost the growth if the global aerosol market. The demand for aerosol in various products such as chocolate, oil, vinegar, beer, ketchup, mayonnaise, soda and whipped cream has increased significantly. Increasing requirement of aerosol products in the medical industry for products such as inhalers is said to spur the growth of the global aerosol market. Furthermore, rising technological advancements that results in the production of enhanced aerosols is said to supplement the growth of this market. The existence of prosperous manufacturing companies of personal care products in the United States is said to have a substantial impact on the growth of this market. Growing implementation of Montreal protocol in the United States and the growing utilization of the Clean Development Mechanism in manufacturing industries that are domestic are expected to inhibit the demand of the products that give out Volatile Organic Compounds. However, the global aerosol market is anticipated to witness growth because of the increasing implementation of online retails media as it makes the purchase of products extremely convenient. In addition, the discounts and reduction of prices offered by the retailers online is said to have an excellent impact on the global aerosol market.
Application Outlook and Trend Analysis
In the application of personal care the demand for aerosol held the share of more than 36 percent of the global utilization in the year of owing to substantial growth in the requirement of deodorants due to changes in the lifestyle of the consumers, majorly in Asia Pacific. Additionally, increasing willingness of the consumers to spend on products that are useful for personal hygiene is anticipated to spur the growth of the market. Aerosols that are useful in household are expected to supplement the growth of this market due to increasing requirement of insect sprays and other household cleaning materials. Rising application of products such as water repellents for leather products, shoe polish, starch, pre-wash sprays and stain removers are anticipated to boost the growth of the global aerosol market. Moreover, increasing application of products like lubricants, industrial cleaners, adhesives and sealants are influencing the growth of this market. Additionally, supportive policies that are focused on the promotion of investments in the field of automotive and construction is said to boost the demand for aerosol in the coming years.
Regional Outlook and Trend Analysis
The aerosol market in Europe accounted a share of more than 32 percent of the demand volume in the year of 2017 due to increasing utilization of personal care products, especially in Spain, Italy, Germany, United Kingdom and France. However, strict rules on limiting the discharge of Volatile Organic Compounds are anticipated to inhibit the growth of this market. Growing requirement of personal care product majorly in the male population in United Kingdom is said to boost the demand of dry shampoos, conditioners and hair sprays. Additionally, major demand of grooming products for male owing to lifestyle changes in the United Kingdom is said to have a considerable impact on the growth of the global aerosol market. The aerosol market in Central and South America is said to witness significant growth due to increasing utilization of aerosol based products majorly in Argentina and Brazil. Furthermore, growing fondness of consumers towards using enhanced consumer products is another major factor to influence the growth of the global aerosol market.
Competitive Insights
The global aerosol market is extensively competitive with leading companies that focus on the innovation of the product and increase the investment in research and development. The major manufacturers are Thymes LLC, Crabtree & Evelyn, S.C. Johnson, Unilever, Proctor and Gamble Co., Henkel AG & Co. and Reckitt Benckiser (RB). In the year of 2017, Honeywell declared the advent of enhanced propellant mixture that were marketed under the name of Solstice Propellant, with the aim of increasing the interest of the consumers in order to provide an alternative for the tradition propellants. The advent of improved compressed deodorants was declared by Unilever for the personal care brands that include Dove, Axe, Sure in Asia and Europe.
Aerosol market is segmented as follows-
By Application
- Foods and beverages
- Medical
- Household
- Paints and Varnishes
- Automotive and Industrial
- Personal care
- Insecticide
- Other Applications
By Region
- North America
- U.S
- Canada
- Mexico
- Europe
- Germany
- France
- UK
- Italy
- Spain
- Rest of Europe
- Asia-Pacific
- Japan
- China
- Australia
- India
- South Korea
- Rest of Asia Pacific
- Rest of the World
- Brazil
- South Africa
- Saudi Arabia
- United Arab Emirates
- Others
Some of the key questions answered by the report are:
- What was the market size in 2017 and forecast from 2022 to 2027?
- What will be the industry market growth from 2022 to 2027?
- What are the major drivers, restraints, opportunities, challenges, and industry trends and their impact on the market forecast?
- What are the major segments leading the market growth and why?
- Which are the leading players in the market and what are the major strategies adopted by them to sustain the market competition?
Market Classification
- Aerosol Market, By Application, Estimates and Forecast, 2017-2027 ($Million)
- Foods and beverages
- Medical
- Household
- Paints and Varnishes
- Automotive and Industrial
- Personal care
- Insecticide
- Other Applications
- Aerosol Market, By Region, Estimates and Forecast, 2017-2027 ($Million)
- North America
- North America Aerosol Market, By Country
- North America Aerosol Market, By Application
- U.S. Aerosol Market, By Application
- Canada Aerosol Market, By Application
- Mexico Aerosol Market, By Application
- North America
-
- Europe
- Europe Aerosol Market, By Country
- Europe Aerosol Market, By Application
- Germany Aerosol Market, By Application
- France Aerosol Market, By Application
- UK Aerosol Market, By Application
- Italy Aerosol Market, By Application
- Spain Aerosol Market, By Application
- Rest of Europe Aerosol Market, By Application
- Europe
-
- Asia-Pacific
- Asia-Pacific Aerosol Market, By Country
- Asia-Pacific Aerosol Market, By Application
- Japan Aerosol Market, By Application
- Australia Aerosol Market, By Application
- India Aerosol Market, By Application
- South Korea Aerosol Market, By Application
- Rest of Asia-Pacific Aerosol Market, By Application
- Asia-Pacific
-
- Rest of the World
- Rest of the World Aerosol Market, By Country
- Rest of the World Aerosol Market, By Application
- Brazil Aerosol Market, By Application
- South Africa Aerosol Market, By Application
- Saudi Arabia Aerosol Market, By Application
- Turkey Aerosol Market, By Application
- United Arab Emirates Aerosol Market, By Application
- Others Aerosol Market, By Application
- Rest of the World
Table of Contents
1.Introduction
1.1.Report Description
1.2.Research Methodology
1.2.1. Secondary Research
1.2.2. Primary Research
2.Executive Summary
2.1.Key Highlights
3.Market Overview
3.1.Introduction
3.1.1. Market Definition
3.1.2. Market Segmentation
3.2.Market Share Analysis
3.3.Market Dynamics
3.3.1. Drivers
3.3.1.1.Product innovation/new product development
3.3.1.2.Increase in the Demand of Personal Care Products
3.3.1.3.Rapid urbanization along with infrastructural development
3.3.2. Restraints
3.3.2.1.Stringent regulatory scenario
3.3.3. Opportunities
3.3.3.1.Development of Advanced product innovation according to public needs
3.4.Industry Trends
4.Aerosol Market, By Application
4.1.Introduction
4.2.Aerosol Market Assessment and Forecast, By Application, 2017-2027
4.3.Foods and beverages
4.3.1. Market Assessment and Forecast, By Region, 2017-2027 ($Million)
4.4.Medical
4.4.1. Market Assessment and Forecast, By Region, 2017-2027 ($Million)
4.5.Household
4.5.1. Market Assessment and Forecast, By Region, 2017-2027 ($Million)
4.6.Paints and Varnishes
4.6.1. Market Assessment and Forecast, By Region, 2017-2027 ($Million)
4.7.Automotive and Industrial
4.7.1. Market Assessment and Forecast, By Region, 2017-2027 ($Million)
4.8.Personal care
4.8.1. Market Assessment and Forecast, By Region, 2017-2027 ($Million)
4.9.Insecticide
4.9.1. Market Assessment and Forecast, By Region, 2017-2027 ($Million)
4.10.Others
4.10.1.Market Assessment and Forecast, By Region, 2017-2027 ($Million)
5.Aerosol Market, By Region
5.1.Introduction
5.2.Aerosol Market Assessment and Forecast, By Region, 2017-2027 ($Million)
5.3.North America
5.3.1. Market Assessment and Forecast, By Country, 2017-2027 ($Million)
5.3.2. Market Assessment and Forecast, By Application, 2017-2027 ($Million)
5.3.2.1.U.S.
5.3.2.1.1.Market Assessment and Forecast, By Application, 2017-2027 ($Million)
5.3.2.2.Canada
5.3.2.2.1.Market Assessment and Forecast, By Application, 2017-2027 ($Million)
5.3.2.3.Mexico
5.3.2.3.1.Market Assessment and Forecast, By Application, 2017-2027 ($Million)
5.4.Europe
5.4.1. Market Assessment and Forecast, By Country, 2017-2027 ($Million)
5.4.2. Market Assessment and Forecast, By Application, 2017-2027 ($Million)
5.4.2.1.Germany
5.4.2.1.1.Market Assessment and Forecast, By Application, 2017-2027 ($Million)
5.4.2.2.France
5.4.2.2.1.Market Assessment and Forecast, By Application, 2017-2027 ($Million)
5.4.2.3.UK
5.4.2.3.1.Market Assessment and Forecast, By Application, 2017-2027 ($Million)
5.4.2.4.Italy
5.4.2.4.1.Market Assessment and Forecast, By Application, 2017-2027 ($Million)
5.4.2.5.Spain
5.4.2.5.1.Market Assessment and Forecast, By Application, 2017-2027 ($Million)
5.4.2.6.Russia
5.4.2.6.1.Market Assessment and Forecast, By Application, 2017-2027 ($Million)
5.4.2.7.Rest of Europe
5.4.2.7.1.Market Assessment and Forecast, By Application, 2017-2027 ($Million)
5.5.Asia-Pacific
5.5.1. Market Assessment and Forecast, By Country, 2017-2027 ($Million)
5.5.2. Market Assessment and Forecast, By Application, 2017-2027 ($Million)
5.5.2.1.Japan
5.5.2.1.1.Market Assessment and Forecast, By Application, 2017-2027 ($Million)
5.5.2.2.China
5.5.2.2.1.Market Assessment and Forecast, By Application, 2017-2027 ($Million)
5.5.2.3.Australia
5.5.2.3.1.Market Assessment and Forecast, By Application, 2017-2027 ($Million)
5.5.2.4.India
5.5.2.4.1.Market Assessment and Forecast, By Application, 2017-2027 ($Million)
5.5.2.5.South Korea
5.5.2.5.1.Market Assessment and Forecast, By Application, 2017-2027 ($Million)
5.5.2.6.Taiwan
5.5.2.6.1.Market Assessment and Forecast, By Application, 2017-2027 ($Million)
5.5.2.7.Rest of Asia-Pacific
5.5.2.7.1.Market Assessment and Forecast, By Application, 2017-2027 ($Million)
5.6.Rest of the World
5.6.1. Market Assessment and Forecast, By Country, 2017-2027 ($Million)
5.6.2. Market Assessment and Forecast, By Application, 2017-2027 ($Million)
5.6.2.1.Brazil
5.6.2.1.1.Market Assessment and Forecast, By Application, 2017-2027 ($Million)
5.6.2.2.Turkey
5.6.2.2.1.Market Assessment and Forecast, By Application, 2017-2027 ($Million)
5.6.2.3.Saudi Arabia
5.6.2.3.1.Market Assessment and Forecast, By Application, 2017-2027 ($Million)
5.6.2.4.South Africa
5.6.2.4.1.Market Assessment and Forecast, By Application, 2017-2027 ($Million)
5.6.2.5.United Arab Emirates
5.6.2.5.1.Market Assessment and Forecast, By Application, 2017-2027 ($Million)
5.6.2.6.Others
5.6.2.6.1.Market Assessment and Forecast, By Application, 2017-2027 ($Million)
6.Company Profiles
6.1.Proctor and Gamble
6.1.1. Business Overview
6.1.2. Product Portfolio
6.1.3. Key Financials
6.1.4. Strategic Developments
6.2.S.C. Johnson & Son Inc.
6.2.1. Business Overview
6.2.2. Product Portfolio
6.2.3. Key Financials
6.2.4. Strategic Developments
6.3.Reckitt Benckiser Group plc.
6.3.1. Business Overview
6.3.2. Product Portfolio
6.3.3. Key Financials
6.3.4. Strategic Developments
6.4.Thymes, LLC
6.4.1. Business Overview
6.4.2. Product Portfolio
6.4.3. Strategic Developments
6.5.Crabtree & Evelyn
6.5.1. Business Overview
6.5.2. Product Portfolio
6.5.3. Key Financials
6.5.4. Strategic Developments
6.6.Henkel AG & Co.
6.6.1. Business Overview
6.6.2. Product Portfolio
6.6.3. Key Financials
6.6.4. Strategic Developments
6.7.Unilever
6.7.1. Business Overview
6.7.2. Product Portfolio
6.7.3. Key Financials
6.7.4. Strategic Developments
6.8.Honeywell International Inc.
6.8.1. Business Overview
6.8.2. Product Portfolio
6.8.3. Key Financials
6.8.4. Strategic Developments
6.9.Arkema Group
6.9.1. Business Overview
6.9.2. Product Portfolio
6.9.3. Key Financials
6.9.4. Strategic Developments
6.10.Royal Dutch Shell PLC
6.10.1.Business Overview
6.10.2.Product Portfolio
6.10.3.Key Financials
6.10.4.Strategic Developments
6.11.The Chemours Company
6.11.1.Business Overview
6.11.2.Product Portfolio
6.11.3.Key Financials
6.11.4.Strategic Developments
6.12.Aveflor A.S.
6.12.1.Business Overview
6.12.2.Product Portfolio
6.12.3.Strategic Developments
6.13.Akzo Nobel N.V.
6.13.1.Business Overview
6.13.2.Product Portfolio
6.13.3.Key Financials
6.13.4.Strategic Developments
List of Tables
Table 1.Aerosol Market, By Application ($Million), 2017-2025
Table 2.Foods and beverages Market, By Region ($Million), 2017-2025
Table 3.Medical Market, By Region ($Million), 2017-2025
Table 4.Household Market, By Region ($Million), 2017-2025
Table 5.Paints and Varnishes Market, By Region ($Million), 2017-2025
Table 6.Automotive and Industrial Market, By Region ($Million), 2017-2025
Table 7.Personal care Market, By Region ($Million), 2017-2025
Table 8.Insecticide Market, By Region ($Million), 2017-2025
Table 9.Others Market, By Region ($Million), 2017-2025
Table 10.Aerosol Market, By Region ($Million), 2017-2025
Table 11.North America Aerosol Market, By Country, 2017-2025 ($Million)
Table 12.North America Aerosol Market, By Application, 2017-2025 ($Million)
Table 13.U.S. Aerosol Market, By Application, 2017-2025 ($Million)
Table 14.Canada Aerosol Market, By Application, 2017-2025 ($Million)
Table 15.Mexico Aerosol Market, By Application, 2017-2025 ($Million)
Table 16.Europe Aerosol Market, By Country, 2017-2025 ($Million)
Table 17.Europe Aerosol Market, By Application, 2017-2025 ($Million)
Table 18.Germany Aerosol Market, By Application, 2017-2025 ($Million)
Table 19.France Aerosol Market, By Application, 2017-2025 ($Million)
Table 20.UK Aerosol Market, By Application, 2017-2025 ($Million)
Table 21.Italy Aerosol Market, By Application, 2017-2025 ($Million)
Table 22.Spain Aerosol Market, By Application, 2017-2025 ($Million)
Table 23.Russia Aerosol Market, By Application, 2017-2025 ($Million)
Table 24.Rest of Europe Aerosol Market, By Application, 2017-2025 ($Million)
Table 25.Asia-Pacific Aerosol Market, By Country, 2017-2025 ($Million)
Table 26.Asia-Pacific Aerosol Market, By Application, 2017-2025 ($Million)
Table 27.Japan Aerosol Market, By Application, 2017-2025 ($Million)
Table 28.China Aerosol Market, By Application, 2017-2025 ($Million)
Table 29.Australia Aerosol Market, By Application, 2017-2025 ($Million)
Table 30.India Aerosol Market, By Application, 2017-2025 ($Million)
Table 31.South Korea Aerosol Market, By Application, 2017-2025 ($Million)
Table 32.Taiwan Aerosol Market, By Application, 2017-2025 ($Million)
Table 33.Rest of Asia-Pacific Aerosol Market, By Application, 2017-2025 ($Million)
Table 34.Rest of the World Aerosol Market, By Country, 2017-2025 ($Million)
Table 35.Rest of the World Aerosol Market, By Application, 2017-2025 ($Million)
Table 36.Brazil Aerosol Market, By Application, 2017-2025 ($Million)
Table 37.Turkey Aerosol Market, By Application, 2017-2025 ($Million)
Table 38.Saudi Arabia Aerosol Market, By Application, 2017-2025 ($Million)
Table 39.South Africa Aerosol Market, By Application, 2017-2025 ($Million)
Table 40.United Arab Emirates Aerosol Market, By Application, 2017-2025 ($Million)
Table 41.Others Aerosol Market, By Application, 2017-2025 ($Million)
Table 42.Proctor and Gamble: Key Strategic Developments, 2017-2017
Table 43.S.C. Johnson & Son Inc.: Key Strategic Developments, 2017-2017
Table 44.Reckitt Benckiser Group plc.: Key Strategic Developments, 2017-2017
Table 45.Thymes, LLC: Key Strategic Developments, 2017-2017
Table 46.Crabtree & Evelyn: Key Strategic Developments, 2017-2017
Table 47.Henkel AG & Co.: Key Strategic Developments, 2017-2017
Table 48.Unilever: Key Strategic Developments, 2017-2017
Table 49.Honeywell International Inc.: Key Strategic Developments, 2017-2017
Table 50.Arkema Group: Key Strategic Developments, 2017-2017
Table 51.Royal Dutch Shell PLC: Key Strategic Developments, 2017-2017
Table 52.The Chemours Company: Key Strategic Developments, 2017-2017
Table 53.Aveflor A.S.: Key Strategic Developments, 2017-2017
Table 54.Akzo Nobel N.V.: Key Strategic Developments, 2017-2017
List of Figures
Figure 1.Aerosol Market, By Application, 2017 & 2025 ($Million)
Figure 2.Aerosol Market, By Region, 2017, ($Million)
Figure 3.Proctor and Gamble: Net Revenues, 2017-2017 ($Million)
Figure 4.Proctor and Gamble: Net Revenue Share, By Segment, 2017
Figure 5.Proctor and Gamble: Net Revenue Share, By Geography, 2017
Figure 6.S.C. Johnson & Son Inc.: Net Revenues, 2017-2017 ($Million)
Figure 7.S.C. Johnson & Son Inc.: Net Revenue Share, By Segment, 2017
Figure 8.S.C. Johnson & Son Inc.: Net Revenue Share, By Geography, 2017
Figure 9.Reckitt Benckiser Group plc.: Net Revenues, 2017-2017 ($Million)
Figure 10.Reckitt Benckiser Group plc.: Net Revenue Share, By Segment, 2017
Figure 11.Reckitt Benckiser Group plc.: Net Revenue Share, By Geography, 2017
Figure 12.Crabtree & Evelyn: Net Revenues, 2017-2017 ($Million)
Figure 13.Crabtree & Evelyn: Net Revenue Share, By Segment, 2017
Figure 15.Crabtree & Evelyn: Net Revenue Share, By Geography, 2017
Figure 16.Henkel AG & Co.: Net Revenues, 2017-2017 ($Million)
Figure 17.Henkel AG & Co.: Net Revenue Share, By Segment, 2017
Figure 18.Henkel AG & Co.: Net Revenue Share, By Geography, 2017
Figure 19.Unilever: Net Revenues, 2017-2017 ($Million)
Figure 20.Unilever: Net Revenue Share, By Segment, 2017
Figure 21.Unilever: Net Revenue Share, By Geography, 2017
Figure 22.Honeywell International Inc.: Net Revenues, 2017-2017 ($Million)
Figure 23.Honeywell International Inc.: Net Revenue Share, By Segment, 2017
Figure 24.Honeywell International Inc.: Net Revenue Share, By Geography, 2017
Figure 25.Arkema Group: Net Revenues, 2017-2017 ($Million)
Figure 26.Arkema Group: Net Revenue Share, By Segment, 2017
Figure 27.Arkema Group: Net Revenue Share, By Geography, 2017
Figure 28.Royal Dutch Shell PLC: Net Revenues, 2017-2017 ($Million)
Figure 29.Royal Dutch Shell PLC: Net Revenue Share, By Segment, 2017
Figure 30.Royal Dutch Shell PLC: Net Revenue Share, By Geography, 2017
Figure 31.The Chemours Company: Net Revenues, 2017-2017 ($Million)
Figure 32.The Chemours Company: Net Revenue Share, By Segment, 2017
Figure 33.The Chemours Company: Net Revenue Share, By Geography, 2017
Figure 34.Aveflor A.S.: Net Revenues, 2017-2017 ($Million)
Figure 35.Aveflor A.S.: Net Revenue Share, By Segment, 2017
Figure 36.Aveflor A.S.: Net Revenue Share, By Geography, 2017
Figure 37.Akzo Nobel N.V.: Net Revenues, 2017-2017 ($Million)
Figure 38.Akzo Nobel N.V.: Net Revenue Share, By Segment, 2017
Figure 39.Akzo Nobel N.V.: Net Revenue Share, By Geography, 2017
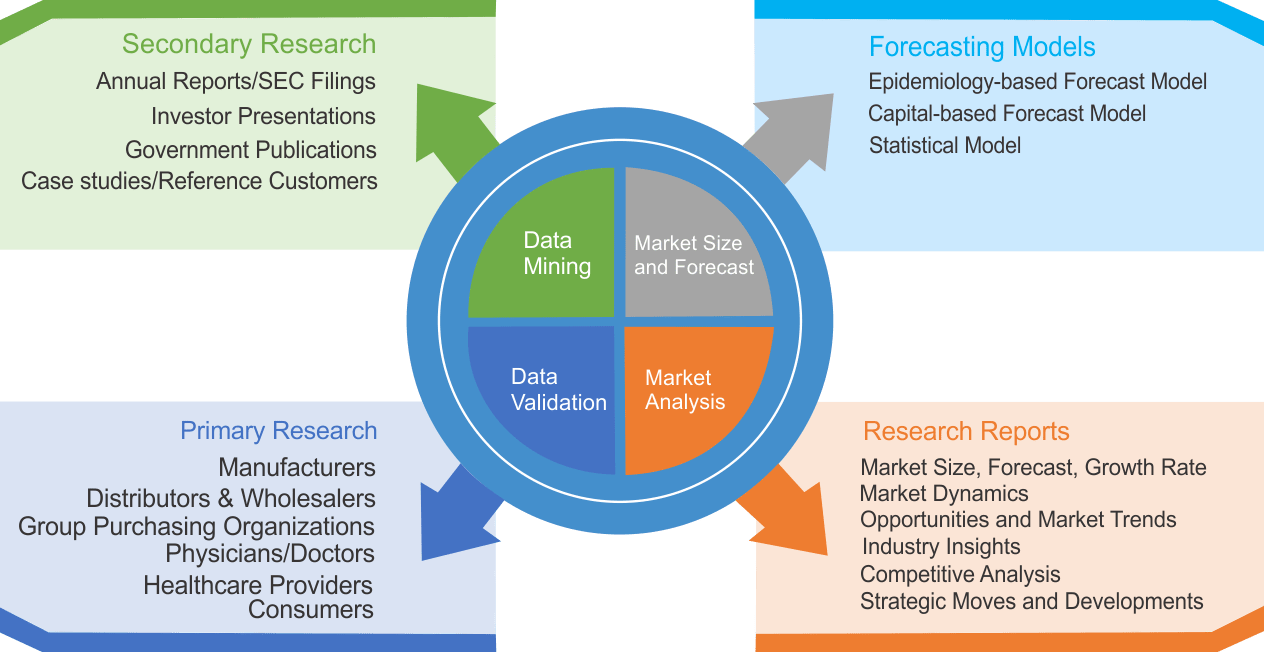
Research Methodology
We use both primary as well as secondary research for our market surveys, estimates and for developing forecast. Our research process commence by analyzing the problem which enable us to design the scope for our research study. Our research process is uniquely designed with enough flexibility to adjust according to changing nature of products and markets, while retaining core element to ensure reliability and accuracy in research findings. We understand both macro and micro-economic factors to evaluate and forecast different market segments.
Data Mining
Data is extensively collected through various secondary sources such as annual reports, investor presentations, SEC filings, and other corporate publications. We also refer trade magazines, technical journals, paid databases such as Factiva and Bloomberg, industry trade journals, scientific journals, and social media data to understand market dynamics and industry trends. Further, we also conduct primary research to understand market drivers, restraints, opportunities, challenges, and competitive scenario to build our analysis.
Data Collection Matrix
|
Data Collection Matrix |
Supply Side |
Demand Side |
|
Primary Data Sources |
|
|
|
Secondary Data Sources |
|
|
Market Modeling and Forecasting
We use epidemiology and capital equipment-based models to forecast market size of different segments at country and regional level.
- Epidemiology-based Forecasting Model: This method uses epidemiology data gathered through various publications and from physicians to estimate population of patients, flow of treatment of individual disease and therapies. The data collected through this method includes statics on incidence of disease, population suffering from disease, and treatment population. This method is used to understand:
- Number of patients for particular device or medical procedure and
- Repeated use of particular device depending on health and condition of patient
- Capital-based Forecasting Model: This method of forecasting is based on number of replacements, installed-based and new sales of capital equipment used in various healthcare and diagnostic centers. These three parameters are calculated and forecast is developed. Installation base is calculated as average number of units per facility; while sales for particular year is calculated from number of new and replace units. Secondary data is collected through various supply chain intermediaries and opinion leaders to arrive at installation and sales rate. These techniques help our analysts in validating market and developed market estimates and forecast.
We do forecast on basis of several parameters such as market drivers, market opportunities, industry trends government regulations, raw materials supply and trade dynamics to ensure relevance of forecast with market scenario. With increasing need to granulized information, we used bottom-up methodology for forecasting where we evaluate each regional segment differently and combined all forecast to develop final market forecast.
Data Validation
We believe primary research is a very important tool in analyzing and forecasting different markets. In order to make sure accuracy of our findings, our team conducts primary interviews at every stage of research to gain deep insights into current business environment and future trends and key developments in market. This includes use of various methods such as telephonic interviews, focus groups, face to face interviews and questionnaires to validate our research from all aspects. We validate our data through primary research from key industry leaders such as CEO, product managers, marketing managers, suppliers, distributors, and consumers are frequently interviewed. These interviews provide valuable insights which help us to have better market understanding besides validating our estimates and forecast.
Data Triangulation
Industry Analysis
|
Qualitative Data |
Quantitative Data (2017-2025) |
|
|