.png)
Adhesives And Sealants Market By Product, Technology, And Application - Global Industry Analysis And Forecast To 2027
Published On : August 2017 Pages : 225 Category: Advanced Materials Report Code : CM08186
SEGMENTS & REGIONS:
- Regions: North America, Europe, Asia- Pacific, Latin America, Middle East & Africa
Industry Trend Analysis
Adhesives and sealants market is anticipated to garner $70 Billion by 2027, while registering itself at a substantial Compound Annual Growth Rate (CAGR) during the forecast period. One of the major market driving factor is steady growth in the end-user industry like automotive, construction, and packaging. Due to the ecological threats pertaining to synthetic form of adhesives and sealants, the global industry of this market is aiming on developing bio-based products.Additionally, primary advantage of used bio-based products is that they reduce the amount of carbon footprints and therefore resulting as a huge competitive advantage over their synthetic vis-à-vis.Bio-based products comprise of vegetable-based polyamides, soybean-derived polyols, epoxies and polyisoprenes. Research says that adhesives and sealants market and its respective applications have witnessed a substantial growth in the past few years, for instance, in 2017, it was accountable for 9.39 million tons and 1.84 million tons respectively. Widespread application of these products coupled with development in technology will lucratively effect the growth of this industry. With bulk demand experience from BRICS economies, automobiles and construction industries are huge consumers of adhesives and sealants. Study suggests that the amount of money spent on construction in Asia Pacific regions of India and China was nearly $425 billion and $1.6 trillion respectively.Sealants are used in fire protection applications and facades, while adhesives are applied in partition, panels and insulation. Resilient trend towards its growth in terms of wealth spent on infrastructure owing to escalated population and rapid industrialization, ought to support the growth of this market industry. Adhesives and sealants are used in panel laminating application in the vehicle industry. Lucrative stance in the direction of growth in vehicle sales having robust application of regulations to decrease automotive weight, must propel adhesives and sealants market size.
Technology Outlook and Trend Analysis
The water-based adhesives and sealants segment has been dominating the overall market and is said to do so further during the forecast period. Ascending ecological problems owing to exposure to oncogenic fillings at the time of manufacturing process will promote the waterborne technology since it expels less VoC emissions and reduces the cost of functioning. Hot melt adhesives market will forecast profits more than XX% by 2027. It forbids emissions of VoC and shows exclusive adhesion properties in comparison with solvent-based technology. Reactive technology is primarily used in electrical industries and its use in ratio is much less than the others. Nevertheless, the products which are based out of reactive technology have better heat resistance and comprise of amazing bond-strength.
Product Outlook and Trend Analysis
Acrylic adhesives and sealants segment is expected to witness highest market growth followed by PVA adhesives. In 2017, this segment was accountable for over % of the overall demand. Along with great bonding properties, this product has rapid setting time. These materials are mainly used in the producing waterborne curing technology and UV light.
In 2017, PVA adhesives market was worth more than 2.5 million tons. This product is made by polymerization of vinyl acetate monomer. PVA adhesives are used for absorbent materials which include wood, paper, cloth and also as consolidator for permeable building stone. Also, silicone sealants market segments was worth more than $2 billion in 2017. Constantly increasing industrialization in BRICS countries will drive this market segment further. Silicone sealants’ primary characteristics include corrosion and chemical resistance and has water repelling properties.
Polyurethane (PU) sealants market size will probably experience more than $XX by 2027 and will grow at an average rate. Market size of EVA adhesives will hold a considerable portion of the overall share and is expected to consume substantial size by 2027. Lastly, epoxy adhesives market size will mature significantly during the forecast period.
Regional Outlook and Trend Analysis
In 2017, Asia Pacific garnered over % of the total adhesives and sealants market share. China adhesives market was more than $5 billion. This region’s market is said to lucratively grow owing to favorable regulations boosting the overall growth coupled with FDI strategies to propel the end user industries. Rising end-user industries such as automobile, packaging and construction is anticipated to encourage the growth in Asia Pacific region.
In the entire US adhesives market, North America dominated the overall market and will continue to do so during the forecast period till 2027, owing to increase in investment in construction coupled with rise is automobile sales in this region. There is more need for waterborne adhesives along with increasing demand for furniture, footwear, and applications pertaining to pressure sensitiveness. With enhancements in technology and having more number of manufacturers in this region, the market is expected to flourish more rapidly during the forecast period.
Europe market for sealants is said to have the highest demand and fetch more regional revenue during the forecast period, owing to existence of major automotive industries in France and Germany.
Competitive Insights
In the recent past, integration through mergers and acquisitions in all levels of value chain had had a huge impact on the adhesives and sealants market on the global level. Some of the major market manufacturers of this market are HB Fuller, Illinois Tool Works Inc., Dow Chemical Co., Eastman Chemical, Sika AG, 3MCompany , Ashland, Henkel AG & Company, N.D. Industries, RPM International Inc., BASF, Acucote, Uniseal, Creative Materials, Bayer, Franklin International, Avery Dennison and Bostik Ltd. Out of these 3M Company, Dow Chemical Co., and H.B. Fuller attributed for more than % of the overall market. Latest merger of Novameltgmbh, a German company and Henkel, has reinstated Henkel’s place as one of the leading market players of this industry. Companies like Avery Dennison and BASF have constituted their existence by implementing methods so as to withstand and develop bio-based products.
Adhesives and Sealants Market is Segmented as follows –
Adhesives by Technology
- Water-Based
- Vinyl Acetate Copolymer
- Acryl Emulsion
- Vinyl Acetate
- Others
- Solvent-Based
- Resins
- Vinyl Acetate
- Rubber
- Others
- Hot Melt
- Rubber
- Ethylene Vinyl Acetate (EVA)
- Others
- Reactive
Adhesives by Product
- Styrenic Block
- Acrylic
- Polyurethane
- PVA
- EVA
- Epoxy
- Others
Adhesives by Application
- Furniture
- Footwear
- Packaging
- Construction
- Pressure Sensitive Applications
- Automotive
- Others
Adhesives by Region
- North America
- U.S
- Canada
- Mexico
- Europe
- Germany
- France
- UK
- Italy
- Russia
- Rest of Europe
- Asia-Pacific
- Japan
- India
- China
- South Korea
- Taiwan
- Thailand
- Rest of Asia-Pacific
- Rest of the World
- Brazil
- South Africa
- Saudi Arabia
- Turkey
- United Arab Emirates
- Others
Sealants by Product
- Acrylic
- Silicones
- PVA
- Polyurethane
- Butyl
- Others (including polysulphide, EVA etc.)
Sealants by Application
- Packaging
- Construction
- Pressure Sensitive Tapes
- Automotive
- Consumer
- Assembly
- Others (aerospace, electronics, etc.)
Sealants by Region
- North America
- Mexico
- U.S.
- Canada
- Europe
- France
- Germany
- UK
- Italy
- Rest of Europe
- Asia Pacific
- China
- India
- Japan
- South Korea
- Taiwan
- Thailand
- Rest of Asia Pacific
- Rest of the World
- Brazil
- South Africa
- Saudi Arabia
- Turkey
- United Arab Emirates
- Others
Some of the key questions answered by the report are:
- What was the market size in 2017 and forecast from 2022 to 2027?
- What will be the industry market growth from 2022 to 2027?
- What are the major drivers, restraints, opportunities, challenges, and industry trends and their impact on the market forecast?
- What are the major segments leading the market growth and why?
- Which are the leading players in the market and what are the major strategies adopted by them to sustain the market competition?
Market Classification
- Adhesives Market By Product, Estimates and Forecast, 2017-2027
- Acrylic
- Polyvinyl Acetate (PVA)
- Polyurethane
- Styrenic Block
- Epoxy
- Ethylene Vinyl Acetate (EVA)
- Adhesives Market By Application, Estimates and Forecast, 2017-2027
- Pressure Sensitive Applications
- Packaging
- Construction
- Furniture
- Automotive
- Adhesives Market By Technology, Estimates and Forecast, 2017-2027
- Water-Based
- Solvent-Based
- Hot Melt
- Reactive
- Adhesives Market By Region, Estimates and Forecast, 2017-2027
- North America
- North America Adhesives Market, By Country
- North America Adhesives Market, By Product
- North America Adhesives Market, By Application
- North America Adhesives Market, By Technology
- U.S. Adhesives Market, By Product
- U.S. Adhesives Market, By Application
- U.S. Adhesives Market, By Technology
- Canada Adhesives Market, By Product
- Canada Adhesives Market, By Application
- Canada Adhesives Market, By Technology
- Mexico Adhesives Market, By Product
- Mexico Adhesives Market, By Application
- Mexico Adhesives Market, By Technology
-
- Europe
- Europe Adhesives Market, By Country
- Europe Adhesives Market, By Product
- Europe Adhesives Market, By Application
- Europe Adhesives Market, By Technology
- Germany Adhesives Market, By Product
- Germany Adhesives Market, By Application
- Germany Adhesives Market, By Technology
- France Adhesives Market, By Product
- France Adhesives Market, By Application
- France Adhesives Market, By Technology
- UK Adhesives Market, By Product
- UK Adhesives Market, By Application
- UK Adhesives Market, By Technology
- Italy Adhesives Market, By Product
- Italy Adhesives Market, By Application
- Italy Adhesives Market, By Technology
- Russia Adhesives Market, By Product
- Russia Adhesives Market, By Application
- Russia Adhesives Market, By Technology
- Rest of Europe Adhesives Market, By Product
- Rest of Europe Adhesives Market, By Application
- Rest of Europe Adhesives Market, By Technology
-
- Asia-Pacific
- Asia-Pacific Adhesives Market, By Country
- Asia-Pacific Adhesives Market, By Product
- Asia-Pacific Adhesives Market, By Application
- Asia-Pacific Adhesives Market, By Technology
- Japan Adhesives Market, By Product
- Japan Adhesives Market, By Application
- Japan Adhesives Market, By Technology
- India Adhesives Market, By Product
- India Adhesives Market, By Application
- India Adhesives Market, By Technology
- China Adhesives Market, By Product
- China Adhesives Market, By Application
- China Adhesives Market, By Technology
- South Korea Adhesives Market, By Product
- South Korea Adhesives Market, By Application
- South Korea Adhesives Market, By Technology
- Taiwan Adhesives Market, By Product
- Taiwan Adhesives Market, By Application
- Taiwan Adhesives Market, By Technology
- Thailand Adhesives Market, By Product
- Thailand Adhesives Market, By Application
- Thailand Adhesives Market, By Technology
- Rest of Asia-Pacific Adhesives Market, By Product
- Rest of Asia-Pacific Adhesives Market, By Application
- Rest of Asia-Pacific Adhesives Market, By Technology
- Asia-Pacific
-
- Rest of the World
- Rest of the World Adhesives Market, By Country
- Rest of the World Adhesives Market, By Product
- Rest of the World Adhesives Market, By Application
- Rest of the World Adhesives Market, By Technology
- Brazil Adhesives Market, By Product
- Brazil Adhesives Market, By Application
- Brazil Adhesives Market, By Technology
- South Africa Adhesives Market, By Product
- South Africa Adhesives Market, By Application
- South Africa Adhesives Market, By Technology
- Saudi Arabia Adhesives Market, By Product
- Saudi Arabia Adhesives Market, By Application
- Saudi Arabia Adhesives Market, By Technology
- Turkey Adhesives Market, By Product
- Turkey Adhesives Market, By Application
- Turkey Adhesives Market, By Technology
- United Arab Emirates Adhesives Market, By Product
- United Arab Emirates Adhesives Market, By Application
- United Arab Emirates Adhesives Market, By Technology
- Others Adhesives Market, By Product
- Others Adhesives Market, By Application
- Others Adhesives Market, By Technology
- Rest of the World
- Sealants Market By Product, Estimates and Forecast, 2017-2027
- Silicones
- Polyvinyl Acetate (PVA)
- Polyurethane
- Acrylic
- Sealants Market By Application, Estimates and Forecast, 2017-2027
- Pressure Sensitive Tapes
- Packaging
- Construction
- Assembly
- Automotive
- Consumers
- Sealants Market By Region, Estimates and Forecast, 2017-2027
- North America
- North America Sealants Market, By Country
- North America Sealants Market, By Product
- North America Sealants Market, By Application
- North America Sealants Market, By Technology
- U.S. Sealants Market, By Product
- U.S. Sealants Market, By Application
- U.S. Sealants Market, By Technology
- Canada Sealants Market, By Product
- Canada Sealants Market, By Application
- Canada Sealants Market, By Technology
- Mexico Sealants Market, By Product
- Mexico Sealants Market, By Application
- Mexico Sealants Market, By Technology
- North America
-
- Europe
- Europe Sealants Market, By Country
- Europe Sealants Market, By Product
- Europe Sealants Market, By Application
- Europe Sealants Market, By Technology
- Germany Sealants Market, By Product
- Germany Sealants Market, By Application
- Germany Sealants Market, By Technology
- France Sealants Market, By Product
- France Sealants Market, By Application
- France Sealants Market, By Technology
- UK Sealants Market, By Product
- UK Sealants Market, By Application
- UK Sealants Market, By Technology
- Italy Sealants Market, By Product
- Italy Sealants Market, By Application
- Italy Sealants Market, By Technology
- Russia Sealants Market, By Product
- Russia Sealants Market, By Application
- Russia Sealants Market, By Technology
- Rest of Europe Sealants Market, By Product
- Rest of Europe Sealants Market, By Application
- Rest of Europe Sealants Market, By Technology
-
- Asia-Pacific
- Asia-Pacific Sealants Market, By Country
- Asia-Pacific Sealants Market, By Product
- Asia-Pacific Sealants Market, By Application
- Asia-Pacific Sealants Market, By Technology
- Japan Sealants Market, By Product
- Japan Sealants Market, By Application
- Japan Sealants Market, By Technology
- India Sealants Market, By Product
- India Sealants Market, By Application
- India Sealants Market, By Technology
- China Sealants Market, By Product
- China Sealants Market, By Application
- China Sealants Market, By Technology
- South Korea Sealants Market, By Product
- South Korea Sealants Market, By Application
- South Korea Sealants Market, By Technology
- Taiwan Sealants Market, By Product
- Taiwan Sealants Market, By Application
- Taiwan Sealants Market, By Technology
- Thailand Sealants Market, By Product
- Thailand Sealants Market, By Application
- Thailand Sealants Market, By Technology
- Rest of Asia-Pacific Sealants Market, By Product
- Rest of Asia-Pacific Sealants Market, By Application
- Rest of Asia-Pacific Sealants Market, By Technology
- Asia-Pacific
-
- Rest of the World
- Rest of the World Sealants Market, By Country
- Rest of the World Sealants Market, By Product
- Rest of the World Sealants Market, By Application
- Rest of the World Sealants Market, By Technology
- Brazil Sealants Market, By Product
- Brazil Sealants Market, By Application
- Brazil Sealants Market, By Technology
- South Africa Sealants Market, By Product
- South Africa Sealants Market, By Application
- South Africa Sealants Market, By Technology
- Saudi Arabia Sealants Market, By Product
- Saudi Arabia Sealants Market, By Application
- Saudi Arabia Sealants Market, By Technology
- Turkey Sealants Market, By Product
- Turkey Sealants Market, By Application
- Turkey Sealants Market, By Technology
- United Arab Emirates Sealants Market, By Product
- United Arab Emirates Sealants Market, By Application
- United Arab Emirates Sealants Market, By Technology
- Others Sealants Market, By Product
- Others Sealants Market, By Application
- Others Sealants Market, By Technology
- Rest of the World
Table of Contents
1. Introduction
1.1. Report Description
1.2. Research Methodology
1.2.1. Secondary Research
1.2.2. Primary Research
2. Executive Summary
2.1. Key Highlights
3. Market Overview
3.1. Introduction
3.1.1. Market Definition
3.1.2. Market Segmentation
3.2. Market Share Analysis
3.3. Market Dynamics
3.3.1. Drivers
3.3.1.1. Automobile Industry to drive the Market
3.3.1.2. Increasing in Construction and Transportation spending
3.3.2. Restraints
3.3.2.1. Volatile raw material price trend
3.3.2.2. Strict environmental guideline
3.3.3. Opportunities
3.3.3.1. Growing demand of bio-based Adhesive
3.3.3.2. Strong access in Healthcare Industry.
3.4. Industry Trends
4. Adhesives Market By Technology Type
4.1. Introduction
4.2. Adhesives Market Volume Share By Technology, 2017 – 2027
4.3. Water-Based
4.3.1. Water-Based Market Volume and Revenue, 2017 – 2027
4.3.2. Water-Based Market Volume and Revenue, By Region, 2017 – 2027
4.4. Solvent-Based
4.4.1. Solvent-Based Market Volume and Revenue, 2017 – 2027
4.4.2. Solvent-Based Market Volume and Revenue, By Region, 2017 – 2027
4.5. Hot Melt
4.5.1. Hot Melt Market Volume and Revenue, 2017 – 2027
4.5.2. Hot Melt Market Volume and Revenue, By Region, 2017 – 2027
4.6. Reactive
4.6.1. Reactive Market Volume and Revenue, 2017 – 2027
4.6.2. Reactive Market Volume and Revenue, By Region, 2017 – 2027
5. Adhesives Market, By Product
5.1. Introduction
5.2. Adhesives Market Volume Share By Product, 2017 – 2027
5.3. Acrylic
5.3.1. Acrylic Market Volume and Revenue, 2017 – 2027
5.3.2. Acrylic Market Volume and Revenue, By Region, 2017 – 2027
5.4. Polyvinyl Acetate (PVA)
5.4.1. Polyvinyl Acetate Market Volume and Revenue, 2017 – 2027
5.4.2. Polyvinyl Acetate Market Volume and Revenue, By Region, 2017 – 2027
5.5. Polyurethane
5.5.1. Polyurethane Market Volume and Revenue, 2017 – 2027
5.5.2. Polyurethane Market Volume and Revenue, By Region, 2017 – 2027
5.6. Styrenic Block
5.6.1. Styrenic Block Market Volume and Revenue, 2017 – 2027
5.6.2. Styrenic Block Market Volume and Revenue, By Region, 2017 – 2027
5.7. Epoxy
5.7.1. Epoxy Market Volume and Revenue, 2017 – 2027
5.7.2. Epoxy Market Volume and Revenue, By Region, 2017 – 2027
5.8. Ethylene Vinyl Acetate (EVA)
5.8.1. Ethylene Vinyl Acetate Market Volume and Revenue, 2017 – 2027
5.8.2. Ethylene Vinyl Acetate Volume and Revenue, By Region, 2017 – 2027
5.9. Others
5.9.1. Others Market Volume and Revenue, 2017 – 2027
5.9.2. Others Market Volume and Revenue, By Region, 2017 – 2027
6. Adhesives Market, By Application Type
6.1. Introduction
6.2. Adhesives Market Volume Share By Application, 2017 – 2027
6.3. Pressure Sensitive Applications
6.3.1. Pressure Sensitive Applications Market Volume and Revenue, 2017 – 2027
6.3.2. Pressure Sensitive Applications Market Volume and Revenue, By Region, 2017 – 2027
6.4. Packaging
6.4.1. Packaging Market Volume and Revenue, 2017 – 2027
6.4.2. Packaging Market Volume and Revenue, By Region, 2017 – 2027
6.5. Construction
6.5.1. Construction Market Volume and Revenue, 2017 – 2027
6.5.2. Construction Market Volume and Revenue, By Region, 2017 – 2027
6.6. Furniture
6.6.1. Furniture Market Volume and Revenue, 2017 – 2027
6.6.2. Furniture Market Volume and Revenue, By Region, 2017 – 2027
6.7. Automotive
6.7.1. Automotive Market Volume and Revenue, 2017 – 2027
6.7.2. Automotive Market Volume and Revenue, By Region, 2017 – 2027
6.8. Others
6.8.1. Others Market Volume and Revenue, 2017 – 2027
6.8.2. Others Market Volume and Revenue, By Region, 2017 – 2027
7. Sealants Market, By Product
7.1. Introduction
7.2. Sealants Market Volume Share By Product, 2017 – 2027
7.3. Silicones
7.3.1. Silicones Market Volume and Revenue, 2017 – 2027
7.3.2. Silicones Market Volume and Revenue, By Region, 2017 – 2027
7.4. Polyvinyl Acetate (PVA)
7.4.1. Polyvinyl Acetate Market Volume and Revenue, 2017 – 2027
7.4.2. Polyvinyl Acetate Market Volume and Revenue, By Region, 2017 – 2027
7.5. Polyurethane
7.5.1. Polyurethane Market Volume and Revenue, 2017 – 2027
7.5.2. Polyurethane Market Volume and Revenue, By Region, 2017 – 2027
7.6. Acrylic
7.6.1. Acrylic Market Volume and Revenue, 2017 – 2027
7.6.2. Acrylic Market Volume and Revenue, By Region, 2017 – 2027
7.7. Others
7.7.1. Others Market Volume and Revenue, 2017 – 2027
7.7.2. Others Market Volume and Revenue, By Region, 2017 – 2027
8. Sealants Market, By Application Type
8.1. Introduction
8.2. Sealants Market Volume Share By Application, 2017 – 2027
8.3. Pressure Sensitive Tapes
8.3.1. Pressure Sensitive Applications Market Volume and Revenue, 2017 – 2027
8.3.2. Pressure Sensitive Applications Market Volume and Revenue, By Region, 2017 – 2027
8.4. Packaging
8.4.1. Packaging Market Volume and Revenue, 2017 – 2027
8.4.2. Packaging Market Volume and Revenue, By Region, 2017 – 2027
8.5. Construction
8.5.1. Construction Market Volume and Revenue, 2017 – 2027
8.5.2. Construction Market Volume and Revenue, By Region, 2017 – 2027
8.6. Assembly
8.6.1. Assembly Market Volume and Revenue, 2017 – 2027
8.6.2. Assembly Market Volume and Revenue, By Region, 2017 – 2027
8.7. Automotive
8.7.1. Automotive Market Volume and Revenue, 2017 – 2027
8.7.2. Automotive Market Volume and Revenue, By Region, 2017 – 2027
8.8. Consumers
8.8.1. Consumers Market Volume and Revenue, 2017 – 2027
8.8.2. Consumers Market Volume and Revenue, By Region, 2017 – 2027
8.9. Others
8.9.1. Others Market Volume and Revenue, 2017 – 2027
8.9.2. Others Market Volume and Revenue, By Region, 2017 – 2027
9. Adhesives Market, By Region
9.1. Introduction
9.2. Adhesives Market Volume and Revenue, By Region, 2017-2027
9.3. North America
9.3.1. Market Volume and Revenue, By Country, 2017-2027
9.3.2. Market Volume and Revenue, By Product, 2017-2027
9.3.3. Market Volume and Revenue, By Technology, 2017-2027
9.3.4. Market Volume and Revenue, By Application, 2017-2027
9.3.4.1. U.S.
9.3.4.1.1. Market Volume and Revenue, By Product, 2017-2027
9.3.4.1.2. Market Volume and Revenue, By Technology, 2017-2027
9.3.4.1.3. Market Volume and Revenue, By Application, 2017-2027
9.3.4.1.4.
9.3.4.2. Canada
9.3.4.2.1. Market Volume and Revenue, By Product, 2017-2027
9.3.4.2.2. Market Volume and Revenue, By Technology, 2017-2027
9.3.4.2.3. Market Volume and Revenue, By Application, 2017-2027
9.3.4.2.4.
9.3.4.3. Mexico
9.3.4.3.1. Market Volume and Revenue, By Product, 2017-2027
9.3.4.3.2. Market Volume and Revenue, By Technology, 2017-2027
9.3.4.3.3. Market Volume and Revenue, By Application, 2017-2027
9.4. Europe
9.4.1. Market Volume and Revenue, By Country, 2017-2027
9.4.2. Market Volume and Revenue, By Product, 2017-2027
9.4.3. Market Volume and Revenue, By Technology, 2017-2027
9.4.4. Market Volume and Revenue, By Application, 2017-2027
9.4.4.1. Germany
9.4.4.1.1. Market Volume and Revenue, By Product, 2017-2027
9.4.4.1.2. Market Volume and Revenue, By Technology, 2017-2027
9.4.4.1.3. Market Volume and Revenue, By Applications, 2017-2027
9.4.4.2. France
9.4.4.2.1. Market Volume and Revenue, By Product, 2017-2027
9.4.4.2.2. Market Volume and Revenue, By Technology, 2017-2027
9.4.4.2.3. Market Volume and Revenue, By Applications, 2017-2027
9.4.4.3. UK
9.4.4.3.1. Market Volume and Revenue, By Product, 2017-2027
9.4.4.3.2. Market Volume and Revenue, By Technology, 2017-2027
9.4.4.3.3. Market Volume and Revenue, By Applications, 2017-2027
9.4.4.4. Italy
9.4.4.4.1. Market Volume and Revenue, By Product, 2017-2027
9.4.4.4.2. Market Volume and Revenue, By Technology, 2017-2027
9.4.4.4.3. Market Volume and Revenue, By Applications, 2017-2027
9.4.4.5. Russia
9.4.4.5.1. Market Volume and Revenue, By Product, 2017-2027
9.4.4.5.2. Market Volume and Revenue, By Technology, 2017-2027
9.4.4.5.3. Market Volume and Revenue, By Applications, 2017-2027
9.4.4.6. Rest of Europe
9.4.4.6.1. Market Volume and Revenue, By Product, 2017-2027
9.4.4.6.2. Market Volume and Revenue, By Technology, 2017-2027
9.4.4.6.3. Market Volume and Revenue, By Applications, 2017-2027
9.5. Asia-Pacific
9.5.1. Market Volume and Revenue, By Country, 2017-2027
9.5.2. Market Volume and Revenue, By Product, 2017-2027
9.5.3. Market Volume and Revenue, By Technology, 2017-2027
9.5.4. Market Volume and Revenue, By Application, 2017-2027
9.5.4.1. Japan
9.5.4.1.1. Market Volume and Revenue, By Product, 2017-2027
9.5.4.1.2. Market Volume and Revenue, By Technology, 2017-2027
9.5.4.1.3. Market Volume and Revenue, By Applications, 2017-2027
9.5.4.2. China
9.5.4.2.1. Market Volume and Revenue, By Product, 2017-2027
9.5.4.2.2. Market Volume and Revenue, By Technology, 2017-2027
9.5.4.2.3. Market Volume and Revenue, By Applications, 2017-2027
9.5.4.3. India
9.5.4.3.1. Market Volume and Revenue, By Product, 2017-2027
9.5.4.3.2. Market Volume and Revenue, By Technology, 2017-2027
9.5.4.3.3. Market Volume and Revenue, By Applications, 2017-2027
9.5.4.4. South Korea
9.5.4.4.1. Market Volume and Revenue, By Product, 2017-2027
9.5.4.4.2. Market Volume and Revenue, By Technology, 2017-2027
9.5.4.4.3. Market Volume and Revenue, By Applications, 2017-2027
9.5.4.5. Taiwan
9.5.4.5.1. Market Volume and Revenue, By Product , 2017-2027
9.5.4.5.2. Market Volume and Revenue, By Technology, 2017-2027
9.5.4.5.3. Market Volume and Revenue, By Applications, 2017-2027
9.5.4.6. Thailand
9.5.4.6.1. Market Volume and Revenue, By Product, 2017-2027
9.5.4.6.2. Market Volume and Revenue, By Technology, 2017-2027
9.5.4.6.3. Market Volume and Revenue, By Applications, 2017-2027
9.5.4.7. Rest of Asia-Pacific
9.5.4.7.1. Market Volume and Revenue, By Product, 2017-2027
9.5.4.7.2. Market Volume and Revenue, By Technology, 2017-2027
9.5.4.7.3. Market Volume and Revenue, By Applications, 2017-2027
9.6. Rest of the World
9.6.1. Market Volume and Revenue, By Country, 2017-2027
9.6.2. Market Volume and Revenue, By Product, 2017-2027
9.6.3. Market Volume and Revenue, By Technology, 2017-2027
9.6.4. Market Volume and Revenue, By Application, 2017-2027
9.6.4.1. Brazil
9.6.4.1.1. Market Volume and Revenue, By Product, 2017-2027
9.6.4.1.2. Market Volume and Revenue, By Technology, 2017-2027
9.6.4.1.3. Market Volume and Revenue, By Applications, 2017-2027
9.6.4.2. Turkey
9.6.4.2.1. Market Volume and Revenue, By Product,2017-2027
9.6.4.2.2. Market Volume and Revenue, By Technology, 2017-2027
9.6.4.2.3. Market Volume and Revenue, By Applications, 2017-2027
9.6.4.3. Saudi Arabia
9.6.4.3.1. Market Volume and Revenue, By Product, 2017-2027
9.6.4.3.2. Market Volume and Revenue, By Technology, 2017-2027
9.6.4.3.3. Market Volume and Revenue, By Applications, 2017-2027
9.6.4.4. South Africa
9.6.4.4.1. Market Volume and Revenue, By Product, 2017-2027
9.6.4.4.2. Market Volume and Revenue, By Technology, 2017-2027
9.6.4.4.3. Market Volume and Revenue, By Applications, 2017-2027
9.6.4.4.4.
9.6.4.5. United Arab Emirates
9.6.4.5.1. Market Volume and Revenue, By Product, 2017-2027
9.6.4.5.2. Market Volume and Revenue, By Technology, 2017-2027
9.6.4.5.3. Market Volume and Revenue, By Applications, 2017-2027
9.6.4.5.4.
9.6.4.6. Others
9.6.4.6.1. Market Assessment and Forecast, By Product, 2017-2027
9.6.4.6.2. Market Assessment and Forecast, By Technology, 2017-2027
9.6.4.6.3. Market Assessment and Forecast, By Application, 2017-2027
10. Sealants Market, By Region
10.1. Introduction
10.2. Selannts Market Volume and Revenue, By Region, 2017-2027
10.3. North America
10.3.1. Market Volume and Revenue, By Country, 2017-2027
10.3.2. Market Volume and Revenue, By Product, 2017-2027
10.3.3. Market Volume and Revenue, By Technology, 2017-2027
10.3.4. Market Volume and Revenue, By Application, 2017-2027
10.3.4.1. United States
10.3.4.1.1. Market Volume and Revenue, By Product, 2017-2027
10.3.4.1.2. Market Volume and Revenue, By Technology, 2017-2027
10.3.4.1.3. Market Volume and Revenue, By Application, 2017-2027
10.3.4.2. Canada
10.3.4.2.1. Market Volume and Revenue, By Product, 2017-2027
10.3.4.2.2. Market Volume and Revenue, By Technology, 2017-2027
10.3.4.2.3. Market Volume and Revenue, By Application, 2017-2027
10.3.4.2.4.
10.3.4.3. Mexico
10.3.4.3.1. Market Volume and Revenue, By Product, 2017-2027
10.3.4.3.2. Market Volume and Revenue, By Technology, 2017-2027
10.3.4.3.3. Market Volume and Revenue, By Application, 2017-2027
10.4. Europe
10.4.1. Market Volume and Revenue, By Country, 2017-2027
10.4.2. Market Volume and Revenue, By Product, 2017-2027
10.4.3. Market Volume and Revenue, By Technology, 2017-2027
10.4.4. Market Volume and Revenue, By Application, 2017-2027
10.4.4.1. Germany
10.4.4.1.1. Market Volume and Revenue, By Product, 2017-2027
10.4.4.1.2. Market Volume and Revenue, By Technology, 2017-2027
10.4.4.1.3. Market Volume and Revenue, By Applications, 2017-2027
10.4.4.2. France
10.4.4.2.1. Market Volume and Revenue, By Product, 2017-2027
10.4.4.2.2. Market Volume and Revenue, By Technology, 2017-2027
10.4.4.2.3. Market Volume and Revenue, By Applications, 2017-2027
10.4.4.3. UK
10.4.4.3.1. Market Volume and Revenue, By Product, 2017-2027
10.4.4.3.2. Market Volume and Revenue, By Technology, 2017-2027
10.4.4.3.3. Market Volume and Revenue, By Applications, 2017-2027
10.4.4.4. Italy
10.4.4.4.1. Market Volume and Revenue, By Product,2017-2027
10.4.4.4.2. Market Volume and Revenue, By Technology, 2017-2027
10.4.4.4.3. Market Volume and Revenue, By Applications, 2017-2027
10.4.4.5. Russia
10.4.4.5.1. Market Volume and Revenue, By Product,2017-2027
10.4.4.5.2. Market Volume and Revenue, By Technology, 2017-2027
10.4.4.5.3. Market Volume and Revenue, By Applications, 2017-2027
10.4.4.6. Rest of Europe
10.4.4.6.1. Market Volume and Revenue, By Product, 2017-2027
10.4.4.6.2. Market Volume and Revenue, By Technology, 2017-2027
10.4.4.6.3. Market Volume and Revenue, By Applications, 2017-2027
10.5. Asia-Pacific
10.5.1. Market Volume and Revenue, By Country, 2017-2027
10.5.2. Market Volume and Revenue, By Product, 2017-2027
10.5.3. Market Volume and Revenue, By Technology, 2017-2027
10.5.4. Market Volume and Revenue, By Application, 2017-2027
10.5.4.1. Japan
10.5.4.1.1. Market Volume and Revenue, By Product, 2017-2027
10.5.4.1.2. Market Volume and Revenue, By Technology, 2017-2027
10.5.4.1.3. Market Volume and Revenue, By Applications, 2017-2027
10.5.4.2. China
10.5.4.2.1. Market Volume and Revenue, By Product, 2017-2027
10.5.4.2.2. Market Volume and Revenue, By Technology, 2017-2027
10.5.4.2.3. Market Volume and Revenue, By Applications, 2017-2027
10.5.4.3. India
10.5.4.3.1. Market Volume and Revenue, By Product, 2017-2027
10.5.4.3.2. Market Volume and Revenue, By Technology, 2017-2027
10.5.4.3.3. Market Volume and Revenue, By Applications, 2017-2027
10.5.4.4. South Korea
10.5.4.4.1. Market Volume and Revenue, By Product, 2017-2027
10.5.4.4.2. Market Volume and Revenue, By Technology, 2017-2027
10.5.4.4.3. Market Volume and Revenue, By Applications, 2017-2027
10.5.4.5. Taiwan
10.5.4.5.1. Market Volume and Revenue, By Product, 2017-2027
10.5.4.5.2. Market Volume and Revenue, By Technology, 2017-2027
10.5.4.5.3. Market Volume and Revenue, By Applications, 2017-2027
10.5.4.6. Thailand
10.5.4.6.1. Market Volume and Revenue, By Product, 2017-2027
10.5.4.6.2. Market Volume and Revenue, By Technology, 2017-2027
10.5.4.6.3. Market Volume and Revenue, By Applications, 2017-2027
10.5.4.7. Rest of Asia-Pacific
10.5.4.7.1. Market Volume and Revenue, By Product, 2017-2027
10.5.4.7.2. Market Volume and Revenue, By Technology, 2017-2027
10.5.4.7.3. Market Volume and Revenue, By Applications, 2017-2027
10.6. Rest of the World
10.6.1. Market Volume and Revenue, By Country, 2017-2027
10.6.2. Market Volume and Revenue, By Product, 2017-2027
10.6.3. Market Volume and Revenue, By Technology, 2017-2027
10.6.4. Market Volume and Revenue, By Application, 2017-2027
10.6.4.1. Brazil
10.6.4.1.1. Market Volume and Revenue, By Product, 2017-2027
10.6.4.1.2. Market Volume and Revenue, By Technology, 2017-2027
10.6.4.1.3. Market Volume and Revenue, By Applications, 2017-2027
10.6.4.2. Turkey
10.6.4.2.1. Market Volume and Revenue, By Product, 2017-2027
10.6.4.2.2. Market Volume and Revenue, By Technology, 2017-2027
10.6.4.2.3. Market Volume and Revenue, By Applications, 2017-2027
10.6.4.3. Saudi Arabia
10.6.4.3.1. Market Volume and Revenue, By Product, 2017-2027
10.6.4.3.2. Market Volume and Revenue, By Technology, 2017-2027
10.6.4.3.3. Market Volume and Revenue, By Applications, 2017-2027
10.6.4.4. South Africa
10.6.4.4.1. Market Volume and Revenue, By Product, 2017-2027
10.6.4.4.2. Market Volume and Revenue, By Technology, 2017-2027
10.6.4.4.3. Market Volume and Revenue, By Applications, 2017-2027
10.6.4.5. United Arab Emirates
10.6.4.5.1. Market Volume and Revenue, By Product, 2017-2027
10.6.4.5.2. Market Volume and Revenue, By Technology, 2017-2027
10.6.4.5.3. Market Volume and Revenue, By Applications, 2017-2027
10.6.4.6. Others
10.6.4.6.1. Market Volume and Revenue, By Product, 2017-2027
10.6.4.6.2. Market Volume and Revenue, By By Technology, 2017-2027
10.6.4.6.3. Market Volume and Revenue, By Applications, 2017-2027
11. Company Profiles
11.1. 3M Company
11.1.1. Business Overview
11.1.2. Product Portfolio
11.1.3. Key Financials
11.1.4. Strategic Developments
11.2. DOW Chemical Company
11.2.1. Business Overview
11.2.2. Product Portfolio
11.2.3. Key Financials
11.2.4. Strategic Developments
11.3. Bostik SA
11.3.1. Business Overview
11.3.2. Product Portfolio
11.3.3. Key Financials
11.3.4. Strategic Developments
11.4. ND Industries Inc.
11.4.1. Business Overview
11.4.2. Product Portfolio
11.4.3. Key Financials
11.4.4. Strategic Developments
11.5. Franklin International
11.5.1. Business Overview
11.5.2. Product Portfolio
11.5.3. Key Financials
11.5.4. Strategic Developments
11.6. Royal Adhesives & Sealants, LLC
11.6.1. Business Overview
11.6.2. Product Portfolio
11.6.3. Key Financials
11.6.4. Strategic Developments
11.7. H.B. Fuller Company
11.7.1. Business Overview
11.7.2. Product Portfolio
11.7.3. Key Financials
11.7.4. Strategic Developments
11.8. Avery Dennison Corporation
11.8.1. Business Overview
11.8.2. Product Portfolio
11.8.3. Strategic Developments
11.9. BASF AG
11.9.1. Business Overview
11.9.2. Product Portfolio
11.9.3. Key Financials
11.9.4. Strategic Developments
11.10. Uniseal Inc.
11.10.1. Business Overview
11.10.2. Product Portfolio
11.10.3. Key Financials
11.10.4. Strategic Developments
11.11. Ashland Inc.
11.11.1. Business Overview
11.11.2. Product Portfolio
11.11.3. Key Financials
11.11.4. Strategic Developments
11.12. Beardow & Adams Adhesives Inc.
11.12.1. Business Overview
11.12.2. Product Portfolio
11.12.3. Key Financials
11.12.4. Strategic Developments
11.13. Eastman Chemical Company
11.13.1. Business Overview
11.13.2. Product Portfolio
11.13.3. Key Financials
11.13.4. Strategic Developments
11.14. Sika AG
11.14.1. Business Overview
11.14.2. Product Portfolio
11.14.3. Key Financials
11.14.4. Strategic Developments
List of Tables
1. Adhesive Market (Volume & Revenue), 2017-2025
2. Sealant Market (Volume & Revenue), 2017-2025
3. Adhesive Market Volume by Region (Kilo Tons), 2017-2025
4. Sealant Market Volume by Region (Kilo Tons), 2017-2025
5. Adhesive Market Revenue by Region (USD Million), 2017-2025
6. Sealant Market Revenue by Region (USD Million), 2017-2025
7. Adhesive Market Volume by Technology (Kilo Tons), 2017-2025
8. Adhesive Market Revenue by Technology (USD Million), 2017-2025
9. Adhesive Market Volume by Product (Kilo Tons), 2017-2025
10. Adhesive Market Revenue by Product (USD Million), 2017-2025
11. Adhesive Market Volume by Application (Kilo Tons), 2017-2025
12. Adhesive Market Revenue by Application (USD Million), 2017-2025
13. Water-Based Adhesive Market Volume (Kilo Tons), 2017-2025
14. Water-Based Adhesive Market Revenue (USD million), 2017-2025
15. Solvent-Based Adhesive Market Volume (Kilo Tons), 2017-2025
16. Solvent-Based Adhesive Market Revenue (USD million), 2017-2025
17. Hot Melt Adhesive Market Volume (Kilo Tons), 2017-2025
18. Hot Melt Adhesive Market Revenue (USD million), 2017-2025
19. Reactive & Other Adhesive Market Volume (Kilo Tons), 2017-2025
20. Reactive & Other Adhesive Market Revenue (USD million), 2017-2025
21. Acrylic Adhesive Market Volume (Kilo Tons), 2017-2025
22. Acrylic Adhesive Market Revenue (USD million), 2017-2025
23. PVA Adhesive Market Volume (Kilo Tons), 2017-2025
24. PVA Adhesive Market Revenue (USD million), 2017-2025
25. Polyurethane Adhesive Market Volume (Kilo Tons), 2017-2025
26. Polyurethane Adhesive Market Revenue (USD million), 2017-2025
27. Styrenic Block Adhesive Market Volume (Kilo Tons), 2017-2025
28. Styrenic Block Adhesive Market Revenue (USD million), 2017-2025
29. Epoxy Adhesive Market Volume (Kilo Tons), 2017-2025
30. Epoxy Adhesive Market Revenue (USD million), 2017-2025
31. EVA Adhesive Market Volume (Kilo Tons), 2017-2025
32. EVA Adhesive Market Revenue (USD million), 2017-2025
33. Adhesive Market Volume for Pressure Sensitive Applications (Kilo Tons), 2017-2025
34. Adhesive Market Revenue for Pressure Sensitive Applications (USD million), 2017-2025
35. Adhesive Market Volume for Packaging (Kilo Tons), 2017-2025
36. Adhesive Market Revenue for Packaging (USD million), 2017-2025
37. Adhesive Market Volume for Construction (Kilo Tons), 2017-2025
38. Adhesive Market Revenue for Construction (USD million), 2017-2025
39. Adhesive Market Volume for Furniture (Kilo Tons), 2017-2025
40. Adhesive Market Revenue for Furniture (USD million), 2017-2025
41. Adhesive Market Volume for Footwear (Kilo Tons), 2017-2025
42. Adhesive Market Revenue for Footwear (USD million), 2017-2025
43. Adhesive Market Volume for Automotive (Kilo Tons), 2017-2025
44. Adhesive Market Revenue for Automotive (USD million), 2017-2025
45. Adhesive Market Volume for Other Applications (Kilo Tons), 2017-2025
46. Adhesive Market Revenue for Other Applications (USD million), 2017-2025
47. Sealant Market Volume by Product (Kilo Tons), 2017-2025
48. Sealant Market Revenue by Product (USD Million), 2017-2025
49. Sealant Market Volume by Application (Kilo Tons), 2017-2025
50. Sealant Market Revenue by Application (USD Million), 2017-2025
51. Silicone Sealant Market Volume (Kilo Tons), 2017-2025
52. Silicone Sealant Market Revenue (USD million), 2017-2025
53. Polyurethane Sealant Market Volume (Kilo Tons), 2017-2025
54. Polyurethane Sealant Market Revenue (USD million), 2017-2025
55. Acrylic Sealant Market Volume (Kilo Tons), 2017-2025
56. Acrylic Sealant Market Revenue (USD million), 2017-2025
57. PVA Sealant Market Volume (Kilo Tons), 2017-2025
58. PVA Sealant Market Revenue (USD million), 2017-2025
59. Other Sealant Market Volume (Kilo Tons), 2017-2025
60. Other Sealant Market Revenue (USD million), 2017-2025
61. Sealant Market Volume for Construction (Kilo Tons), 2017-2025
62. Sealant Market Revenue for Construction (USD million), 2017-2025
63. Sealant Market Volume for Automotive (Kilo Tons), 2017-2025
64. Sealant Market Revenue for Automotive (USD million), 2017-2025
65. Sealant Market Volume for Packaging (Kilo Tons), 2017-2025
66. Sealant Market Revenue for Packaging (USD million), 2017-2025
67. Sealant Market Volume for Assembly (Kilo Tons), 2017-2025
68. Sealant Market Revenue for Assembly (USD million), 2017-2025
69. Sealant Market Volume for Pressure Sensitive Tapes (Kilo Tons), 2017-2025
70. Sealant Market Revenue for Pressure Sensitive Tapes (USD million), 2017-2025
71. Sealant Market Volume for Consumers (Kilo Tons), 2017-2025
72. Sealant Market Revenue for Consumers (USD million), 2017-2025
73. Sealant Market Volume for Other Applications (Kilo Tons), 2017-2025
74. Sealant Market Revenue for Other Applications (USD million), 2017-2025
75. North America Adhesive Market Volume by Technology (Kilo Tons), 2017-2025
76. North America Adhesive Market Revenue by Technology (USD million), 2017-2025
77. North America Adhesive Market Volume by Product (Kilo Tons), 2017-2025
78. North America Adhesive Market Revenue by Product (USD Million), 2017-2025
79. North America Adhesive Market Volume by Application (Kilo Tons), 2017-2025
80. North America Adhesive Market Revenue by Application (USD Million), 2017-2025
81. United States Adhesive Market Volume by Technology (Kilo Tons), 2017-2025
82. United States Adhesive Market Revenue by Technology (USD million), 2017-2025
83. United States Adhesive Market Volume by Product (Kilo Tons), 2017-2025
84. United States Adhesive Market Revenue by Product (USD Million), 2017-2025
85. United States Adhesive Market Volume by Application (Kilo Tons), 2017-2025
86. United States Adhesive Market Revenue by Application (USD Million), 2017-2025
87. Canada Adhesive Market Volume by Technology (Kilo Tons), 2017-2025
88. Canada Adhesive Market Revenue by Technology (USD million), 2017-2025
89. Canada Adhesive Market Volume by Product (Kilo Tons), 2017-2025
90. Canada Adhesive Market Revenue by Product (USD Million), 2017-2025
91. Canada Adhesive Market Volume by Application (Kilo Tons), 2017-2025
92. Canada Adhesive Market Revenue by Application (USD Million), 2017-2025
93. Mexico Adhesive Market Volume by Technology (Kilo Tons), 2017-2025
94. Mexico Adhesive Market Revenue by Technology (USD million), 2017-2025
95. Mexico Adhesive Market Volume by Product (Kilo Tons), 2017-2025
96. Mexico Adhesive Market Revenue by Product (USD Million), 2017-2025
97. Mexico Adhesive Market Volume by Application (Kilo Tons), 2017-2025
98. Mexico Adhesive Market Revenue by Application (USD Million), 2017-2025
99. Europe Adhesive Market Volume by Technology (Kilo Tons), 2017-2025
100. Europe Adhesive Market Revenue by Technology (USD Million), 2017-2025
101. Europe Adhesive Market Volume by Product (Kilo Tons), 2017-2025
102. Europe Adhesive Market Revenue by Product (USD million), 2017-2025
103. Europe Adhesive Market Volume by Application (Kilo Tons), 2017-2025
104. Europe Adhesive Market Revenue by Application (USD Million), 2017-2025
105. Germany Adhesive Market Volume by Technology (Kilo Tons), 2017-2025
106. Germany Adhesive Market Revenue by Technology (USD million), 2017-2025
107. Germany Adhesive Market Volume by Product (Kilo Tons), 2017-2025
108. Germany Adhesive Market Revenue by Product (USD Million), 2017-2025
109. Germany Adhesive Market Volume by Application (Kilo Tons), 2017-2025
110. Germany Adhesive Market Revenue by Application (USD Million), 2017-2025
111. France Adhesive Market Volume by Technology (Kilo Tons), 2017-2025
112. France Adhesive Market Revenue by Technology (USD million), 2017-2025
113. France Adhesive Market Volume by Product (Kilo Tons), 2017-2025
114. France Adhesive Market Revenue by Product (USD Million), 2017-2025
115. France Adhesive Market Volume by Application (Kilo Tons), 2017-2025
116. France Adhesive Market Revenue by Application (USD Million), 2017-2025
117. UK Adhesive Market Volume by Technology (Kilo Tons), 2017-2025
118. UK Adhesive Market Revenue by Technology (USD million), 2017-2025
119. UK Adhesive Market Volume by Product (Kilo Tons), 2017-2025
120. UK Adhesive Market Revenue by Product (USD Million), 2017-2025
121. UK Adhesive Market Volume by Application (Kilo Tons), 2017-2025
122. UK Adhesive Market Revenue by Application (USD Million), 2017-2025
123. Italy Adhesive Market Volume by Technology (Kilo Tons), 2017-2025
124. Italy Adhesive Market Revenue by Technology (USD million), 2017-2025
125. Italy Adhesive Market Volume by Product (Kilo Tons), 2017-2025
126. Italy Adhesive Market Revenue by Product (USD Million), 2017-2025
127. Italy Adhesive Market Volume by Application (Kilo Tons), 2017-2025
128. Italy Adhesive Market Revenue by Application (USD Million), 2017-2025
129. Russia Adhesive Market Volume by Technology (Kilo Tons), 2017-2025
130. Russia Adhesive Market Revenue by Technology (USD million), 2017-2025
131. Russia Adhesive Market Volume by Product (Kilo Tons), 2017-2025
132. Russia Adhesive Market Revenue by Product (USD Million), 2017-2025
133. Russia Adhesive Market Volume by Application (Kilo Tons), 2017-2025
134. Rest of Europe Adhesive Market Revenue by Application (USD Million), 2017-2025
135. Rest of Europe Adhesive Market Volume by Technology (Kilo Tons), 2017-2025
136. Rest of Europe Adhesive Market Revenue by Technology (USD million), 2017-2025
137. Rest of Europe Adhesive Market Volume by Product (Kilo Tons), 2017-2025
138. Rest of Europe Adhesive Market Revenue by Product (USD Million), 2017-2025
139. Rest of Europe Adhesive Market Volume by Application (Kilo Tons), 2017-2025
140. Rest of Europe Adhesive Market Revenue by Application (USD Million), 2017-2025
141. Asia Pacific Adhesive Market Volume by Technology (Kilo Tons), 2017-2025
142. Asia Pacific Adhesive Market Revenue by Technology (USD Million), 2017-2025
143. Asia Pacific Adhesive Market Volume by Product (Kilo Tons), 2017-2025
144. Asia Pacific Adhesive Market Revenue by Product (USD million), 2017-2025
145. Asia Pacific Adhesive Market Volume by Application (Kilo Tons), 2017-2025
146. Asia Pacific Adhesive Market Revenue by Application (USD Million), 2017-2025
147. Japan Adhesive Market Volume by Technology (Kilo Tons), 2017-2025
148. Japan Adhesive Market Revenue by Technology (USD Million), 2017-2025
149. Japan Adhesive Market Volume by Product (Kilo Tons), 2017-2025
150. Japan Adhesive Market Revenue by Product (USD million), 2017-2025
151. Japan Adhesive Market Volume by Application (Kilo Tons), 2017-2025
152. Japan Adhesive Market Revenue by Application (USD Million), 2017-2025
153. India Adhesive Market Volume by Technology (Kilo Tons), 2017-2025
154. India Adhesive Market Revenue by Technology (USD Million), 2017-2025
155. India Adhesive Market Volume by Product (Kilo Tons), 2017-2025
156. India Adhesive Market Revenue by Product (USD million), 2017-2025
157. India Adhesive Market Volume by Application (Kilo Tons), 2017-2025
158. India Adhesive Market Revenue by Application (USD Million), 2017-2025
159. China Adhesive Market Volume by Technology (Kilo Tons), 2017-2025
160. China Adhesive Market Revenue by Technology (USD Million), 2017-2025
161. China Adhesive Market Volume by Product (Kilo Tons), 2017-2025
162. China Adhesive Market Revenue by Product (USD million), 2017-2025
163. China Adhesive Market Volume by Application (Kilo Tons), 2017-2025
164. China Adhesive Market Revenue by Application (USD Million), 2017-2025
165. South Korea Adhesive Market Volume by Technology (Kilo Tons), 2017-2025
166. South Korea Adhesive Market Revenue by Technology (USD Million), 2017-2025
167. South Korea Adhesive Market Volume by Product (Kilo Tons), 2017-2025
168. South Korea Adhesive Market Revenue by Product (USD million), 2017-2025
169. South Korea Adhesive Market Volume by Application (Kilo Tons), 2017-2025
170. South Korea Adhesive Market Revenue by Application (USD Million), 2017-2025
171. Taiwan Adhesive Market Volume by Technology (Kilo Tons), 2017-2025
172. Taiwan Adhesive Market Revenue by Technology (USD Million), 2017-2025
173. Taiwan Adhesive Market Volume by Product (Kilo Tons), 2017-2025
174. Taiwan Adhesive Market Revenue by Product (USD million), 2017-2025
175. Taiwan Adhesive Market Volume by Application (Kilo Tons), 2017-2025
176. Taiwan Adhesive Market Revenue by Application (USD Million), 2017-2025
177. Thailand Adhesive Market Volume by Technology (Kilo Tons), 2017-2025
178. Thailand Adhesive Market Revenue by Technology (USD Million), 2017-2025
179. Thailand Adhesive Market Volume by Product (Kilo Tons), 2017-2025
180. Thailand Adhesive Market Revenue by Product (USD million), 2017-2025
181. Thailand Adhesive Market Volume by Application (Kilo Tons), 2017-2025
182. Thailand Adhesive Market Revenue by Application (USD Million), 2017-2025
183. Rest of Asia Adhesive Market Volume by Technology (Kilo Tons), 2017-2025
184. Rest of Asia Adhesive Market Revenue by Technology (USD Million), 2017-2025
185. Rest of Asia Adhesive Market Volume by Product (Kilo Tons), 2017-2025
186. Rest of Asia Adhesive Market Revenue by Product (USD million), 2017-2025
187. Rest of Asia Adhesive Market Volume by Application (Kilo Tons), 2017-2025
188. Rest of Asia Adhesive Market Revenue by Application (USD Million), 2017-2025
189. Rest of the World Adhesive Market Volume by Technology (Kilo Tons), 2017-2025
190. Rest of the World Adhesive Market Revenue by Technology (USD Million), 2017-2025
191. Rest of the World Adhesive Market Volume by Product (Kilo Tons), 2017-2025
192. Rest of the World Adhesive Market Revenue by Product (USD million), 2017-2025
193. Rest of the World Adhesive Market Volume by Application (Kilo Tons), 2017-2025
194. Rest of the World Adhesive Market Revenue by Application (USD Million), 2017-2025
195. Brazil Adhesive Market Volume by Technology (Kilo Tons), 2017-2025
196. Brazil Adhesive Market Revenue by Technology (USD Million), 2017-2025
197. Brazil Adhesive Market Volume by Product (Kilo Tons), 2017-2025
198. Brazil Adhesive Market Revenue by Product (USD million), 2017-2025
199. Brazil Adhesive Market Volume by Application (Kilo Tons), 2017-2025
200. Brazil Adhesive Market Revenue by Application (USD Million), 2017-2025
201. Turkey Adhesive Market Volume by Technology (Kilo Tons), 2017-2025
202. Turkey Adhesive Market Revenue by Technology (USD Million), 2017-2025
203. Turkey Adhesive Market Volume by Product (Kilo Tons), 2017-2025
204. Turkey Adhesive Market Revenue by Product (USD million), 2017-2025
205. Turkey Adhesive Market Volume by Application (Kilo Tons), 2017-2025
206. Turkey Adhesive Market Revenue by Application (USD Million), 2017-2025
207. Saudi Arabia Adhesive Market Volume by Technology (Kilo Tons), 2017-2025
208. Saudi Arabia Adhesive Market Revenue by Technology (USD Million), 2017-2025
209. Saudi Arabia Adhesive Market Volume by Product (Kilo Tons), 2017-2025
210. Saudi Arabia Adhesive Market Revenue by Product (USD million), 2017-2025
211. Saudi Arabia Adhesive Market Volume by Application (Kilo Tons), 2017-2025
212. Saudi Arabia Adhesive Market Revenue by Application (USD Million), 2017-2025
213. Saudi Africa Adhesive Market Volume by Technology (Kilo Tons), 2017-2025
214. Saudi Africa Adhesive Market Revenue by Technology (USD Million), 2017-2025
215. Saudi Africa Adhesive Market Volume by Product (Kilo Tons), 2017-2025
216. Saudi Africa Adhesive Market Revenue by Product (USD million), 2017-2025
217. Saudi Africa Adhesive Market Volume by Application (Kilo Tons), 2017-2025
218. Saudi Africa Adhesive Market Revenue by Application (USD Million), 2017-2025
219. United Arab Emirates Adhesive Market Volume by Technology (Kilo Tons), 2017-2025
220. United Arab Emirates Adhesive Market Revenue by Technology (USD Million), 2017-2025
221. United Arab Emirates Adhesive Market Volume by Product (Kilo Tons), 2017-2025
222. United Arab Emirates Adhesive Market Revenue by Product (USD million), 2017-2025
223. United Arab Emirates Adhesive Market Volume by Application (Kilo Tons), 2017-2025
224. North America Sealant Market Volume by Product (Kilo Tons), 2017-2025
225. North America Sealant Market Revenue by Product (USD million), 2017-2025
226. North America Sealant Market Volume by Application (Kilo Tons), 2017-2025
227. North America Sealant Market Revenue by Application (USD Million), 2017-2025
228. United States Sealant Market Volume by Technology (Kilo Tons), 2017-2025
229. United States Sealant Market Revenue by Technology (USD million), 2017-2025
230. United States Sealant Market Volume by Product (Kilo Tons), 2017-2025
231. United States Sealant Market Revenue by Product (USD Million), 2017-2025
232. United States Sealant Market Volume by Application (Kilo Tons), 2017-2025
233. United States Sealant Market Revenue by Application (USD Million), 2017-2025
234. Canada Sealant Market Volume by Technology (Kilo Tons), 2017-2025
235. Canada Sealant Market Revenue by Technology (USD million), 2017-2025
236. Canada Sealant Market Volume by Product (Kilo Tons), 2017-2025
237. Canada Sealant Market Revenue by Product (USD Million), 2017-2025
238. Canada Sealant Market Volume by Application (Kilo Tons), 2017-2025
239. Canada Sealant Market Revenue by Application (USD Million), 2017-2025
240. Mexico Sealant Market Volume by Technology (Kilo Tons), 2017-2025
241. Mexico Sealant Market Revenue by Technology (USD million), 2017-2025
242. Mexico Sealant Market Volume by Product (Kilo Tons), 2017-2025
243. Mexico Sealant Market Revenue by Product (USD Million), 2017-2025
244. Mexico Sealant Market Volume by Application (Kilo Tons), 2017-2025
245. Mexico Sealant Market Revenue by Application (USD Million), 2017-2025
246. Europe Sealant Market Volume by Technology (Kilo Tons), 2017-2025
247. Europe Sealant Market Revenue by Technology (USD Million), 2017-2025
248. Europe Sealant Market Volume by Product (Kilo Tons), 2017-2025
249. Europe Sealant Market Revenue by Product (USD million), 2017-2025
250. Europe Sealant Market Volume by Application (Kilo Tons), 2017-2025
251. Europe Sealant Market Revenue by Application (USD Million), 2017-2025
252. Germany Sealant Market Volume by Technology (Kilo Tons), 2017-2025
253. Germany Sealant Market Revenue by Technology (USD million), 2017-2025
254. Germany Sealant Market Volume by Product (Kilo Tons), 2017-2025
255. Germany Sealant Market Revenue by Product (USD Million), 2017-2025
256. Germany Sealant Market Volume by Application (Kilo Tons), 2017-2025
257. Germany Sealant Market Revenue by Application (USD Million), 2017-2025
258. France Sealant Market Volume by Technology (Kilo Tons), 2017-2025
259. France Sealant Market Revenue by Technology (USD million), 2017-2025
260. France Sealant Market Volume by Product (Kilo Tons), 2017-2025
261. France Sealant Market Revenue by Product (USD Million), 2017-2025
262. France Sealant Market Volume by Application (Kilo Tons), 2017-2025
263. France Sealant Market Revenue by Application (USD Million), 2017-2025
264. UK Sealant Market Volume by Technology (Kilo Tons), 2017-2025
265. UK Sealant Market Revenue by Technology (USD million), 2017-2025
266. UK Sealant Market Volume by Product (Kilo Tons), 2017-2025
267. UK Sealant Market Revenue by Product (USD Million), 2017-2025
268. UK Sealant Market Volume by Application (Kilo Tons), 2017-2025
269. UK Sealant Market Revenue by Application (USD Million), 2017-2025
270. Italy Sealant Market Volume by Technology (Kilo Tons), 2017-2025
271. Italy Sealant Market Revenue by Technology (USD million), 2017-2025
272. Italy Sealant Market Volume by Product (Kilo Tons), 2017-2025
273. Italy Sealant Market Revenue by Product (USD Million), 2017-2025
274. Italy Sealant Market Volume by Application (Kilo Tons), 2017-2025
275. Italy Sealant Market Revenue by Application (USD Million), 2017-2025
276. Russia Sealant Market Volume by Technology (Kilo Tons), 2017-2025
277. Russia Sealant Market Revenue by Technology (USD million), 2017-2025
278. Russia Sealant Market Volume by Product (Kilo Tons), 2017-2025
279. Russia Sealant Market Revenue by Product (USD Million), 2017-2025
280. Russia Sealant Market Volume by Application (Kilo Tons), 2017-2025
281. Rest of Europe Sealant Market Revenue by Application (USD Million), 2017-2025
282. Rest of Europe Sealant Market Volume by Technology (Kilo Tons), 2017-2025
283. Rest of Europe Sealant Market Revenue by Technology (USD million), 2017-2025
284. Rest of Europe Sealant Market Volume by Product (Kilo Tons), 2017-2025
285. Rest of Europe Sealant Market Revenue by Product (USD Million), 2017-2025
286. Rest of Europe Sealant Market Volume by Application (Kilo Tons), 2017-2025
287. Rest of Europe Sealant Market Revenue by Application (USD Million), 2017-2025
288. Asia Pacific Sealant Market Volume by Technology (Kilo Tons), 2017-2025
289. Asia Pacific Sealant Market Revenue by Technology (USD Million), 2017-2025
290. Asia Pacific Sealant Market Volume by Product (Kilo Tons), 2017-2025
291. Asia Pacific Sealant Market Revenue by Product (USD million), 2017-2025
292. Asia Pacific Sealant Market Volume by Application (Kilo Tons), 2017-2025
293. Asia Pacific Sealant Market Revenue by Application (USD Million), 2017-2025
294. Japan Sealant Market Volume by Technology (Kilo Tons), 2017-2025
295. Japan Sealant Market Revenue by Technology (USD Million), 2017-2025
296. Japan Sealant Market Volume by Product (Kilo Tons), 2017-2025
297. Japan Sealant Market Revenue by Product (USD million), 2017-2025
298. Japan Sealant Market Volume by Application (Kilo Tons), 2017-2025
299. Japan Sealant Market Revenue by Application (USD Million), 2017-2025
300. India Sealant Market Volume by Technology (Kilo Tons), 2017-2025
301. India Sealant Market Revenue by Technology (USD Million), 2017-2025
302. India Sealant Market Volume by Product (Kilo Tons), 2017-2025
303. India Sealant Market Revenue by Product (USD million), 2017-2025
304. India Sealant Market Volume by Application (Kilo Tons), 2017-2025
305. India Sealant Market Revenue by Application (USD Million), 2017-2025
306. China Sealant Market Volume by Technology (Kilo Tons), 2017-2025
307. China Sealant Market Revenue by Technology (USD Million), 2017-2025
308. China Sealant Market Volume by Product (Kilo Tons), 2017-2025
309. China Sealant Market Revenue by Product (USD million), 2017-2025
310. China Sealant Market Volume by Application (Kilo Tons), 2017-2025
311. China Sealant Market Revenue by Application (USD Million), 2017-2025
312. South Korea Sealant Market Volume by Technology (Kilo Tons), 2017-2025
313. South Korea Sealant Market Revenue by Technology (USD Million), 2017-2025
314. South Korea Sealant Market Volume by Product (Kilo Tons), 2017-2025
315. South Korea Sealant Market Revenue by Product (USD million), 2017-2025
316. South Korea Sealant Market Volume by Application (Kilo Tons), 2017-2025
317. South Korea Sealant Market Revenue by Application (USD Million), 2017-2025
318. Taiwan Sealant Market Volume by Technology (Kilo Tons), 2017-2025
319. Taiwan Sealant Market Revenue by Technology (USD Million), 2017-2025
320. Taiwan Sealant Market Volume by Product (Kilo Tons), 2017-2025
321. Taiwan Sealant Market Revenue by Product (USD million), 2017-2025
322. Taiwan Sealant Market Volume by Application (Kilo Tons), 2017-2025
323. Taiwan Sealant Market Revenue by Application (USD Million), 2017-2025
324. Thailand Sealant Market Volume by Technology (Kilo Tons), 2017-2025
325. Thailand Sealant Market Revenue by Technology (USD Million), 2017-2025
326. Thailand Sealant Market Volume by Product (Kilo Tons), 2017-2025
327. Thailand Sealant Market Revenue by Product (USD million), 2017-2025
328. Thailand Sealant Market Volume by Application (Kilo Tons), 2017-2025
329. Thailand Sealant Market Revenue by Application (USD Million), 2017-2025
330. Rest of Asia Sealant Market Volume by Technology (Kilo Tons), 2017-2025
331. Rest of Asia Sealant Market Revenue by Technology (USD Million), 2017-2025
332. Rest of Asia Sealant Market Volume by Product (Kilo Tons), 2017-2025
333. Rest of Asia Sealant Market Revenue by Product (USD million), 2017-2025
334. Rest of Asia Sealant Market Volume by Application (Kilo Tons), 2017-2025
335. Rest of Asia Sealant Market Revenue by Application (USD Million), 2017-2025
336. Rest of the World Sealant Market Volume by Technology (Kilo Tons), 2017-2025
337. Rest of the World Sealant Market Revenue by Technology (USD Million), 2017-2025
338. Rest of the World Sealant Market Volume by Product (Kilo Tons), 2017-2025
339. Rest of the World Sealant Market Revenue by Product (USD million), 2017-2025
340. Rest of the World Sealant Market Volume by Application (Kilo Tons), 2017-2025
341. Rest of the World Sealant Market Revenue by Application (USD Million), 2017-2025
342. Brazil Sealant Market Volume by Technology (Kilo Tons), 2017-2025
343. Brazil Sealant Market Revenue by Technology (USD Million), 2017-2025
344. Brazil Sealant Market Volume by Product (Kilo Tons), 2017-2025
345. Brazil Sealant Market Revenue by Product (USD million), 2017-2025
346. Brazil Sealant Market Volume by Application (Kilo Tons), 2017-2025
347. Brazil Sealant Market Revenue by Application (USD Million), 2017-2025
348. Turkey Sealant Market Volume by Technology (Kilo Tons), 2017-2025
349. Turkey Sealant Market Revenue by Technology (USD Million), 2017-2025
350. Turkey Sealant Market Volume by Product (Kilo Tons), 2017-2025
351. Turkey Sealant Market Revenue by Product (USD million), 2017-2025
352. Turkey Sealant Market Volume by Application (Kilo Tons), 2017-2025
353. Turkey Sealant Market Revenue by Application (USD Million), 2017-2025
354. Saudi Arabia Sealant Market Volume by Technology (Kilo Tons), 2017-2025
355. Saudi Arabia Sealant Market Revenue by Technology (USD Million), 2017-2025
356. Saudi Arabia Sealant Market Volume by Product (Kilo Tons), 2017-2025
357. Saudi Arabia Sealant Market Revenue by Product (USD million), 2017-2025
358. Saudi Arabia Sealant Market Volume by Application (Kilo Tons), 2017-2025
359. Saudi Arabia Sealant Market Revenue by Application (USD Million), 2017-2025
360. Saudi Africa Sealant Market Volume by Technology (Kilo Tons), 2017-2025
361. Saudi Africa Sealant Market Revenue by Technology (USD Million), 2017-2025
362. Saudi Africa Sealant Market Volume by Product (Kilo Tons), 2017-2025
363. Saudi Africa Sealant Market Revenue by Product (USD million), 2017-2025
364. Saudi Africa Sealant Market Volume by Application (Kilo Tons), 2017-2025
365. Saudi Africa Sealant Market Revenue by Application (USD Million), 2017-2025
366. United Arab Emirates Sealant Market Volume by Technology (Kilo Tons), 2017-2025
367. United Arab Emirates Sealant Market Revenue by Technology (USD Million), 2017-2025
368. United Arab Emirates Sealant Market Volume by Product (Kilo Tons), 2017-2025
369. United Arab Emirates Sealant Market Revenue by Product (USD million), 2017-2025
370. United Arab Emirates Sealant Market Volume by Application (Kilo Tons), 2017-2025
List of Figures
1. Adhesive & Sealant – Industry Overview
2. Adhesive & Sealant Market Segmentation
3. Adhesive & Sealant Market (Volume & Revenue), 2017-2025
4. Adhesive & Sealant Market Dynamics
5. Adhesive & Sealant Company Market Share Analysis, 2017
6. Adhesive & Sealant PESTEL Analysis, 2017
7. Adhesive Market Volume Share by Technology, 2012 & 2021
8. Water-Based Adhesive Market (Volume & Revenue), 2017-2025
9. Solvent-Based Adhesive Market (Volume & Revenue), 2017-2025
10. Hot Melt Adhesive Market (Volume & Revenue), 2017-2025
11. Reactive Adhesive Market (Volume & Revenue), 2017-2025
12. Adhesive Market Volume Share by Product, 2017 & 2025
13. Acrylic Adhesive Market (Volume & Revenue), 2017-2025
14. PVA Adhesive Market (Volume & Revenue), 2017-2025
15. Polyurethane Adhesive Market (Volume & Revenue), 2017-2025
16. Styrenic Adhesive Market (Volume & Revenue), 2017-2025
17. Epoxy Adhesive Market (Volume & Revenue), 2017-2025
18. EVA Adhesive Market (Volume & Revenue), 2017-2025
19. Other Adhesive Market (Volume & Revenue), 2017-2025
20. Adhesive Market Volume Share by Application, 2017 & 2025
21. Adhesive Market for Pressure Sensitive Applications (Volume & Revenue), 2017-2025
22. Adhesive Market for Packaging (Volume & Revenue), 2017-2025
23. Adhesive Market for Construction (Volume & Revenue), 2017-2025
24. Adhesive Market for Furniture (Volume & Revenue), 2017-2025
25. Adhesive Market for Footwear (Volume & Revenue), 2017-2025
26. Adhesive Market for Automotive (Volume & Revenue), 2017-2025
27. Adhesive Market for Other Application (Volume & Revenue), 2017-2025
28. Adhesive Market Volume Share by Region, 2017 & 2025
29. North America Adhesive Market Volume & Revenue (Kilo Tons), (USD million) 2017-2025
30. United States Adhesive Market Volume & Revenue (Kilo Tons), (USD million) 2017-2025
31. Canada Adhesive Market Volume & Revenue (Kilo Tons), (USD million) 2017-2025
32. Mexico Adhesive Market Volume & Revenue (Kilo Tons), (USD million) 2017-2025
33. Europe Adhesive Market Volume & Revenue (Kilo Tons), (USD million) 2017-2025
34. Germany Adhesive Market Volume & Revenue (Kilo Tons), (USD million) 2017-2025
35. France Adhesive Market Volume & Revenue (Kilo Tons), (USD million) 2017-2025
36. UK Adhesive Market Volume & Revenue (Kilo Tons), (USD million) 2017-2025
37. Italy Adhesive Market Volume & Revenue (Kilo Tons), (USD million) 2017-2025
38. Russia Adhesive Market Volume & Revenue (Kilo Tons), (USD million) 2017-2025
39. Rest of the Europe Adhesive Market Volume & Revenue (Kilo Tons), (USD million) 2017-2025
40. Asia Pacific Adhesive Market Volume & Revenue (Kilo Tons), (USD million) 2017-2025
41. Japan Adhesive Market Volume & Revenue (Kilo Tons), (USD million) 2017-2025
42. India Adhesive Market Volume & Revenue (Kilo Tons), (USD million) 2017-2025
43. China Adhesive Market Volume & Revenue (Kilo Tons), (USD million) 2017-2025
44. South Korea Adhesive Market Volume & Revenue (Kilo Tons), (USD million) 2017-2025
45. Taiwan Adhesive Market Volume & Revenue (Kilo Tons), (USD million) 2017-2025
46. Thailand Adhesive Market Volume & Revenue (Kilo Tons), (USD million) 2017-2025
47. Rest of Asia pacific Adhesive Market Volume & Revenue (Kilo Tons), (USD million) 2017-2025
48. Rest of the World Adhesive Market Volume & Revenue (Kilo Tons), (USD million) 2017-2025
49. Brazil Adhesive Market Volume & Revenue (Kilo Tons), (USD million) 2017-2025
50. Turkey Adhesive Market Volume & Revenue (Kilo Tons), (USD million) 2017-2025
51. Saudi Arabia Adhesive Market Volume & Revenue (Kilo Tons), (USD million) 2017-2025
52. South Africa Adhesive Market Volume & Revenue (Kilo Tons), (USD million) 2017-2025
53. United Arab Emirates Adhesive Market Volume & Revenue (Kilo Tons), (USD million) 2017-2025
54. Sealants Market Volume Share by Product, 2012 & 2021
55. Silicone Sealants Market (Volume & Revenue), 2017-2025
56. Polyurethane Sealants Market (Volume & Revenue), 2017-2025
57. Acrylic Sealants Market (Volume & Revenue), 2017-2025
58. PVA Sealants Market (Volume & Revenue), 2017-2025
59. Other Sealants Market (Volume & Revenue), 2017-2025
60. Sealants Market Volume Share by Application, 2012 & 2021
61. Sealants Market for Construction (Volume & Revenue), 2017-2025
62. Sealants Market for Automotive (Volume & Revenue), 2017-2025
63. Sealants Market for Packaging (Volume & Revenue), 2017-2025
64. Sealants Market for Assembly (Volume & Revenue), 2017-2025
65. Sealants Market for Pressure Sensitive Tapes (Volume & Revenue), 2017-2025
66. Sealants Market for Consumer Application (Volume & Revenue), 2017-2025
67. Sealants Market for Other Application (Volume & Revenue), 2017-2025
68. Sealants Market Volume Share by Region, 2012 & 2021
69. North America Sealants Market Volume & Revenue (Kilo Tons), (USD million) 2017-2025
70. United States Sealants Market Volume & Revenue (Kilo Tons), (USD million) 2017-2025
71. Canada Sealants Market Volume & Revenue (Kilo Tons), (USD million) 2017-2025
72. Mexico Sealants Market Volume & Revenue (Kilo Tons), (USD million) 2017-2025
73. Europe Sealants Market Volume & Revenue (Kilo Tons), (USD million) 2017-2025
74. Germany Sealants Market Volume & Revenue (Kilo Tons), (USD million) 2017-2025
75. France Sealants Market Volume & Revenue (Kilo Tons), (USD million) 2017-2025
76. UK Sealants Market Volume & Revenue (Kilo Tons), (USD million) 2017-2025
77. Italy Sealants Market Volume & Revenue (Kilo Tons), (USD million) 2017-2025
78. Russia Sealants Market Volume & Revenue (Kilo Tons), (USD million) 2017-2025
79. Rest of the Europe Sealants Market Volume & Revenue (Kilo Tons), (USD million) 2017-2025
80. Asia Pacific Sealants Market Volume & Revenue (Kilo Tons), (USD million) 2017-2025
81. Japan Sealants Market Volume & Revenue (Kilo Tons), (USD million) 2017-2025
82. India Sealants Market Volume & Revenue (Kilo Tons), (USD million) 2017-2025
83. China Sealants Market Volume & Revenue (Kilo Tons), (USD million) 2017-2025
84. South Korea Sealants Market Volume & Revenue (Kilo Tons), (USD million) 2017-2025
85. Taiwan Sealants Market Volume & Revenue (Kilo Tons), (USD million) 2017-2025
86. Thailand Sealants Market Volume & Revenue (Kilo Tons), (USD million) 2017-2025
87. Rest of Asia pacific Sealants Market Volume & Revenue (Kilo Tons), (USD million) 2017-2025
88. Rest of the World Sealants Market Volume & Revenue (Kilo Tons), (USD million) 2017-2025
89. Brazil Sealants Market Volume & Revenue (Kilo Tons), (USD million) 2017-2025
90. Turkey Sealants Market Volume & Revenue (Kilo Tons), (USD million) 2017-2025
91. Saudi Arabia Sealants Market Volume & Revenue (Kilo Tons), (USD million) 2017-2025
92. South Africa Sealants Market Volume & Revenue (Kilo Tons), (USD million) 2017-2025
93. United Arab Emirates Sealants Volume & Revenue (Kilo Tons), (USD million) 2017-2025
Research Methodology
We use both primary as well as secondary research for our market surveys, estimates and for developing forecast. Our research process commence by analyzing the problem which enable us to design the scope for our research study. Our research process is uniquely designed with enough flexibility to adjust according to changing nature of products and markets, while retaining core element to ensure reliability and accuracy in research findings. We understand both macro and micro-economic factors to evaluate and forecast different market segments.
Data Mining
Data is extensively collected through various secondary sources such as annual reports, investor presentations, SEC filings, and other corporate publications. We also refer trade magazines, technical journals, paid databases such as Factiva and Bloomberg, industry trade journals, scientific journals, and social media data to understand market dynamics and industry trends. Further, we also conduct primary research to understand market drivers, restraints, opportunities, challenges, and competitive scenario to build our analysis.
Data Collection Matrix
|
Data Collection Matrix |
Supply Side |
Demand Side |
|
Primary Data Sources |
|
|
|
Secondary Data Sources |
|
|
Market Modeling and Forecasting
We use epidemiology and capital equipment-based models to forecast market size of different segments at country and regional level.
- Epidemiology-based Forecasting Model: This method uses epidemiology data gathered through various publications and from physicians to estimate population of patients, flow of treatment of individual disease and therapies. The data collected through this method includes statics on incidence of disease, population suffering from disease, and treatment population. This method is used to understand:
- Number of patients for particular device or medical procedure and
- Repeated use of particular device depending on health and condition of patient
- Capital-based Forecasting Model: This method of forecasting is based on number of replacements, installed-based and new sales of capital equipment used in various healthcare and diagnostic centers. These three parameters are calculated and forecast is developed. Installation base is calculated as average number of units per facility; while sales for particular year is calculated from number of new and replace units. Secondary data is collected through various supply chain intermediaries and opinion leaders to arrive at installation and sales rate. These techniques help our analysts in validating market and developed market estimates and forecast.
We do forecast on basis of several parameters such as market drivers, market opportunities, industry trends government regulations, raw materials supply and trade dynamics to ensure relevance of forecast with market scenario. With increasing need to granulized information, we used bottom-up methodology for forecasting where we evaluate each regional segment differently and combined all forecast to develop final market forecast.
Data Validation
We believe primary research is a very important tool in analyzing and forecasting different markets. In order to make sure accuracy of our findings, our team conducts primary interviews at every stage of research to gain deep insights into current business environment and future trends and key developments in market. This includes use of various methods such as telephonic interviews, focus groups, face to face interviews and questionnaires to validate our research from all aspects. We validate our data through primary research from key industry leaders such as CEO, product managers, marketing managers, suppliers, distributors, and consumers are frequently interviewed. These interviews provide valuable insights which help us to have better market understanding besides validating our estimates and forecast.
Data Triangulation
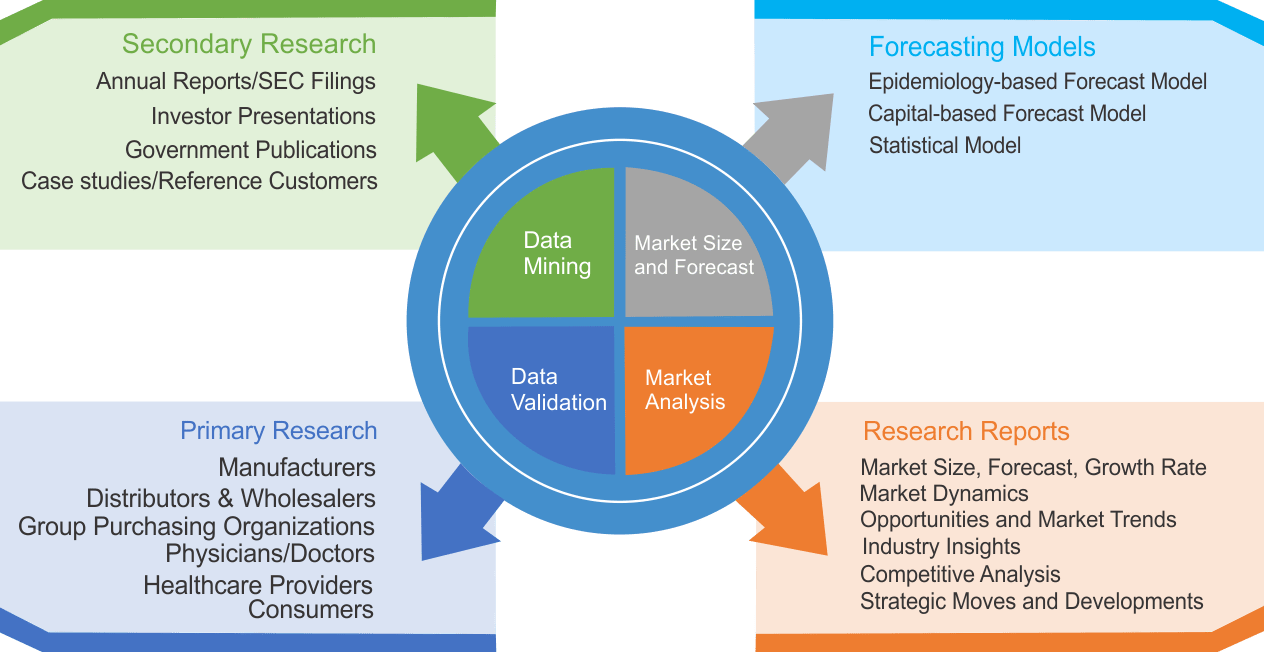
Industry Analysis
|
Qualitative Data |
Quantitative Data (2017-2025) |
|
|