Medical Device Outsourcing Market by Application and Service - Global Industry Analysis and Forecast to 2022
Published On : November 2017 Pages : 105 Category: Medical Devices Report Code : HC11349
Industry Outlook and Trend Analysis
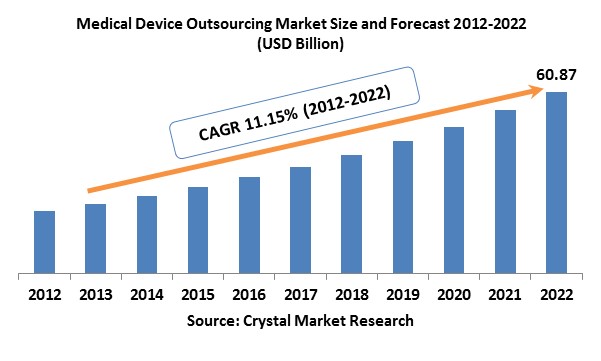
The Medical Device Outsourcing Market was worth USD 21.15 billion in the year 2017 and is expected to reach approximately USD 60.87 billion by 2022, while registering itself at a compound annual growth rate (CAGR) of 11.15% during the forecast period. Growing competition among producers prompting improvement of products at lesser price is one of the major elements ascribing towards development over the estimate time frame. Moreover, developing complication in the designing of products combined with expanding number of participant manufacturers are anticipated to impel the medical device outsourcing industry with advantageous opportunities for development. Growing aged populace is anticipated to build interest for medicinal devices and supplies shaping an expansive client base with restricted health resources, in this manner pushing makers towards subcontracting of exercises, for example, packaging, assembling, and others. For example, new participants of the business are foreseen to outsource designing of device keeping in mind the end goal to be innovatively refreshed and meet the requests of the patients over the gauge time frame. Moreover, accentuation by administrative bodies to keep up the quality of medical devices given to the general population is quickly getting to be noticeably stringent and unwieldy to deal with. Keeping in mind the end goal to battle the circumstance, administrations, for example, administrative consulting is being profited by market players.
Application Outlook and Trend Analysis
In terms of application, the medical device outsourcing industry is sectioned into Class I, Class II and Class III devices. These class have been additionally represented in terms of therapeutics in the report. For example, the share of the overall industry for cardiology gadget in light of application has been given in the report. Usually, Class II devices are anticipated to account for the dominant part of the share with around 48.4 percent. Greatest number of medical device comes into this classification including surgical drapes, infusion pumps, X-ray machine, and wheelchairs. Rising number of surgical methodology and complications of device designing are high effect rendering driver for this development. Class II is outsourced for clinical and advisory services, sales and marketing, designing, after sales services, and manufacturing. Benefits, for example, accelerated time to market, concentration on core competency and cost efficiency are foreseen to be the fundamental effect rendering drivers, advancing higher subcontracting by makers of these devices.
Service Outlook and Trend Analysis
Fundamental services offered by the medical device outsourcing market incorporate; product upgrade and product maintenance, product design and development, product implementation, regulatory consulting and product testing. Administrative counseling services are probably going to encounter expanding request over the conjecture time frame attributable to rising consciousness of convenient recording and reviewing of the administrative documents. The product development and design fragment is relied upon to witness lucrative development over the estimate time frame and it represented more than 15 percent of the share in 2017.
Therapeutic Outlook and Trend analysis
Fundamental therapeutic segments catered to incorporate; drug delivery, endoscopy, orthopedic, In-Vitro Diagnostic (IVD), dental, cardiology, general and plastic surgery, diagnostic imaging, cardiology and diabetes and ophthalmic care. Cardiology section is anticipated to witness advantageous development over the gauge time frame because of expanded frequencies of related conditions. General and plastic surgery fragment is foreseen encounter significant development throughout the following years. Rising number of injuries caused to joints, bones and tissues, and increasing frequencies of chronic conditions are sure effect rendering drivers foreseen to boost the development.
Regional Outlook and Trend Analysis
Asia Pacific rules the medical device outsourcing industry and held more than 40 percent of the income share in 2017. This income depends on destination country stressing the rising activity of outsourcing in the Asia Pacific. Nonetheless, regarding source country, North America rules the market. This is credited to the solid production hubs for high-end, complex, and reliable medical devices. Thusly, Original Equipment Manufacturers (OEMs) are progressively moving towards electronics manufacturing service providers to effectively deal with expanding volume of electronic content in the present products.
Competitive Insights
Major players in the market are Omnica Corporation, Accellent Inc, DAIICHI JITSUGYO CO LTD, Kinetics Climax Inc, Cirtec Medical, Infinity Molding & Assembly Inc, Wipro GE Healthcare Pvt Ltd, ProMed Molded Products Inc, Mitutoyo, NSF International, Micro Systems Engineering GmbH and Shandong Weigao Co. Various organizations are anticipated to enter this market over the estimate time frame due to the rising interest for these devices over the globe. This is relied upon to increase the level of competition throughout the following years. Besides, coordinated efforts between existing players and specialty service offerings to improve quality and competency may likewise be anticipated to happen over the figure time frame. The built up players of the medical device outsourcing industry are expected to extend their portfolio and give one-stop shop alternatives to battle the forceful rivalry over the conjecture time frame. For example, in 2017, Cirtec Medical declared its development by opening of another assembling office in Enfield, Conn.
The global Medical Devices Outsourcing market is segmented as follows-
By Application:
- Class I
- Class II
- Class III
By Service:
- Product Design and Development Services
- Molding
- Designing & engineering
- Packaging
- Machining
- Product Implementation Services
- Product Maintenance Services
- Product Testing & Sterilization Services
- Product Upgrade Services
- Regulatory Consulting Services
- Legal representation
- Clinical trials applications and product registrations
- Regulatory writing and publishing
- Others
- Contract Manufacturing
- Component manufacturing
- Accessories manufacturing
- Device manufacturing
- Assembly manufacturing
By Therapeutics:
- Diagnostic imaging
- IVD
- General and plastic surgery
- Dental
- Diabetes care
- Cardiology
- Orthopedic
- Ophthalmic
- Drug delivery
- Endoscopy
- Others
By Region
- North America
- U.S
- Canada
- Mexico
- Europe
- Germany
- France
- UK
- Italy
- Spain
- Rest of Europe
- Asia-Pacific
- Japan
- China
- Australia
- India
- South Korea
- Rest of Asia Pacific
- Rest of the World
- Brazil
- South Africa
- Saudi Arabia
- United Arab Emirates
- Others
Some of the key questions answered by the report are:
- What was the market size in 2017 and forecast from 2017 to 2022?
- What will be the industry market growth from 2017 to 2022?
- What are the major drivers, restraints, opportunities, challenges, and industry trends and their impact on the market forecast?
- What are the major segments leading the market growth and why?
- Which are the leading players in the market and what are the major strategies adopted by them to sustain the market competition?
Market Classification
- Medical Device Outsourcing Market, By Application, Estimates and Forecast, 2012-2022 ($Million)
- Class I
- Class II
- Class III
- Medical Device Outsourcing Market, By Service, Estimates and Forecast, 2012-2022 ($Million)
- Regulatory Consulting Services
- Regulatory Writing and Publishing
- Clinical Trials Applications and Product Registrations
- Legal Representation
- Other Regulatory Consulting Services
-
- Product Testing & Sterilization Services
- Product Upgrade Services
- Product Implementation Services
- Product Maintenance Services
- Product Design and Development Services
- Machining
- Designing & Engineering
- Packaging
- Molding
-
- Contract Manufacturing
- Assembly Manufacturing
- Accessories Manufacturing
- Device Manufacturing
- Component Manufacturing
- Contract Manufacturing
- Medical Device Outsourcing Market, By Region, Estimates and Forecast, 2012-2022 ($Million)
- North America
- North America Medical Device Outsourcing Market, By Country
- North America Medical Device Outsourcing Market, By Application
- North America Medical Device Outsourcing Market, By Service
- U.S. Medical Device Outsourcing Market, By Application
- U.S. Medical Device Outsourcing Market, By Service
- Canada Medical Device Outsourcing Market, By Application
- Canada Medical Device Outsourcing Market, By Service
- Mexico Medical Device Outsourcing Market, By Application
- Mexico Medical Device Outsourcing Market, By Service
-
- Europe
- Europe Medical Device Outsourcing Market, By Country
- Europe Medical Device Outsourcing Market, By Application
- Europe Medical Device Outsourcing Market, By Service
- Germany Medical Device Outsourcing Market, By Application
- Germany Medical Device Outsourcing Market, By Service
- France Medical Device Outsourcing Market, By Application
- France Medical Device Outsourcing Market, By Service
- UK Medical Device Outsourcing Market, By Application
- UK Medical Device Outsourcing Market, By Service
- Italy Medical Device Outsourcing Market, By Application
- Italy Medical Device Outsourcing Market, By Service
- Spain Medical Device Outsourcing Market, By Application
- Spain Medical Device Outsourcing Market, By Service
- Rest of Europe Medical Device Outsourcing Market, By Application
- Rest of Europe Medical Device Outsourcing Market, By Service
-
- Asia-Pacific
- Asia-Pacific Medical Device Outsourcing Market, By Country
- Asia-Pacific Medical Device Outsourcing Market, By Application
- Asia-Pacific Medical Device Outsourcing Market, By Service
- Japan Medical Device Outsourcing Market, By Application
- Japan Medical Device Outsourcing Market, By Service
- Australia Medical Device Outsourcing Market, By Application
- Australia Medical Device Outsourcing Market, By Service
- India Medical Device Outsourcing Market, By Application
- India Medical Device Outsourcing Market, By Service
- South Korea Medical Device Outsourcing Market, By Application
- South Korea Medical Device Outsourcing Market, By Service
- Rest of Asia-Pacific Medical Device Outsourcing Market, By Application
- Rest of Asia-Pacific Medical Device Outsourcing Market, By Service
- Asia-Pacific
-
- Rest of the World
- Rest of the World Medical Device Outsourcing Market, By Country
- Rest of the World Medical Device Outsourcing Market, By Application
- Rest of the World Medical Device Outsourcing Market, By Service
- Brazil Medical Device Outsourcing Market, By Application
- Brazil Medical Device Outsourcing Market, By Service
- South Africa Medical Device Outsourcing Market, By Application
- South Africa Medical Device Outsourcing Market, By Service
- Saudi Arabia Medical Device Outsourcing Market, By Application
- Saudi Arabia Medical Device Outsourcing Market, By Service
- Turkey Medical Device Outsourcing Market, By Application
- Turkey Medical Device Outsourcing Market, By Service
- United Arab Emirates Medical Device Outsourcing Market, By Application
- United Arab Emirates Medical Device Outsourcing Market, By Service
- Others Medical Device Outsourcing Market, By Application
- Others Medical Device Outsourcing Market, By Service
- Rest of the World
Table of Contents
1. Introduction
1.1. Report Description
1.2. Research Methodology
1.2.1. Secondary Research
1.2.2. Primary Research
2. Executive Summary
2.1. Key Highlights
3. Market Overview
3.1. Introduction
3.1.1. Market Definition
3.1.2. Market Segmentation
3.2. Market Dynamics
3.2.1. Drivers
3.2.2. Restraints
3.2.3. Opportunities
4. Medical Device Outsourcing Market, By Application
4.1. Introduction
4.2. Medical Device Outsourcing Market Assessment and Forecast, By Application, 2012-2022
4.3. Class I
4.3.1. Market Assessment and Forecast, By Region, 2012-2022 ($Million)
4.4. Class II
4.4.1. Market Assessment and Forecast, By Region, 2012-2022 ($Million)
4.5. Class III
4.5.1. Market Assessment and Forecast, By Region, 2012-2022 ($Million)
5. Medical Device Outsourcing Market, By Service
5.1. Introduction
5.2. The Medical Device Outsourcing Market Assessment and Forecast, By Service, 2012-2022
5.3. Regulatory Consulting Services
5.3.1. Market Assessment and Forecast, By Type, 2012-2022 ($Million)
5.3.2. Market Assessment and Forecast, By Region, 2012-2022 ($Million)
5.3.3. Regulatory Writing and Publishing
5.3.3.1. Market Assessment and Forecast, By Region, 2012-2022 ($Million)
5.3.4. Clinical Trials Applications and Product Registrations
5.3.4.1. Market Assessment and Forecast, By Region, 2012-2022 ($Million)
5.3.5. Legal Representation
5.3.5.1. Market Assessment and Forecast, By Region, 2012-2022 ($Million)
5.3.6. Other Regulatory Consulting Services
5.3.6.1. Market Assessment and Forecast, By Region, 2012-2022 ($Million)
5.4. Product Testing & Sterilization Services
5.4.1. Market Assessment and Forecast, By Region, 2012-2022 ($Million)
5.5. Product Upgrade Services
5.5.1. Market Assessment and Forecast, By Region, 2012-2022 ($Million)
5.6. Product Implementation Services
5.6.1. Market Assessment and Forecast, By Region, 2012-2022 ($Million)
5.7. Product Maintenance Services
5.7.1. Market Assessment and Forecast, By Region, 2012-2022 ($Million)
5.8. Product Design and Development Services
5.8.1. Market Assessment and Forecast, By Type, 2012-2022 ($Million)
5.8.2. Market Assessment and Forecast, By Region, 2012-2022 ($Million)
5.8.3. Machining
5.8.3.1. Market Assessment and Forecast, By Region, 2012-2022 ($Million)
5.8.4. Designing & Engineering
5.8.4.1. Market Assessment and Forecast, By Region, 2012-2022 ($Million)
5.8.5. Packaging
5.8.5.1. Market Assessment and Forecast, By Region, 2012-2022 ($Million)
5.8.6. Molding
5.8.6.1. Market Assessment and Forecast, By Region, 2012-2022 ($Million)
5.9. Contract Manufacturing
5.9.1. Market Assessment and Forecast, By Type, 2012-2022 ($Million)
5.9.2. Market Assessment and Forecast, By Region, 2012-2022 ($Million)
5.9.3. Assembly Manufacturing
5.9.3.1. Market Assessment and Forecast, By Region, 2012-2022 ($Million)
5.9.4. Accessories Manufacturing
5.9.4.1. Market Assessment and Forecast, By Region, 2012-2022 ($Million)
5.9.5. Device Manufacturing
5.9.5.1. Market Assessment and Forecast, By Region, 2012-2022 ($Million)
5.9.6. Component Manufacturing
5.9.6.1. Market Assessment and Forecast, By Region, 2012-2022 ($Million)
6. Medical Device Outsourcing Market, By Region
6.1. Introduction
6.2. Medical Device Outsourcing Market Assessment and Forecast, By Region, 2012-2022 ($Million)
6.3. North America
6.3.1. Market Assessment and Forecast, By Country, 2012-2022 ($Million)
6.3.2. Market Assessment and Forecast, By Application, 2012-2022 ($Million)
6.3.3. Market Assessment and Forecast, By Service, 2012-2022 ($Million)
6.3.4. U.S.
6.3.4.1. Market Assessment and Forecast, By Application, 2012-2022 ($Million)
6.3.4.2. Market Assessment and Forecast, By Service, 2012-2022 ($Million)
6.3.5. Canada
6.3.5.1. Market Assessment and Forecast, By Application, 2012-2022 ($Million)
6.3.5.2. Market Assessment and Forecast, By Service, 2012-2022 ($Million)
6.3.6. Mexico
6.3.6.1. Market Assessment and Forecast, By Application, 2012-2022 ($Million)
6.3.6.2. Market Assessment and Forecast, By Service, 2012-2022 ($Million)
6.4. Europe
6.4.1. Market Assessment and Forecast, By Country, 2012-2022 ($Million)
6.4.2. Market Assessment and Forecast, By Application, 2012-2022 ($Million)
6.4.3. Market Assessment and Forecast, By Service, 2012-2022 ($Million)
6.4.4. Germany
6.4.4.1. Market Assessment and Forecast, By Application, 2012-2022 ($Million)
6.4.4.2. Market Assessment and Forecast, By Service, 2012-2022 ($Million)
6.4.5. France
6.4.5.1. Market Assessment and Forecast, By Application, 2012-2022 ($Million)
6.4.5.2. Market Assessment and Forecast, By Application, 2012-2022 ($Million)
6.4.6. UK
6.4.6.1. Market Assessment and Forecast, By Application, 2012-2022 ($Million)
6.4.6.2. Market Assessment and Forecast, By Service, 2012-2022 ($Million)
6.4.7. Italy
6.4.7.1. Market Assessment and Forecast, By Application, 2012-2022 ($Million)
6.4.7.2. Market Assessment and Forecast, By Service, 2012-2022 ($Million)
6.4.8. Spain
6.4.8.1. Market Assessment and Forecast, By Application, 2012-2022 ($Million)
6.4.8.2. Market Assessment and Forecast, By Service, 2012-2022 ($Million)
6.4.9. Rest of Europe
6.4.9.1. Market Assessment and Forecast, By Application, 2012-2022 ($Million)
6.4.9.2. Market Assessment and Forecast, By Service, 2012-2022 ($Million)
6.5. Asia-Pacific
6.5.1. Market Assessment and Forecast, By Country, 2012-2022 ($Million)
6.5.2. Market Assessment and Forecast, By Application, 2012-2022 ($Million)
6.5.3. Market Assessment and Forecast, By Service, 2012-2022 ($Million)
6.5.4. Japan
6.5.4.1. Market Assessment and Forecast, By Application, 2012-2022 ($Million)
6.5.4.2. Market Assessment and Forecast, By Service, 2012-2022 ($Million)
6.5.5. China
6.5.5.1. Market Assessment and Forecast, By Application, 2012-2022 ($Million)
6.5.5.2. Market Assessment and Forecast, By Service, 2012-2022 ($Million)
6.5.6. Australia
6.5.6.1. Market Assessment and Forecast, By Application, 2012-2022 ($Million)
6.5.6.2. Market Assessment and Forecast, By Service, 2012-2022 ($Million)
6.5.7. India
6.5.7.1. Market Assessment and Forecast, By Application, 2012-2022 ($Million)
6.5.7.2. Market Assessment and Forecast, By Service, 2012-2022 ($Million)
6.5.8. South Korea
6.5.8.1. Market Assessment and Forecast, By Application, 2012-2022 ($Million)
6.5.8.2. Market Assessment and Forecast, By Service, 2012-2022 ($Million)
6.5.9. Rest of Asia-Pacific
6.5.9.1. Market Assessment and Forecast, By Application, 2012-2022 ($Million)
6.5.9.2. Market Assessment and Forecast, By Service, 2012-2022 ($Million)
6.6. Rest of the World
6.6.1. Market Assessment and Forecast, By Country, 2012-2022 ($Million)
6.6.2. Market Assessment and Forecast, By Application, 2012-2022 ($Million)
6.6.3. Market Assessment and Forecast, By Service, 2012-2022 ($Million)
6.6.4. Brazil
6.6.4.1. Market Assessment and Forecast, By Application, 2012-2022 ($Million)
6.6.4.2. Market Assessment and Forecast, By Service, 2012-2022 ($Million)
6.6.5. Turkey
6.6.5.1. Market Assessment and Forecast, By Application, 2012-2022 ($Million)
6.6.5.2. Market Assessment and Forecast, By Service, 2012-2022 ($Million)
6.6.6. Saudi Arabia
6.6.6.1. Market Assessment and Forecast, By Application, 2012-2022 ($Million)
6.6.6.2. Market Assessment and Forecast, By Service, 2012-2022 ($Million)
6.6.7. South Africa
6.6.7.1. Market Assessment and Forecast, By Application, 2012-2022 ($Million)
6.6.7.2. Market Assessment and Forecast, By Service, 2012-2022 ($Million)
6.6.8. United Arab Emirates
6.6.8.1. Market Assessment and Forecast, By Application, 2012-2022 ($Million)
6.6.8.2. Market Assessment and Forecast, By Service, 2012-2022 ($Million)
6.6.9. Others
6.6.9.1. Market Assessment and Forecast, By Application, 2012-2022 ($Million)
6.6.9.2. Market Assessment and Forecast, By Service, 2012-2022 ($Million)
7. Company Profiles
7.1. Shivna Medical Instruments Co., Ltd.
7.1.1. Business Overview
7.1.2. Application Portfolio
7.1.3. Key Financials
7.1.4. Strategic Developments
7.2. Daiichi Jitsugyo Co., Ltd.
7.2.1. Business Overview
7.2.2. Application Portfolio
7.2.3. Key Financials
7.2.4. Strategic Developments
7.3. Mitutoyo Corporation
7.3.1. Business Overview
7.3.2. Application Portfolio
7.3.3. Strategic Developments
7.4. GE Healthcare
7.4.1. Business Overview
7.4.2. Application Portfolio
7.4.3. Key Financials
7.4.4. Strategic Developments
7.5. Active Implants Corporation LLC
7.5.1. Business Overview
7.5.2. Application Portfolio
7.5.3. Strategic Developments
7.6. Integer Holdings Corporation
7.6.1. Business Overview
7.6.2. Application Portfolio
7.6.3. Strategic Developments
7.7. MDMI Technologies, Inc.
7.7.1. Business Overview
7.7.2. Application Portfolio
7.7.3. Key Financials
7.7.4. Strategic Developments
7.8. Cirtec Medical
7.8.1. Business Overview
7.8.2. Application Portfolio
7.8.3. Strategic Developments
7.9. Micro Systems Engineering GmbH
7.9.1. Business Overview
7.9.2. Application Portfolio
7.9.3. Key Financials
7.9.4. Strategic Developments
7.10. Avail Medical Products Inc.
7.10.1. Business Overview
7.10.2. Application Portfolio
7.10.3. Key Financials
7.10.4. Strategic Developments
7.11. Creganna-Tactx Medical
7.11.1. Business Overview
7.11.2. Application Portfolio
7.11.3. Key Financials
7.11.4. Strategic Developments
7.12. Sterigenics International Inc.
7.12.1. Business Overview
7.12.2. Application Portfolio
7.12.3. Key Financials
7.12.4. Strategic Developments
List of Tables
List of Tables
Table 1.Global Medical Device Outsourcing Market, By Application ($Million), 2012-2022
Table 2.Class I Market, By Region ($Million), 2012-2022
Table 3.Class II Market, By Region ($Million), 2012-2022
Table 4.Class III Market, By Region ($Million), 2012-2022
Table 5.Global Medical Device Outsourcing Market, By Service ($Million), 2012-2022
Table 6.Regulatory Consulting Services Market, By Type ($Million), 2012-2022
Table 7.Regulatory Consulting Services Market, By Region ($Million), 2012-2022
Table 8.Regulatory Writing and Publishing Market, By Region ($Million), 2012-2022
Table 9.Clinical Trials Applications and Product Registrations Market, By Region ($Million), 2012-2022
Table 10.Legal Representation Market, By Region ($Million), 2012-2022
Table 11.Other Regulatory Consulting Services Market, By Region ($Million), 2012-2022
Table 12.Product Testing & Sterilization Services Market, By Region ($Million), 2012-2022
Table 13.Product Upgrade Services Market, By Region ($Million), 2012-2022
Table 14.Product Implementation Services Market, By Region ($Million), 2012-2022
Table 15.Product Maintenance Services Market, By Region ($Million), 2012-2022
Table 16.Product Design and Development Services Market, By Type ($Million), 2012-2022
Table 17.Product Design and Development Services Market, By Region ($Million), 2012-2022
Table 18.Machining Market, By Region ($Million), 2012-2022
Table 19.Designing & Engineering Market, By Region ($Million), 2012-2022
Table 20.Packaging Market, By Region ($Million), 2012-2022
Table 21.Molding Market, By Region ($Million), 2012-2022
Table 22.Contract Manufacturing Market, By Type ($Million), 2012-2022
Table 23.Contract Manufacturing Market, By Region ($Million), 2012-2022
Table 24.Assembly Manufacturing Market, By Region ($Million), 2012-2022
Table 25.Accessories Manufacturing Market, By Region ($Million), 2012-2022
Table 26.Device Manufacturing Market, By Region ($Million), 2012-2022
Table 27.Component Manufacturing Market, By Region ($Million), 2012-2022
Table 28.Medical Device Outsourcing Market, By Region ($Million), 2012-2022
Table 29.North America Medical Device Outsourcing Market, By Country, 2012-2022 ($Million)
Table 30.North America Medical Device Outsourcing Market, By Application, 2012-2022 ($Million)
Table 31.North America Medical Device Outsourcing Market, By Service, 2012-2022 ($Million)
Table 32.U.S. Medical Device Outsourcing Market, by Application, 2012-2022 ($Million)
Table 33.U.S. Medical Device Outsourcing Market, by Service, 2012-2022 ($Million)
Table 34.Canada Medical Device Outsourcing Market, By Application, 2012-2022 ($Million)
Table 35.Canada Medical Device Outsourcing Market, By Service, 2012-2022 ($Million)
Table 36.Mexico Medical Device Outsourcing Market, By Application, 2012-2022 ($Million)
Table 37.Mexico Medical Device Outsourcing Market, By Service, 2012-2022 ($Million)
Table 38.Europe Medical Device Outsourcing Market, By Country, 2012-2022 ($Million)
Table 39.Europe Medical Device Outsourcing Market, By Application, 2012-2022 ($Million)
Table 40.Europe Medical Device Outsourcing Market, By Service, 2012-2022 ($Million)
Table 41.Germany Medical Device Outsourcing Market, By Application, 2012-2022 ($Million)
Table 42.Germany Medical Device Outsourcing Market, By Service, 2012-2022 ($Million)
Table 43.France Medical Device Outsourcing Market, By Application, 2012-2022 ($Million)
Table 44.France Medical Device Outsourcing Market, By Service, 2012-2022 ($Million)
Table 45.UK Medical Device Outsourcing Market, By Application, 2012-2022 ($Million)
Table 46.UK Medical Device Outsourcing Market, By Service, 2012-2022 ($Million)
Table 47.Italy Medical Device Outsourcing Market, By Application, 2012-2022 ($Million)
Table 48.Italy Medical Device Outsourcing Market, By Service, 2012-2022 ($Million)
Table 49.Spain Medical Device Outsourcing Market, By Application, 2012-2022 ($Million)
Table 50.Spain Medical Device Outsourcing Market, By Service, 2012-2022 ($Million)
Table 51.Russia Medical Device Outsourcing Market, By Application, 2012-2022 ($Million)
Table 52.Russia Medical Device Outsourcing Market, By Service, 2012-2022 ($Million)
Table 53.Rest of Europe Medical Device Outsourcing Market, By Application, 2012-2022 ($Million)
Table 54.Rest of Europe Medical Device Outsourcing Market, By Service, 2012-2022 ($Million)
Table 55.Asia-Pacific Medical Device Outsourcing Market, By Country, 2012-2022 ($Million)
Table 56.Asia-Pacific Medical Device Outsourcing Market, By Application, 2012-2022 ($Million)
Table 57.Asia-Pacific Medical Device Outsourcing Market, By Service, 2012-2022 ($Million)
Table 58.Japan Medical Device Outsourcing Market, By Application, 2012-2022 ($Million)
Table 59.Japan Medical Device Outsourcing Market, By Service, 2012-2022 ($Million)
Table 60.China Medical Device Outsourcing Market, By Application, 2012-2022 ($Million)
Table 61.China Medical Device Outsourcing Market, By Service, 2012-2022 ($Million)
Table 62.Australia Medical Device Outsourcing Market, By Application, 2012-2022 ($Million)
Table 63.Australia Medical Device Outsourcing Market, By Service, 2012-2022 ($Million)
Table 64.India Medical Device Outsourcing Market, By Application, 2012-2022 ($Million)
Table 65.India Medical Device Outsourcing Market, By Service, 2012-2022 ($Million)
Table 66.South Korea Medical Device Outsourcing Market, By Application, 2012-2022 ($Million)
Table 67.South Korea Medical Device Outsourcing Market, By Service, 2012-2022 ($Million)
Table 68.Taiwan Medical Device Outsourcing Market, By Application, 2012-2022 ($Million)
Table 69.Taiwan Medical Device Outsourcing Market, By Service, 2012-2022 ($Million)
Table 70.Rest of Asia-Pacific Medical Device Outsourcing Market, By Application, 2012-2022 ($Million)
Table 71.Rest of Asia-Pacific Medical Device Outsourcing Market, By Service, 2012-2022 ($Million)
Table 72.Rest of the World Medical Device Outsourcing Market, By Country, 2012-2022 ($Million)
Table 73.Rest of the World Medical Device Outsourcing Market, By Application, 2012-2022 ($Million)
Table 74.Rest of the World Medical Device Outsourcing Market, By Service, 2012-2022 ($Million)
Table 75.Brazil Medical Device Outsourcing Market, By Application, 2012-2022 ($Million)
Table 76.Brazil Medical Device Outsourcing Market, By Service, 2012-2022 ($Million)
Table 77.Turkey Medical Device Outsourcing Market, By Application, 2012-2022 ($Million)
Table 78.Turkey Medical Device Outsourcing Market, By Service, 2012-2022 ($Million)
Table 79.Saudi Arabia Medical Device Outsourcing Market, By Application, 2012-2022 ($Million)
Table 80.Saudi Arabia Medical Device Outsourcing Market, By Service, 2012-2022 ($Million)
Table 81.South Africa Medical Device Outsourcing Market, By Application, 2012-2022 ($Million)
Table 82.South Africa Medical Device Outsourcing Market, By Service, 2012-2022 ($Million)
Table 83.United Arab Emirates Medical Device Outsourcing Market, By Application, 2012-2022 ($Million)
Table 84.United Arab Emirates Medical Device Outsourcing Market, By Service, 2012-2022 ($Million)
Table 85.Others Medical Device Outsourcing Market, By Application, 2012-2022 ($Million)
Table 86.Others Medical Device Outsourcing Market, By Service, 2012-2022 ($Million)
Table 87.Shivna Medical Instruments Co., Ltd.: Key Strategic Developments, 2017-2017
Table 88.Daiichi Jitsugyo Co., Ltd.: Key Strategic Developments, 2017-2017
Table 89.Mitutoyo Corporation: Key Strategic Developments, 2017-2017
Table 90.GE Healthcare: Key Strategic Developments, 2017-2017
Table 91.Active Implants Corporation LLC: Key Strategic Developments, 2017-2017
Table 92.Integer Holdings Corporation: Key Strategic Developments, 2017-2017
Table 93.MDMI Technologies, Inc.: Key Strategic Developments, 2017-2017
Table 94.Cirtec Medical: Key Strategic Developments, 2017-2017
Table 95.Micro Systems Engineering GmbH: Key Strategic Developments, 2017-2017
Table 96.Avail Medical Products Inc.: Key Strategic Developments, 2017-2017
Table 97.Creganna-Tactx Medical: Key Strategic Developments, 2017-2017
Table 98.Sterigenics International Inc.: Key Strategic Developments, 2017-2017
List of Figures
List of Figures
Figure 1.Global Medical Device Outsourcing Market Share, By Application, 2012 & 2022
Figure 2.Medical Device Outsourcing Market, By Service, 2012 & 2022, ($Million)
Figure 3.Medical Device Outsourcing Market, By Region, 2012 & 2022, ($Million)
Figure 4.Shivna Medical Instruments Co., Ltd.: Net Revenues, 2017-2017 ($Million)
Figure 5.Shivna Medical Instruments Co., Ltd.: Net Revenue Share, By Segment, 2017
Figure 6.Shivna Medical Instruments Co., Ltd.: Net Revenue Share, By Geography, 2017
Figure 7.Daiichi Jitsugyo Co., Ltd.: Net Revenues, 2017-2017 ($Million)
Figure 8.Daiichi Jitsugyo Co., Ltd.: Net Revenue Share, By Segment, 2017
Figure 9.Daiichi Jitsugyo Co., Ltd.: Net Revenue Share, By Geography, 2017
Figure 10.Mitutoyo Corporation: Net Revenues, 2017-2017 ($Million)
Figure 11.Mitutoyo Corporation: Net Revenue Share, By Segment, 2017
Figure 12.Mitutoyo Corporation: Net Revenue Share, By Geography, 2017
Figure 13.GE Healthcare: Net Revenues, 2017-2017 ($Million)
Figure 14.GE Healthcare: Net Revenue Share, By Segment, 2017
Figure 15.GE Healthcare: Net Revenue Share, By Geography, 2017
Figure 16.Active Implants Corporation LLC: Net Revenues, 2017-2017 ($Million)
Figure 17.Active Implants Corporation LLC: Net Revenue Share, By Segment, 2017
Figure 18.Active Implants Corporation LLC: Net Revenue Share, By Geography, 2017
Figure 19.Integer Holdings Corporation: Net Revenues, 2017-2017 ($Million)
Figure 20.Integer Holdings Corporation: Net Revenue Share, By Segment, 2017
Figure 21.Integer Holdings Corporation: Net Revenue Share, By Geography, 2017
Figure 22.Cirtec Medical: Net Revenues, 2017-2017 ($Million)
Figure 23.Cirtec Medical: Net Revenue Share, By Segment, 2017
Figure 24.Cirtec Medical: Net Revenue Share, By Geography, 2017
Figure 25.Micro Systems Engineering GmbH: Net Revenues, 2017-2017 ($Million)
Figure 26.Micro Systems Engineering GmbH: Net Revenue Share, By Segment, 2017
Figure 27.Micro Systems Engineering GmbH: Net Revenue Share, By Geography, 2017
Research Methodology
We use both primary as well as secondary research for our market surveys, estimates and for developing forecast. Our research process commence by analyzing the problem which enable us to design the scope for our research study. Our research process is uniquely designed with enough flexibility to adjust according to changing nature of products and markets, while retaining core element to ensure reliability and accuracy in research findings. We understand both macro and micro-economic factors to evaluate and forecast different market segments.
Data Mining
Data is extensively collected through various secondary sources such as annual reports, investor presentations, SEC filings, and other corporate publications. We also refer trade magazines, technical journals, paid databases such as Factiva and Bloomberg, industry trade journals, scientific journals, and social media data to understand market dynamics and industry trends. Further, we also conduct primary research to understand market drivers, restraints, opportunities, challenges, and competitive scenario to build our analysis.
Data Collection Matrix
|
Data Collection Matrix |
Supply Side |
Demand Side |
|
Primary Data Sources |
|
|
|
Secondary Data Sources |
|
|
Market Modeling and Forecasting
We use epidemiology and capital equipment-based models to forecast market size of different segments at country and regional level.
- Epidemiology-based Forecasting Model: This method uses epidemiology data gathered through various publications and from physicians to estimate population of patients, flow of treatment of individual disease and therapies. The data collected through this method includes statics on incidence of disease, population suffering from disease, and treatment population. This method is used to understand:
- Number of patients for particular device or medical procedure and
- Repeated use of particular device depending on health and condition of patient
- Capital-based Forecasting Model: This method of forecasting is based on number of replacements, installed-based and new sales of capital equipment used in various healthcare and diagnostic centers. These three parameters are calculated and forecast is developed. Installation base is calculated as average number of units per facility; while sales for particular year is calculated from number of new and replace units. Secondary data is collected through various supply chain intermediaries and opinion leaders to arrive at installation and sales rate. These techniques help our analysts in validating market and developed market estimates and forecast.
We do forecast on basis of several parameters such as market drivers, market opportunities, industry trends government regulations, raw materials supply and trade dynamics to ensure relevance of forecast with market scenario. With increasing need to granulized information, we used bottom-up methodology for forecasting where we evaluate each regional segment differently and combined all forecast to develop final market forecast.
Data Validation
We believe primary research is a very important tool in analyzing and forecasting different markets. In order to make sure accuracy of our findings, our team conducts primary interviews at every stage of research to gain deep insights into current business environment and future trends and key developments in market. This includes use of various methods such as telephonic interviews, focus groups, face to face interviews and questionnaires to validate our research from all aspects. We validate our data through primary research from key industry leaders such as CEO, product managers, marketing managers, suppliers, distributors, and consumers are frequently interviewed. These interviews provide valuable insights which help us to have better market understanding besides validating our estimates and forecast.
Data Triangulation

Industry Analysis
|
Qualitative Data |
Quantitative Data (2017-2025) |
|
|