IoT Security Market by Component, Type and Application - Global Industry Analysis and Forecast to 2022
Published On : October 2017 Pages : 135 Category: Telecom & Wireless Report Code : IC10299
Industry Trend Analysis
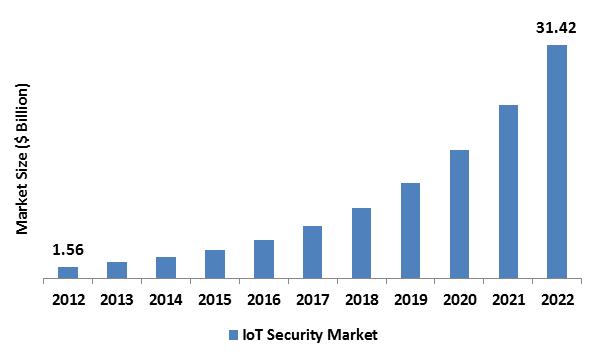
In 2017, the global internet of things (IoT) security market was evaluated around USD 1.56 billion and is expected to reach approximately USD 31.42 billion by 2022 while registering itself at a compound annual growth rate (CAGR) of 31.01% over the forecast period. Internet of Things (IoT) links devices like consumer objects and industrial equipment on to a network, facilitating the accumulation of data and device management via software to augment efficiency as well as allow new services. The IoT combines embedded software, hardware, IT services, and communication services. The Internet of Things has an accession of existing information technology and operational technology (OT) networks of organizations, besides multiple sensors, and devices other smart objects. Growing dependence on the present network connectivity grants rise to challenges involving security risks. The focus and priority of the IT network are to secure information confidentially and protect access, assuring employee and operational safety. Hence, there is an amplified IoT security solutions demand at offices. The organizations like Cisco systems are attempting to develop the approach that merges cyber and physical security elements for employee protection and safety of the total system.
Component Outlook and Trend Analysis
The advent of integrated security solutions is anticipated to boost the growth projection of the global IoT security industry. The IoT security solutions demand will enhance amongst end-users as there is a requirement for rendering total security to devices and networks. As individual IoT security solutions are costly, the majority end-users prefer integrated IoT security solutions. Firewalls and data loss prevention are being incorporated with IoT security solutions which will further fuel the market growth.
Type Outlook and Trend Analysis
According to type, Network security, Endpoint security, Application security and Cloud security could be the major sections of the global IoT security market. Cloud is being utilized for the biometrics data storage. As the majority organizations nowadays are implementing cloud technology for their confidential data storage, there comes up with the requirement of developing security standards to defend the cloud next to unauthorized access. The elevated implementation of services that are based on cloud technology by medium and small scale companies like pay per use model is presenting scalability and flexibility to these companies and this has ensued in an astounding rise in the implementation of cloud-based services for data storage. This is anticipated to generate an increased requirement for IoT security and fuel the market growth worldwide.
Application Outlook and Trend Analysis
Based on application, consumer wearables, connected logistics, smart government and defense, connected vehicles, smart energy and utilities, smart manufacturing, smart retail, and other applications might be the key sections of the global market. Owing to growing smart city projects across various countries, the implementation of IoT applications is increasing considerably. A growing amount of connected devices is projected to boost the demand for global IoT security market.
Regional Outlook and Trend Analysis
North America emerges as the dominating market, in terms of market revenue. The expansion of this region might be assigned to the wide deployment of IoT equipment over various countries and domains and the imposition of regulatory models. For instance, the adoption of laws like Health Insurance Portability and Accountability Act (HIPPA) and Payment Card Industry Data Security Standard (PCI DSS) has been driving the market growth. The Asia Pacific IoT security market in has been rising rapidly, owing to the higher number of business enterprises, the unregulated use of the Internet, and rise in the mobile workforce. The escalating economy, the new national security policies, and social transformation in countries like Singapore, India, and Japan have also been accountable for the development of IoT security market around the region.
Competitive Outlook and Trend Analysis
Intel Corporation, IBM Corporation, Infineon Technologies, Hewlett Packard Development Company L.P., Cisco Systems, Inc., Sophos Group Plc, ARM Holdings, INSIDE Secure SA, Gemalto NV, and Symantec Corporation are some of the key market players in the global IoT security market.
The global internet of things (IoT) security market is segmented as follows –
By Component
- Services
- Professional services
- Support and Maintenance
- Integration Services
- Consulting Services
- Managed services
- Professional services
- Solutions
- Identity access management
- Security analytics
- IDS/IPS
- Device authentication and management
- Secure software and firmware update
- Data encryption and tokenization
- Secure communications
- PKI lifecycle management
- Distributed denial of service protection
- Other Solutions
By Type
- Endpoint security
- Network security
- Cloud security
- Application security
- Other Types
By Application
- Connected Logistics
- Consumer Wearables
- Smart Government and Defense
- Smart Energy and Utilities
- Connected Vehicles
- Smart Retail
- Smart Manufacturing
- Other Applications
By Region
- North America
- U.S
- Canada
- Mexico
- Europe
- Germany
- France
- UK
- Italy
- Spain
- Rest of Europe
- Asia-Pacific
- Japan
- China
- Australia
- India
- South Korea
- Rest of Asia Pacific
- Rest of the World
- Brazil
- South Africa
- Saudi Arabia
- United Arab Emirates
- Others
Some of the key questions answered by the report are:
- What was the market size in 2017 and forecast from 2017 to 2022?
- What will be the industry market growth from 2017 to 2022?
- What are the major drivers, restraints, opportunities, challenges, and industry trends and their impact on the market forecast?
- What are the major segments leading the market growth and why?
- Which are the leading players in the market and what are the major strategies adopted by them to sustain the market competition?
Market Classification
- IoT Security Market, By Component, Estimates and Forecast, 2012-2022 ($Billion)
- Services
- Professional services
- Support and Maintenance
- Integration Services
- Consulting Services
- Managed services
- Solutions
- Identity access management
- Security analytics
- IDS/IPS
- Device authentication and management
- Secure software and firmware update
- Data encryption and tokenization
- Secure communications
- PKI lifecycle management
- Distributed denial of service protection
- Other Solutions
- IoT Security Market, By Type, Estimates and Forecast, 2012-2022 ($Billion)
- Endpoint security
- Network security
- Cloud security
- Application security
- Other Types
- IoT Security Market, By Application, Estimates and Forecast, 2012-2022 ($Billion)
- Connected Logistics
- Consumer Wearables
- Smart Government and Defense
- Smart Energy and Utilities
- Connected Vehicles
- Smart Retail
- Smart Manufacturing
- Other Applications
- IoT Security Market, By Region, Estimates and Forecast, 2012-2022 ($Billion)
- North America
- North America IoT Security Market, By Country
- North America IoT Security Market, By Component
- North America IoT Security Market, By Type
- North America IoT Security Market, By Application
- U.S. IoT Security Market, By Component
- U.S. IoT Security Market, By Type
- U.S. IoT Security Market, By Application
- Canada IoT Security Market, By Component
- Canada IoT Security Market, By Type
- Canada IoT Security Market, By Application
- Mexico IoT Security Market, By Component
- Mexico IoT Security Market, By Type
- Mexico IoT Security Market, By Application
- Europe
- Europe IoT Security Market, By Country
- Europe IoT Security Market, By Component
- Europe IoT Security Market, By Type
- Europe IoT Security Market, By Application
- Germany IoT Security Market, By Component
- Germany IoT Security Market, By Type
- Germany IoT Security Market, By Application
- France IoT Security Market, By Component
- France IoT Security Market, By Type
- France IoT Security Market, By Application
- UK IoT Security Market, By Component
- UK IoT Security Market, By Type
- UK IoT Security Market, By Application
- Italy IoT Security Market, By Component
- Italy IoT Security Market, By Type
- Italy IoT Security Market, By Application
- Spain IoT Security Market, By Component
- Spain IoT Security Market, By Type
- Spain IoT Security Market, By Application
- Rest of Europe IoT Security Market, By Component
- Rest of Europe IoT Security Market, By Type
- Rest of Europe IoT Security Market, By Application
-
- Asia-Pacific
- Asia-Pacific IoT Security Market, By Country
- Asia-Pacific IoT Security Market, By Component
- Asia-Pacific IoT Security Market, By Type
- Asia-Pacific IoT Security Market, By Application
- Japan IoT Security Market, By Component
- Japan IoT Security Market, By Type
- Japan IoT Security Market, By Application
- Australia IoT Security Market, By Component
- Australia IoT Security Market, By Type
- Australia IoT Security Market, By Application
- India IoT Security Market, By Component
- India IoT Security Market, By Type
- India IoT Security Market, By Application
- South Korea IoT Security Market, By Component
- South Korea IoT Security Market, By Type
- South Korea IoT Security Market, By Application
- Rest of Asia-Pacific IoT Security Market, By Component
- Rest of Asia-Pacific IoT Security Market, By Type
- Rest of Asia-Pacific IoT Security Market, By Application
-
- Rest of the World
- Rest of the World IoT Security Market, By Country
- Rest of the World IoT Security Market, By Component
- Rest of the World IoT Security Market, By Type
- Rest of the World IoT Security Market, By Application
- Brazil IoT Security Market, By Component
- Brazil IoT Security Market, By Type
- Brazil IoT Security Market, By Application
- South Africa IoT Security Market, By Component
- South Africa IoT Security Market, By Type
- South Africa IoT Security Market, By Application
- Saudi Arabia IoT Security Market, By Component
- Saudi Arabia IoT Security Market, By Type
- Saudi Arabia IoT Security Market, By Application
- Turkey IoT Security Market, By Component
- Turkey IoT Security Market, By Type
- Turkey IoT Security Market, By Application
- United Arab Emirates IoT Security Market, By Component
- United Arab Emirates IoT Security Market, By Type
- United Arab Emirates IoT Security Market, By Application
- Others IoT Security Market, By Component
- Others IoT Security Market, By Type
- Others IoT Security Market, By Application
- Rest of the World
Table of Contents
1. Introduction
1.1. Report Description
1.2. Research Methodology
1.2.1. Secondary Research
1.2.2. Primary Research
2. Executive Summary
2.1. Key Highlights
3. Market Overview
3.1. Introduction
3.1.1. Market Definition
3.1.2. Market Segmentation
3.2. Market Dynamics
3.2.1. Drivers
3.2.1.1. Growing Need for Data-Centric Security
3.2.1.2. Growing Ransomware Attacks on IoT Systems
3.2.1.3. Growing Risk-Based Adaptive Security for IoT Bionetwork
3.2.2. Restraints
3.2.2.1. High price of IoT Security Innovations
3.2.3. Opportunities
3.2.3.1. Rising Utilizations of Freeware IoT Operating Systems
4. IoT Market, By Component
4.1. Introduction
4.2. IoT Market Assessment and Forecast, By Component, 2012-2022
4.3. Services
4.3.1. Market Assessment and Forecast, By Type, 2012-2022 ($Million)
4.3.2. Market Assessment and Forecast, By Region, 2012-2022 ($Million)
4.3.3. Professional services
4.3.3.1. Market Assessment and Forecast, By Type, 2012-2022 ($Million)
4.3.3.2. Market Assessment and Forecast, By Region, 2012-2022 ($Million)
4.3.3.3. Support and Maintenance
4.3.3.3.1. Market Assessment and Forecast, By Region, 2012-2022 ($Million)
4.3.3.4. Integration Services
4.3.3.4.1. Market Assessment and Forecast, By Region, 2012-2022 ($Million)
4.3.3.5. Consulting Services
4.3.3.5.1. Market Assessment and Forecast, By Region, 2012-2022 ($Million)
4.3.4. Managed services
4.3.4.1. Market Assessment and Forecast, By Region, 2012-2022 ($Million)
4.4. Solutions
4.4.1. Market Assessment and Forecast, By Type, 2012-2022 ($Million)
4.4.2. Market Assessment and Forecast, By Region, 2012-2022 ($Million)
4.4.3. Identity access management
4.4.3.1. Market Assessment and Forecast, By Region, 2012-2022 ($Million)
4.4.4. Security analytics
4.4.4.1. Market Assessment and Forecast, By Region, 2012-2022 ($Million)
4.4.5. IDS/IPS
4.4.5.1. Market Assessment and Forecast, By Region, 2012-2022 ($Million)
4.4.6. Device authentication and management
4.4.6.1. Market Assessment and Forecast, By Region, 2012-2022 ($Million)
4.4.7. Secure software and firmware update
4.4.7.1. Market Assessment and Forecast, By Region, 2012-2022 ($Million)
4.4.8. Data encryption and tokenization
4.4.8.1. Market Assessment and Forecast, By Region, 2012-2022 ($Million)
4.4.9. IDS/IPS
4.4.9.1. Market Assessment and Forecast, By Region, 2012-2022 ($Million)
4.4.10. Secure communications
4.4.10.1. Market Assessment and Forecast, By Region, 2012-2022 ($Million)
4.4.11. PKI lifecycle management
4.4.11.1. Market Assessment and Forecast, By Region, 2012-2022 ($Million)
4.4.12. Distributed denial of service protection
4.4.12.1. Market Assessment and Forecast, By Region, 2012-2022 ($Million)
4.4.13. Other Solutions
4.4.13.1. Market Assessment and Forecast, By Region, 2012-2022 ($Million)
5. IoT Market, By Type
5.1. Introduction
5.2. IoT Market Assessment and Forecast, By Type, 2012-2022
5.3. Endpoint security
5.3.1. Market Assessment and Forecast, By Region, 2012-2022 ($Million)
5.4. Network security
5.4.1. Market Assessment and Forecast, By Region, 2012-2022 ($Million)
5.5. Cloud security
5.5.1. Market Assessment and Forecast, By Region, 2012-2022 ($Million)
5.6. Application security
5.6.1. Market Assessment and Forecast, By Region, 2012-2022 ($Million)
5.7. Other Types
5.7.1. Market Assessment and Forecast, By Region, 2012-2022 ($Million)
6. IoT Market, By Application
6.1. Introduction
6.2. IoT Market Assessment and Forecast, By Application, 2012-2022
6.3. Connected Logistics
6.3.1. Market Assessment and Forecast, By Region, 2012-2022 ($Million)
6.4. Consumer Wearables
6.4.1. Market Assessment and Forecast, By Region, 2012-2022 ($Million)
6.5. Smart Government and Defense
6.5.1. Market Assessment and Forecast, By Region, 2012-2022 ($Million)
6.6. Smart Energy and Utilities
6.6.1. Market Assessment and Forecast, By Region, 2012-2022 ($Million)
6.7. Connected Vehicles
6.7.1. Market Assessment and Forecast, By Region, 2012-2022 ($Million)
6.8. Smart Retail
6.8.1. Market Assessment and Forecast, By Region, 2012-2022 ($Million)
6.9. Smart Manufacturing
6.9.1. Market Assessment and Forecast, By Region, 2012-2022 ($Million)
6.10. Other Applications
6.10.1. Market Assessment and Forecast, By Region, 2012-2022 ($Million)
7. IoT Market, By Region
7.1. Introduction
7.2. IoT Market Assessment and Forecast, By Region, 2012-2022 ($Million)
7.3. North America
7.3.1. Market Assessment and Forecast, By Country, 2012-2022 ($Million)
7.3.2. Market Assessment and Forecast, By Component, 2012-2022 ($Million)
7.3.3. Market Assessment and Forecast, By Type, 2012-2022 ($Million)
7.3.4. Market Assessment and Forecast, By Application, 2012-2022 ($Million)
7.3.5. U.S.
7.3.5.1. Market Assessment and Forecast, By Component, 2012-2022 ($Million)
7.3.5.2. Market Assessment and Forecast, By Type, 2012-2022 ($Million)
7.3.5.3. Market Assessment and Forecast, By Application, 2012-2022 ($Million)
7.3.6. Canada
7.3.6.1. Market Assessment and Forecast, By Component, 2012-2022 ($Million)
7.3.6.2. Market Assessment and Forecast, By Type, 2012-2022 ($Million)
7.3.6.3. Market Assessment and Forecast, By Application, 2012-2022 ($Million)
7.3.7. Mexico
7.3.7.1. Market Assessment and Forecast, By Component, 2012-2022 ($Million)
7.3.7.2. Market Assessment and Forecast, By Type, 2012-2022 ($Million)
7.3.7.3. Market Assessment and Forecast, By Application, 2012-2022 ($Million)
7.4. Europe
7.4.1. Market Assessment and Forecast, By Country, 2012-2022 ($Million)
7.4.2. Market Assessment and Forecast, By Component, 2012-2022 ($Million)
7.4.3. Market Assessment and Forecast, By Type, 2012-2022 ($Million)
7.4.4. Market Assessment and Forecast, By Application, 2012-2022 ($Million)
7.4.5. Germany
7.4.5.1. Market Assessment and Forecast, By Component, 2012-2022 ($Million)
7.4.5.2. Market Assessment and Forecast, By Type, 2012-2022 ($Million)
7.4.5.3. Market Assessment and Forecast, By Application, 2012-2022 ($Million)
7.4.6. France
7.4.6.1. Market Assessment and Forecast, By Component, 2012-2022 ($Million)
7.4.6.2. Market Assessment and Forecast, By Type, 2012-2022 ($Million)
7.4.6.3. Market Assessment and Forecast, By Application, 2012-2022 ($Million)
7.4.7. UK
7.4.7.1. Market Assessment and Forecast, By Component, 2012-2022 ($Million)
7.4.7.2. Market Assessment and Forecast, By Type, 2012-2022 ($Million)
7.4.7.3. Market Assessment and Forecast, By Application, 2012-2022 ($Million)
7.4.8. Italy
7.4.8.1. Market Assessment and Forecast, By Component, 2012-2022 ($Million)
7.4.8.2. Market Assessment and Forecast, By Type, 2012-2022 ($Million)
7.4.8.3. Market Assessment and Forecast, By Application, 2012-2022 ($Million)
7.4.9. Spain
7.4.9.1. Market Assessment and Forecast, By Component, 2012-2022 ($Million)
7.4.9.2. Assessment and Forecast, By Type, 2012-2022 ($Million)
7.4.9.3. Market Assessment and Forecast, By Application, 2012-2022 ($Million)
7.4.10. Russia
7.4.10.1. Market Assessment and Forecast, By Component, 2012-2022 ($Million)
7.4.10.2. Market Assessment and Forecast, By Type, 2012-2022 ($Million)
7.4.10.3. Market Assessment and Forecast, By Application, 2012-2022 ($Million)
7.4.11. Rest of Europe
7.4.11.1. Market Assessment and Forecast, By Component, 2012-2022 ($Million)
7.4.11.2. Assessment and Forecast, By Type, 2012-2022 ($Million)
7.4.11.3. Market Assessment and Forecast, By Application, 2012-2022 ($Million)
7.5. Asia-Pacific
7.5.1. Market Assessment and Forecast, By Country, 2012-2022 ($Million)
7.5.2. Market Assessment and Forecast, By Component, 2012-2022 ($Million)
7.5.3. Market Assessment and Forecast, By Type, 2012-2022 ($Million)
7.5.4. Market Assessment and Forecast, By Application, 2012-2022 ($Million)
7.5.5. Japan
7.5.5.1. Market Assessment and Forecast, By Component, 2012-2022 ($Million)
7.5.5.2. Market Assessment and Forecast, By Type, 2012-2022 ($Million)
7.5.5.3. Market Assessment and Forecast, By Application, 2012-2022 ($Million)
7.5.6. China
7.5.6.1. Market Assessment and Forecast, By Component, 2012-2022 ($Million)
7.5.6.2. Market Assessment and Forecast, By Type, 2012-2022 ($Million)
7.5.6.3. Market Assessment and Forecast, By Application, 2012-2022 ($Million)
7.5.7. Australia
7.5.7.1. Market Assessment and Forecast, By Component, 2012-2022 ($Million)
7.5.7.2. Market Assessment and Forecast, By Type, 2012-2022 ($Million)
7.5.7.3. Market Assessment and Forecast, By Application, 2012-2022 ($Million)
7.5.8. India
7.5.8.1. Market Assessment and Forecast, By Component, 2012-2022 ($Million)
7.5.8.2. Market Assessment and Forecast, By Type, 2012-2022 ($Million)
7.5.8.3. Market Assessment and Forecast, By Application, 2012-2022 ($Million)
7.5.9. South Korea
7.5.9.1. Market Assessment and Forecast, By Component, 2012-2022 ($Million)
7.5.9.2. Market Assessment and Forecast, By Type, 2012-2022 ($Million)
7.5.9.3. Market Assessment and Forecast, By Application, 2012-2022 ($Million)
7.5.10. Taiwan
7.5.10.1. Market Assessment and Forecast, By Component, 2012-2022 ($Million)
7.5.10.2. Market Assessment and Forecast, By Type, 2012-2022 ($Million)
7.5.10.3. Market Assessment and Forecast, By Application, 2012-2022 ($Million)
7.5.11. Rest of Asia-Pacific
7.5.11.1. Market Assessment and Forecast, By Component, 2012-2022 ($Million)
7.5.11.2. Market Assessment and Forecast, By Type, 2012-2022 ($Million)
7.5.11.3. Market Assessment and Forecast, By Application, 2012-2022 ($Million)
7.6. Rest of the World
7.6.1. Market Assessment and Forecast, By Country, 2012-2022 ($Million)
7.6.2. Market Assessment and Forecast, By Component, 2012-2022 ($Million)
7.6.3. Market Assessment and Forecast, By Type, 2012-2022 ($Million)
7.6.4. Market Assessment and Forecast, By Application, 2012-2022 ($Million)
7.6.5. Brazil
7.6.5.1. Market Assessment and Forecast, By Component, 2012-2022 ($Million)
7.6.5.2. Market Assessment and Forecast, By Type, 2012-2022 ($Million)
7.6.5.3. Market Assessment and Forecast, By Application, 2012-2022 ($Million)
7.6.6. Turkey
7.6.6.1. Market Assessment and Forecast, By Component, 2012-2022 ($Million)
7.6.6.2. Market Assessment and Forecast, By Type, 2012-2022 ($Million)
7.6.6.3. Market Assessment and Forecast, By Application, 2012-2022 ($Million)
7.6.7. Saudi Arabia
7.6.7.1. Market Assessment and Forecast, By Component, 2012-2022 ($Million)
7.6.7.2. Market Assessment and Forecast, By Type, 2012-2022 ($Million)
7.6.7.3. Market Assessment and Forecast, By Application, 2012-2022 ($Million)
7.6.8. South Africa
7.6.8.1. Market Assessment and Forecast, By Component, 2012-2022 ($Million)
7.6.8.2. Market Assessment and Forecast, By Type, 2012-2022 ($Million)
7.6.8.3. Market Assessment and Forecast, By Application, 2012-2022 ($Million)
7.6.9. United Arab Emirates
7.6.9.1. Market Assessment and Forecast, By Component, 2012-2022 ($Million)
7.6.9.2. Market Assessment and Forecast, By Type, 2012-2022 ($Million)
7.6.9.3. Market Assessment and Forecast, By Application, 2012-2022 ($Million)
7.6.10. Others
7.6.10.1. Market Assessment and Forecast, By Component, 2012-2022 ($Million)
7.6.10.2. Market Assessment and Forecast, By Type, 2012-2022 ($Million)
7.6.10.3. Market Assessment and Forecast, By Application, 2012-2022 ($Million)
8. Company Profiles
8.1. PTC Inc
8.1.1. Business Overview
8.1.2. Product Portfolio
8.1.3. Key Financials
8.1.4. Strategic Developments
8.2. Symantec Corporation
8.2.1. Business Overview
8.2.2. Product Portfolio
8.2.3. Key Financials
8.2.4. Strategic Developments
8.3. Trustwave
8.3.1. Business Overview
8.3.2. Product Portfolio
8.3.3. Key Financials
8.3.4. Strategic Developments
8.4. Verizon Enterprise Solutions
8.4.1. Business Overview
8.4.2. Product Portfolio
8.4.3. Key Financials
8.4.4. Strategic Developments
8.5. Check Point Security Software Technologies Ltd.
8.5.1. Business Overview
8.5.2. Product Portfolio
8.5.3. Key Financials
8.5.4. Strategic Developments
8.6. Cisco Systems, Inc.
8.6.1. Business Overview
8.6.2. Product Portfolio
8.6.3. Key Financials
8.6.4. Strategic Developments
8.7. Infineon Technologies
8.7.1. Business Overview
8.7.2. Product Portfolio
8.7.3. Key Financials
8.7.4. Strategic Developments
8.8. Gemalto NV
8.8.1. Business Overview
8.8.2. Product Portfolio
8.8.3. Key Financials
8.8.4. Strategic Developments
8.9. Trend Micro, Inc.
8.9.1. Business Overview
8.9.2. Product Portfolio
8.9.3. Strategic Developments
8.10. AT&T, Inc.
8.10.1. Business Overview
8.10.2. Product Portfolio
8.10.3. Key Financials
8.10.4. Strategic Developments
List of Tables
Table 1.IoT Security Market, By Component, 2012-2022, ($Million)
Table 2.Services Market, By Type, 2012-2022, ($Million)
Table 2.Services Market, By Region, 2012-2022, ($Million)
Table 3.Professional services Market, By Type, 2012-2022, ($Million)
Table 3.Professional services Market, By Region, 2012-2022, ($Million)
Table 8.Support and Maintenance Market, By Region, 2012-2022, ($Million)
Table 9.Integration Services Market, By Region, 2012-2022, ($Million)
Table 10.Consulting Services Market, By Region, 2012-2022, ($Million)
Table 11.Managed services Market, By Type, 2012-2022, ($Million)
Table 11.Managed services Market, By Region, 2012-2022, ($Million)
Table 12.Solutions Market, By Type ($Million), 2012-2022
Table 12.Solutions Market, By Region ($Million), 2012-2022
Table 13.Identity access management Market, By Region, 2012-2022, ($Million)
Table 14.Security analytics Market, By Region, 2012-2022, ($Million)
Table 15.IDS/IPS Market, By Region, 2012-2022, ($Million)
Table 16.Device authentication and management Market, By Region, 2012-2022, ($Million)
Table 17.Secure software and firmware update Market, By Region, 2012-2022, ($Million)
Table 18.Data encryption and tokenization Market, By Region ($Million), 2012-2022
Table 19.Secure communications Market, By Region, 2012-2022, ($Million)
Table 20.PKI lifecycle management Market, By Region, 2012-2022, ($Million)
Table 21.Distributed denial of service protection Market, By Region, 2012-2022, ($Million)
Table 22.Other Solutions Market, By Region, 2012-2022, ($Million)
Table 23.IoT Security Market, By Type, 2012-2022 ($Million)
Table 24.Endpoint security Market, By Region, 2012-2022, ($Million)
Table 25.Network security Market, By Region, 2012-2022, ($Million)
Table 26.Cloud security Market, By Region, 2012-2022, ($Million)
Table 27.Application security Market, By Region, 2012-2022, ($Million)
Table 28.Other Types Market, By Region, 2012-2022, ($Million)
Table 29.IoT Security Market, By Application, 2012-2022 ($Million)
Table 30.Connected Logistics Market, By Region, 2012-2022, ($Million)
Table 31.Consumer Wearables Market, By Region, 2012-2022, ($Million)
Table 32.Smart Government and Defense Market, By Region, 2012-2022, ($Million)
Table 33.Smart Energy and Utilities Market, By Region, 2012-2022, ($Million)
Table 34.Connected Vehicles Market, By Region, 2012-2022, ($Million)
Table 35.Smart Retail Market, By Region, 2012-2022, ($Million)
Table 36.Smart Manufacturing Market, By Region, 2012-2022, ($Million)
Table 37.Other Applications Market, By Region, 2012-2022, ($Million)
Table 38.IoT Security Market, By Region, 2012-2022 ($Million)
Table 39.North America IoT Security Market, By Country, 2012-2022 ($Million)
Table 40.North America IoT Security Market, By Component, 2012-2022 ($Million)
Table 41.North America IoT Security Market, By Type, 2012-2022 ($Million)
Table 42.North America IoT Security Market, By Application, 2012-2022 ($Million)
Table 43.U.S. IoT Security market, by Component, 2012-2022 ($Million)
Table 44.U.S. IoT Security market, by Type, 2012-2022 ($Million)
Table 45.U.S. IoT Security market, by Application, 2012-2022 ($Million)
Table 46.Canada IoT Security Market, By Component, 2012-2022 ($Million)
Table 47.Canada IoT Security Market, By Type, 2012-2022 ($Million)
Table 48.Canada IoT Security Market, By Application, 2012-2022 ($Million)
Table 49.Mexico IoT Security Market, By Component, 2012-2022 ($Million)
Table 50.Mexico IoT Security Market, By Type, 2012-2022 ($Million)
Table 51.Mexico IoT Security Market, By Application, 2012-2022 ($Million)
Table 52.Europe IoT Security Market, By Country, 2012-2022 ($Million)
Table 53.Europe IoT Security Market, By Component, 2012-2022 ($Million)
Table 54.Europe IoT Security Market, By Type, 2012-2022 ($Million)
Table 55.Europe IoT Security Market, By Application, 2012-2022 ($Million)
Table 56.Germany IoT Security Market, By Component, 2012-2022 ($Million)
Table 57.Germany IoT Security Market, By Type, 2012-2022 ($Million)
Table 58.Germany IoT Security Market, By Application, 2012-2022 ($Million)
Table 59.France IoT Security Market, By Component, 2012-2022 ($Million)
Table 60.France IoT Security Market, By Type, 2012-2022 ($Million)
Table 61.France IoT Security Market, By Application, 2012-2022 ($Million)
Table 62.UK IoT Security Market, By Component, 2012-2022 ($Million)
Table 63.UK IoT Security Market, By Type, 2012-2022 ($Million)
Table 64.UK IoT Security Market, By Application, 2012-2022 ($Million)
Table 65.Italy IoT Security Market, By Component, 2012-2022 ($Million)
Table 66.Italy IoT Security Market, By Type, 2012-2022 ($Million)
Table 67.Italy IoT Security Market, By Application, 2012-2022 ($Million)
Table 68.Spain IoT Security Market, By Component, 2012-2022 ($Million)
Table 69.Spain IoT Security Market, By Type, 2012-2022 ($Million)
Table 70.Spain IoT Security Market, By Application, 2012-2022 ($Million)
Table 71.Rest of Europe IoT Security Market, By Component, 2012-2022 ($Million)
Table 72.Rest of Europe IoT Security Market, By Type, 2012-2022 ($Million)
Table 73.Rest of Europe IoT Security Market, By Application, 2012-2022 ($Million)
Table 74.Asia-Pacific IoT Security Market, By Country, 2012-2022 ($Million)
Table 75.Asia-Pacific IoT Security Market, By Component, 2012-2022 ($Million)
Table 76.Asia-Pacific IoT Security Market, By Type, 2012-2022 ($Million)
Table 77.Asia-Pacific IoT Security Market, By Application, 2012-2022 ($Million)
Table 78.Japan IoT Security Market, By Component, 2012-2022 ($Million)
Table 79.Japan IoT Security Market, By Type, 2012-2022 ($Million)
Table 80.Japan IoT Security Market, By Application, 2012-2022 ($Million)
Table 81.China IoT Security Market, By Component, 2012-2022 ($Million)
Table 82.China IoT Security Market, By Type, 2012-2022 ($Million)
Table 83.China IoT Security Market, By Application, 2012-2022 ($Million)
Table 84.Australia IoT Security Market, By Component, 2012-2022 ($Million)
Table 85.Australia IoT Security Market, By Type, 2012-2022 ($Million)
Table 86.Australia IoT Security Market, By Application, 2012-2022 ($Million)
Table 87.India IoT Security Market, By Component, 2012-2022 ($Million)
Table 88.India IoT Security Market, By Type, 2012-2022 ($Million)
Table 89.India IoT Security Market, By Application, 2012-2022 ($Million)
Table 90.South Korea IoT Security Market, By Component, 2012-2022 ($Million)
Table 91.South Korea IoT Security Market, By Type, 2012-2022 ($Million)
Table 92.South Korea IoT Security Market, By Application, 2012-2022 ($Million)
Table 96.Rest of Asia-Pacific IoT Security Market, By Component, 2012-2022 ($Million)
Table 98.Rest of Asia-Pacific IoT Security Market, By Type, 2012-2022 ($Million)
Table 99.Rest of Asia-Pacific IoT Security Market, By Application, 2012-2022 ($Million)
Table 100.Rest of the World IoT Security Market, By Country, 2012-2022 ($Million)
Table 101.Rest of the World IoT Security Market, By Component, 2012-2022 ($Million)
Table 102.Rest of the World IoT Security Market, By Type, 2012-2022 ($Million)
Table 103.Rest of the World IoT Security Market, By Application, 2012-2022 ($Million)
Table 104.Brazil IoT Security Market, By Component, 2012-2022 ($Million)
Table 105.Brazil IoT Security Market, By Type, 2012-2022 ($Million)
Table 106.Brazil IoT Security Market, By Application, 2012-2022 ($Million)
Table 107.Turkey IoT Security Market, By Component, 2012-2022 ($Million)
Table 108.Turkey IoT Security Market, By Type, 2012-2022 ($Million)
Table 109.Turkey IoT Security Market, By Application, 2012-2022 ($Million)
Table 110.Saudi Arabia IoT Security Market, By Component, 2012-2022 ($Million)
Table 111.Saudi Arabia IoT Security Market, By Type, 2012-2022 ($Million)
Table 112.Saudi Arabia IoT Security Market, By Application, 2012-2022 ($Million)
Table 113.South Africa IoT Security Market, By Component, 2012-2022 ($Million)
Table 114.South Africa IoT Security Market, By Type, 2012-2022 ($Million)
Table 115.South Africa IoT Security Market, By Application, 2012-2022 ($Million)
Table 116.United Arab Emirates IoT Security Market, By Component, 2012-2022 ($Million)
Table 117.United Arab Emirates IoT Security Market, By Type, 2012-2022 ($Million)
Table 118.United Arab Emirates IoT Security Market, By Application, 2012-2022 ($Million)
Table 119.Others IoT Security Market, By Component, 2012-2022 ($Million)
Table 120.Others IoT Security Market, By Type, 2012-2022 ($Million)
Table 121.Others IoT Security Market, By Application, 2012-2022 ($Million)
Table 122.PTC Inc: Key Strategic Developments, 2017-2017
Table 123.Symantec Corporation: Key Strategic Developments, 2017-2017
Table 124.Trustwave: Key Strategic Developments, 2017-2017
Table 125.Verizon Enterprise Solutions: Key Strategic Developments, 2017-2017
Table 126.Check Point Security Software Technologies Ltd.: Key Strategic Developments, 2017-2017
Table 127.Cisco Systems, Inc.: Key Strategic Developments, 2017-2017
Table 128.Infineon Technologies: Key Strategic Developments, 2017-2017
Table 129.Gemalto NV: Key Strategic Developments, 2017-2017
Table 130.Trend Micro, Inc.: Key Strategic Developments, 2017-2017
Table 131.AT&T, Inc.: Key Strategic Developments, 2017-2017
List of Figures
Figure 1.IoT Security Market Share, By Component, 2012 & 2022
Figure 2.IoT Security Market, By Type, 2017, ($Million)
Figure 3.IoT Security Market, By Application, 2017, ($Million)
Figure 4.IoT Security Market, By Region, 2017, ($Million)
Figure 5.PTC Inc: Net Revenues, 2017-2017 ($Million)
Figure 6.PTC Inc: Net Revenue Share, By Segment, 2017
Figure 7.PTC Inc: Net Revenue Share, By Geography, 2017
Figure 8.Symantec Corporation: Net Revenues, 2017-2017 ($Million)
Figure 9.Symantec Corporation: Net Revenue Share, By Segment, 2017
Figure 10.Symantec Corporation: Net Revenue Share, By Geography, 2017
Figure 11.Trustwave: Net Revenues, 2017-2017 ($Million)
Figure 12.Trustwave: Net Revenue Share, By Segment, 2017
Figure13.Trustwave: Net Revenue Share, By Geography, 2017
Figure14. Verizon Enterprise Solutions: Net Revenues, 2017-2017 ($Million)
Figure15. Verizon Enterprise Solutions: Net Revenue Share, By Segment, 2017
Figure16. Verizon Enterprise Solutions: Net Revenue Share, By Geography, 2017
Figure 17.Check Point Security Software Technologies Ltd.: Net Revenues, 2017-2017 ($Million)
Figure18.Check Point Security Software Technologies Ltd.: Net Revenue Share, By Segment, 2017
Figure 19.Check Point Security Software Technologies Ltd.: Net Revenue Share, By Geography, 2017
Figure 20.Cisco Systems, Inc.: Net Revenues, 2017-2017 ($Million)
Figure 21.Cisco Systems, Inc.: Net Revenue Share, By Segment, 2017
Figure 22.Cisco Systems, Inc.: Net Revenue Share, By Geography, 2017
Figure 23.Infineon Technologies: Net Revenues, 2017-2017 ($Million)
Figure 24.Infineon Technologies: Net Revenue Share, By Segment, 2017
Figure 25.Infineon Technologies: Net Revenue Share, By Geography, 2017
Figure 26.Gemalto NV: Net Revenues, 2017-2017 ($Million)
Figure 27.Gemalto NV: Net Revenue Share, By Segment, 2017
Figure 28.Gemalto NV: Net Revenue Share, By Geography, 2017
Figure 29.Trend Micro, Inc.: Net Revenues, 2017-2017 ($Million)
Figure 30.Trend Micro, Inc.: Net Revenue Share, By Segment, 2017
Figure 31.Trend Micro, Inc.: Net Revenue Share, By Geography, 2017
Figure 32.AT&T, Inc.: Net Revenues, 2017-2017 ($Million)
Figure 33.AT&T, Inc.: Net Revenue Share, By Segment, 2017
Figure 34.AT&T, Inc.: Net Revenue Share, By Geography, 2017
Research Methodology
We use both primary as well as secondary research for our market surveys, estimates and for developing forecast. Our research process commence by analyzing the problem which enable us to design the scope for our research study. Our research process is uniquely designed with enough flexibility to adjust according to changing nature of products and markets, while retaining core element to ensure reliability and accuracy in research findings. We understand both macro and micro-economic factors to evaluate and forecast different market segments.
Data Mining
Data is extensively collected through various secondary sources such as annual reports, investor presentations, SEC filings, and other corporate publications. We also refer trade magazines, technical journals, paid databases such as Factiva and Bloomberg, industry trade journals, scientific journals, and social media data to understand market dynamics and industry trends. Further, we also conduct primary research to understand market drivers, restraints, opportunities, challenges, and competitive scenario to build our analysis.
Data Collection Matrix
|
Data Collection Matrix |
Supply Side |
Demand Side |
|
Primary Data Sources |
|
|
|
Secondary Data Sources |
|
|
Market Modeling and Forecasting
We use epidemiology and capital equipment-based models to forecast market size of different segments at country and regional level.
- Epidemiology-based Forecasting Model: This method uses epidemiology data gathered through various publications and from physicians to estimate population of patients, flow of treatment of individual disease and therapies. The data collected through this method includes statics on incidence of disease, population suffering from disease, and treatment population. This method is used to understand:
- Number of patients for particular device or medical procedure and
- Repeated use of particular device depending on health and condition of patient
- Capital-based Forecasting Model: This method of forecasting is based on number of replacements, installed-based and new sales of capital equipment used in various healthcare and diagnostic centers. These three parameters are calculated and forecast is developed. Installation base is calculated as average number of units per facility; while sales for particular year is calculated from number of new and replace units. Secondary data is collected through various supply chain intermediaries and opinion leaders to arrive at installation and sales rate. These techniques help our analysts in validating market and developed market estimates and forecast.
We do forecast on basis of several parameters such as market drivers, market opportunities, industry trends government regulations, raw materials supply and trade dynamics to ensure relevance of forecast with market scenario. With increasing need to granulized information, we used bottom-up methodology for forecasting where we evaluate each regional segment differently and combined all forecast to develop final market forecast.
Data Validation
We believe primary research is a very important tool in analyzing and forecasting different markets. In order to make sure accuracy of our findings, our team conducts primary interviews at every stage of research to gain deep insights into current business environment and future trends and key developments in market. This includes use of various methods such as telephonic interviews, focus groups, face to face interviews and questionnaires to validate our research from all aspects. We validate our data through primary research from key industry leaders such as CEO, product managers, marketing managers, suppliers, distributors, and consumers are frequently interviewed. These interviews provide valuable insights which help us to have better market understanding besides validating our estimates and forecast.
Data Triangulation

Industry Analysis
|
Qualitative Data |
Quantitative Data (2017-2025) |
|
|