Industrial Protective Clothing Market by Product and Application - Global Industry Analysis and Forecast to 2022
Published On : September 2017 Pages : 130 Category: Advanced Materials Report Code : CM09225
Industrial outlook and Trend Analysis
The Industrial Protective Clothing market was valued around USD 6.56 billion in 2017 and is expected to reach approximately USD 10.55 billion by the end of 2022 while registering itself at a compound annual growth rate (CAGR) of 5.34% during the forecast period. Increasing workplace threats combined with rising safety concerns for employees in sectors like manufacturing, food processing, chemical, oil & gas are anticipated to be prime factors that influence the growth of this market. Rising awareness towards the health and safety of workers along with growing industrial fatalities in developing economies because of inadequacy of protective gear is anticipated to boost the growth over the estimated time frame. Technological developments alongside changing purchaser requirement protective clothing which consolidates security with mold and appeal is additionally evaluated to increase market extension. Safety principles by administrative offices that include Occupational Safety and Health Administration (OSHA), primarily in Europe and North America are a noteworthy market driver for mechanical protective clothing. Conferences in regard with employee health and safety issues and processes like total quality management (TQM) have propelled the demand of industrial protective clothing making it compulsory for organizations to adhere to the regulations in association with the safety of employees at workplace. Furthermore, administrative offices in Asia Pacific and the Middle East are imposing strict rules to make it mandatory for organizations to take responsibility of the safety of the workers. Upper administration in a large portion of the modern firms is likewise getting to be plainly proactive with respect to laborers' wellbeing at the separate work environment. The strict administrative regulations in developed economies that include the United Kingdom and the United States has been urging companies to adhere to the rules to avert any kind of hazard. As per the Occupational Safety and Health Administration the predominance of protective clothing worldwide is anticipated to increase in industries like healthcare, pharmaceutical and research laboratories. Rising value of raw materials that render characteristics such as high resistance to heat, light weight, wear & tear resistance and comfort are anticipated to compel organizations to widely invest in research and development.
Product Outlook and Trend Analysis
Reliable clothing came up as a dominant segment of product that registered for more than 55 percent of the total volume in 2017. Rising occupational accidents along with the demand for sturdy mechanical wear resistance and high utility defensive gears in industries like metal manufacturing, refining, automotive, oil & gas are expected to boost the growth of this market. Frequent utilization of these products along with swift industrialization in developing countries like Brazil, China and India is anticipated to fuel the demand of protective clothing. Strong mechanical defensive clothing is significantly helpful for antagonistic condition including working ranges having high temperature - weight and radiations. Owing to factors like increasing preference for durable clothing among consumers to work in extreme conditions and avoiding blunder. Industrial protective clothing that is disposable is anticipated to encounter significant growth in the following years. Disposable garments are utilized for insurance from low to medium level risks, for example, fluid handling in cleanroom or research facilities. A developing trend of utilizing clothing that is disposable coupled with reliable clothing is anticipated to boost the global protective clothing market. Expendable attire is utilized as a part of help to strong dress to upgrade their strength. Major application segments of disposable protective clothing are sewage treatment, disaster response, hazardous waste management, specialist laboratories, disease control, drainage construction and emergency services.
Application Outlook and Trend Analysis
The biggest application segment in 2017 was chemical protective clothing that registered for more than 30 percent of the total share of the market and is anticipated to witness significant growth in the following years. Chemical protective garments should be very sturdy, lightweight, breathable and agreeable for the shop-floor specialists without influencing their general capacities. Particular demands as such will further boost the demand of protective clothing. Fire resistant clothing is expected to witness the most elevated development over the estimated time frame by virtue of expanding interest for solid and breathable fire safe apparel. Rising importance of reducing fire threats in the industrial sector is anticipated to boost the demand of fire resistant protective clothing over the forecast period. Extra factors, for example, stringent fire security directions and rules are relied upon to command the utilization of flame retardant clothing over different enterprises. Rising requirement for defensive gears at the time of welding and glass cutting or meat cutting is anticipated to boost the demand of the product in the upcoming years.
Regional Outlook and Trend Analysis
The biggest regional market was North America that registered for more than 35 percent of the market profit in 2017 and is said to witness significant growth in the upcoming years. The region is described by fast development in fragments, for example, thermal and fire retardant protective apparel. This growth is on account of various modifications in the industry principles by government organizations like Occupational Safety and Health Administration and National Fire Protection Association. Rising initiatives towards the safety of workers coupled with great demand from the manufacturing and automotive industry is expected to fuel the growth of the market. Technological advancements coupled with volatile demand of consumers for protective clothing that provides security, attractiveness and comfort is expected to bolster the growth of this market. Increasing manufacturing and enhanced infrastructure in countries like Brazil, China, Israel, Vietnam and India is anticipated to fuel the demand of the product in the upcoming years.
Competitive Insights
Industrial protective clothing market share on a global level is extremely competitive due to major diverse product landscape that includes coats, boots, gloves, shoe covers, and overalls. Competitive landscape is characterized by integrations, strategic acquisitions, and partnerships. Some of the major companies in the industry are Lakeland Industries, Inc, Bennett Safetywear Ltd, DuPont, Australian Defence Apparel, Koninklijke Ten Cate NV, PBI Performance Products and Teijin Ltd.
Raw material costing of carbon fiber and aramid which are high and varying might pose a threat to the global market of this industry in the forthcoming years. Moreover, exhaustive costing nature of this industry due to the intricate manufacturing procedures might hamper the global growth of this market. Pricing for aramid fiber which is manufactured by DuPont under the tradename Kevlar varies between USD 22 and USD 37 per kilogram.
The global industrial protective clothing market is segmented as follows-
By Product
- Durable clothing
- Disposable clothing
By Application
- Mechanical protective clothing
- Chemical defending garments
- Limited general use clothing
- Flame retardant apparel
- Clean room clothing
By Region
- North America
- U.S
- Canada
- Mexico
- Europe
- Germany
- France
- UK
- Italy
- Spain
- Rest of Europe
- Asia-Pacific
- Japan
- China
- Australia
- India
- South Korea
- Rest of Asia Pacific
- Rest of the World
- Brazil
- South Africa
- Saudi Arabia
- United Arab Emirates
- Others
Some of the key questions answered by the report are:
- What was the market size in 2017 and forecast from 2017 to 2022?
- What will be the industry market growth from 2017 to 2022?
- What are the major drivers, restraints, opportunities, challenges, and industry trends and their impact on the market forecast?
- What are the major segments leading the market growth and why?
- Which are the leading players in the market and what are the major strategies adopted by them to sustain the market competition?
Market Classification
- Industrial Protective Clothing Market, By Product, Estimates and Forecast, 2014-2022 ($Million)
- Durable clothing
- Disposable clothing
- Industrial Protective Clothing Market, By Application, Estimates and Forecast, 2014-2022 ($Million)
- Mechanical protective clothing
- Chemical defending garments
- Limited general use clothing
- Flame retardant apparel
- Clean room clothing
- Industrial Protective Clothing Market, By Region, Estimates and Forecast, 2014-2022 ($Million)
- North America
- North America Industrial Protective Clothing Market, By Country
- North America Industrial Protective Clothing Market, By Product
- North America Industrial Protective Clothing Market, By Application
- U.S. Industrial Protective Clothing Market, By Product
- U.S. Industrial Protective Clothing Market, By Application
- Canada Industrial Protective Clothing Market, By Product
- Canada Industrial Protective Clothing Market, By Application
- Mexico Industrial Protective Clothing Market, By Product
- Mexico Industrial Protective Clothing Market, By Application
-
- Europe
- Europe Industrial Protective Clothing Market, By Country
- Europe Industrial Protective Clothing Market, By Product
- Europe Industrial Protective Clothing Market, By Application
- Germany Industrial Protective Clothing Market, By Product
- Germany Industrial Protective Clothing Market, By Application
- France Industrial Protective Clothing Market, By Product
- France Industrial Protective Clothing Market, By Application
- UK Industrial Protective Clothing Market, By Product
- UK Industrial Protective Clothing Market, By Application
- Italy Industrial Protective Clothing Market, By Product
- Italy Industrial Protective Clothing Market, By Application
- Spain Industrial Protective Clothing Market, By Product
- Spain Industrial Protective Clothing Market, By Application
- Rest of Europe Industrial Protective Clothing Market, By Product
- Rest of Europe Industrial Protective Clothing Market, By Application
-
- Asia-Pacific
- Asia-Pacific Industrial Protective Clothing Market, By Country
- Asia-Pacific Industrial Protective Clothing Market, By Product
- Asia-Pacific Industrial Protective Clothing Market, By Application
- Japan Industrial Protective Clothing Market, By Product
- Japan Industrial Protective Clothing Market, By Application
- Australia Industrial Protective Clothing Market, By Product
- Australia Industrial Protective Clothing Market, By Application
- India Industrial Protective Clothing Market, By Product
- India Industrial Protective Clothing Market, By Application
- South Korea Industrial Protective Clothing Market, By Product
- South Korea Industrial Protective Clothing Market, By Application
- Rest of Asia-Pacific Industrial Protective Clothing Market, By Product
- Rest of Asia-Pacific Industrial Protective Clothing Market, By Application
- Asia-Pacific
-
- Rest of the World
- Rest of the World Industrial Protective Clothing Market, By Country
- Rest of the World Industrial Protective Clothing Market, By Product
- Rest of the World Industrial Protective Clothing Market, By Application
- Brazil Industrial Protective Clothing Market, By Product
- Brazil Industrial Protective Clothing Market, By Application
- South Africa Industrial Protective Clothing Market, By Product
- South Africa Industrial Protective Clothing Market, By Application
- Saudi Arabia Industrial Protective Clothing Market, By Product
- Saudi Arabia Industrial Protective Clothing Market, By Application
- Turkey Industrial Protective Clothing Market, By Product
- Turkey Industrial Protective Clothing Market, By Application
- United Arab Emirates Industrial Protective Clothing Market, By Product
- United Arab Emirates Industrial Protective Clothing Market, By Application
- Others Industrial Protective Clothing Market, By Product
- Others Industrial Protective Clothing Market, By Application
- Rest of the World
Table of Contents
1.Introduction
1.1.Report Description
1.2.Research Methodology
1.2.1. Secondary Research
1.2.2. Primary Research
2.Executive Summary
2.1.Key Highlights
3.Market Overview
3.1.Introduction
3.1.1. Market Definition
3.1.2. Market Segmentation
3.2.Market Share Analysis
3.3.Market Dynamics
3.3.1. Drivers
3.3.1.1.Increasing prevalence of safety at workplace
3.3.1.2.Heavy investments in R&D to boost market growth
3.3.1.3.Increment in Safety Norms
3.3.2. Restraints
3.3.2.1.Expensive raw materials
3.3.3. Opportunities
3.3.3.1.Rising demand from emerging economies
3.4.Industry Trends
4.Industrial Protective Clothing Market, By Product
4.1.Introduction
4.2.Industrial Protective Clothing Market Assessment and Forecast, By Product, 2017-2022
4.3.Durable clothing
4.3.1. Market Assessment and Forecast, By Region, 2017-2022 ($Million)
4.4.Disposable clothing
4.4.1. Market Assessment and Forecast, By Region, 2017-2022 ($Million)
5.Industrial Protective Clothing Market, By Application
5.1.Introduction
5.2.Industrial Protective Clothing Market Assessment and Forecast, By Application, 2017-2022
5.3.Mechanical protective clothing
5.3.1.1.Market Assessment and Forecast, By Region, 2017-2022 ($Million)
5.4.Chemical defending garments
5.4.1.1.Market Assessment and Forecast, By Region, 2017-2022 ($Million)
5.5.Limited general use clothing
5.5.1.1.Market Assessment and Forecast, By Region, 2017-2022 ($Million)
5.6.Flame retardant apparel
5.6.1.1.Market Assessment and Forecast, By Region, 2017-2022 ($Million)
5.7.Clean room clothing
5.7.1.1.Market Assessment and Forecast, By Region, 2017-2022 ($Million)
6.Industrial Protective Clothing Market, By Region
6.1.Introduction
6.2.Industrial Protective Clothing Market Assessment and Forecast, By Region, 2017-2022 ($Million)
6.3.North America
6.3.1. Market Assessment and Forecast, By Country, 2017-2022 ($Million)
6.3.2. Market Assessment and Forecast, By Product, 2017-2022 ($Million)
6.3.3. Market Assessment and Forecast, By Application, 2017-2022 ($Million)
6.3.3.1.U.S.
6.3.3.1.1.Market Assessment and Forecast, By Product, 2017-2022 ($Million)
6.3.3.1.2.Market Assessment and Forecast, By Application, 2017-2022 ($Million)
6.3.3.2.Canada
6.3.3.2.1.Market Assessment and Forecast, By Product, 2017-2022 ($Million)
6.3.3.2.2.Market Assessment and Forecast, By Application, 2017-2022 ($Million)
6.3.3.3.Mexico
6.3.3.3.1.Market Assessment and Forecast, By Product, 2017-2022 ($Million)
6.3.3.3.2.Market Assessment and Forecast, By Application, 2017-2022 ($Million)
6.4.Europe
6.4.1. Market Assessment and Forecast, By Country, 2017-2022 ($Million)
6.4.2. Market Assessment and Forecast, By Product, 2017-2022 ($Million)
6.4.3. Market Assessment and Forecast, By Application, 2017-2022 ($Million)
6.4.3.1.Germany
6.4.3.1.1.Market Assessment and Forecast, By Product, 2017-2022 ($Million)
6.4.3.1.2.Market Assessment and Forecast, By Application, 2017-2022 ($Million)
6.4.3.2.France
6.4.3.2.1.Market Assessment and Forecast, By Product, 2017-2022 ($Million)
6.4.3.2.2.Market Assessment and Forecast, By Product, 2017-2022 ($Million)
6.4.3.3.UK
6.4.3.3.1.Market Assessment and Forecast, By Product, 2017-2022 ($Million)
6.4.3.3.2.Market Assessment and Forecast, By Application, 2017-2022 ($Million)
6.4.3.4.Italy
6.4.3.4.1.Market Assessment and Forecast, By Product, 2017-2022 ($Million)
6.4.3.4.2.Market Assessment and Forecast, By Application, 2017-2022 ($Million)
6.4.3.5.Spain
6.4.3.5.1.Market Assessment and Forecast, By Product, 2017-2022 ($Million)
6.4.3.5.2.Market Assessment and Forecast, By Application, 2017-2022 ($Million)
6.4.3.6.Russia
6.4.3.6.1.Market Assessment and Forecast, By Product, 2017-2022 ($Million)
6.4.3.6.2.Market Assessment and Forecast, By Application, 2017-2022 ($Million)
6.4.3.7.Rest of Europe
6.4.3.7.1.Market Assessment and Forecast, By Product, 2017-2022 ($Million)
6.4.3.7.2.Market Assessment and Forecast, By Application, 2017-2022 ($Million)
6.5.Asia-Pacific
6.5.1. Market Assessment and Forecast, By Country, 2017-2022 ($Million)
6.5.2. Market Assessment and Forecast, By Product, 2017-2022 ($Million)
6.5.3. Market Assessment and Forecast, By Application, 2017-2022 ($Million)
6.5.3.1.Japan
6.5.3.1.1.Market Assessment and Forecast, By Product, 2017-2022 ($Million)
6.5.3.1.2.Market Assessment and Forecast, By Application, 2017-2022 ($Million)
6.5.3.2.China
6.5.3.2.1.Market Assessment and Forecast, By Product, 2017-2022 ($Million)
6.5.3.2.2.Market Assessment and Forecast, By Application, 2017-2022 ($Million)
6.5.3.3.Australia
6.5.3.3.1.Market Assessment and Forecast, By Product, 2017-2022 ($Million)
6.5.3.3.2.Market Assessment and Forecast, By Application, 2017-2022 ($Million)
6.5.3.4.India
6.5.3.4.1.Market Assessment and Forecast, By Product, 2017-2022 ($Million)
6.5.3.4.2.Market Assessment and Forecast, By Application, 2017-2022 ($Million)
6.5.3.5.South Korea
6.5.3.5.1.Market Assessment and Forecast, By Product, 2017-2022 ($Million)
6.5.3.5.2.Market Assessment and Forecast, By Application, 2017-2022 ($Million)
6.5.3.6.Taiwan
6.5.3.6.1.Market Assessment and Forecast, By Product, 2017-2022 ($Million)
6.5.3.6.2.Market Assessment and Forecast, By Application, 2017-2022 ($Million)
6.5.3.7.Rest of Asia-Pacific
6.5.3.7.1.Market Assessment and Forecast, By Product, 2017-2022 ($Million)
6.5.3.7.2.Market Assessment and Forecast, By Application, 2017-2022 ($Million)
6.6.Rest of the World
6.6.1. Market Assessment and Forecast, By Country, 2017-2022 ($Million)
6.6.2. Market Assessment and Forecast, By Product, 2017-2022 ($Million)
6.6.3. Market Assessment and Forecast, By Application, 2017-2022 ($Million)
6.6.3.1.Brazil
6.6.3.1.1.Market Assessment and Forecast, By Product, 2017-2022 ($Million)
6.6.3.1.2.Market Assessment and Forecast, By Application, 2017-2022 ($Million)
6.6.3.2.Turkey
6.6.3.2.1.Market Assessment and Forecast, By Product, 2017-2022 ($Million)
6.6.3.2.2.Market Assessment and Forecast, By Application, 2017-2022 ($Million)
6.6.3.3.Saudi Arabia
6.6.3.3.1.Market Assessment and Forecast, By Product, 2017-2022 ($Million)
6.6.3.3.2.Market Assessment and Forecast, By Application, 2017-2022 ($Million)
6.6.3.4.South Africa
6.6.3.4.1.Market Assessment and Forecast, By Product, 2017-2022 ($Million)
6.6.3.4.2.Market Assessment and Forecast, By Application, 2017-2022 ($Million)
6.6.3.5.United Arab Emirates
6.6.3.5.1.Market Assessment and Forecast, By Product, 2017-2022 ($Million)
6.6.3.5.2.Market Assessment and Forecast, By Application, 2017-2022 ($Million)
6.6.3.6.Others
6.6.3.6.1.Market Assessment and Forecast, By Product, 2017-2022 ($Million)
6.6.3.6.2.Market Assessment and Forecast, By Application, 2017-2022 ($Million)
7.Company Profiles
7.1.LAKELAND INDUSTRIES, INC.
7.1.1. Business Overview
7.1.2. Product Portfolio
7.1.3. Strategic Developments
7.2.E. I. du Pont de Nemours and Company
7.2.1. Business Overview
7.2.2. Product Portfolio
7.2.3. Key Financials
7.2.4. Strategic Developments
7.3.3M Company
7.3.1. Business Overview
7.3.2. Product Portfolio
7.3.3. Key Financials
7.3.4. Strategic Developments
7.4.BALLYCLARE LIMITED
7.4.1. Business Overview
7.4.2. Product Portfolio
7.4.3. Strategic Developments
7.5.KONINKLIJKE TEN CATE NV
7.5.1. Business Overview
7.5.2. Product Portfolio
7.5.3. Strategic Developments
7.6.WORKRITE UNIFORM COMPANY, INC.
7.6.1. Business Overview
7.6.2. Product Portfolio
7.6.3. Strategic Developments
7.7.TEIJIN LIMITED
7.7.1. Business Overview
7.7.2. Product Portfolio
7.7.3. Key Financials
7.7.4. Strategic Developments
7.8.CETRIKO S.L.
7.8.1. Business Overview
7.8.2. Product Portfolio
7.8.3. Strategic Developments
7.9.GLEN RAVEN INC.
7.9.1. Business Overview
7.9.2. Product Portfolio
7.9.3. Strategic Developments
7.10.W.L. GORE & ASSOCIATES, INC.
7.10.1.Business Overview
7.10.2.Product Portfolio
7.10.3.Strategic Developments
List of Tables
Table 1.Industrial Protective Clothing Market, By Product ($Million), 2017-2022
Table 2.Durable clothing Market, By Region ($Million), 2017-2022
Table 3.Disposable clothing Market, By Region ($Million), 2017-2022
Table 4.Industrial Protective Clothing Market, By Application ($Million), 2017-2022
Table 5.Mechanical protective clothing Market, By Region ($Million), 2017-2022
Table 6.Chemical defending garments Market, By Region ($Million), 2017-2022
Table 7.Limited general use clothing Market, By Region ($Million), 2017-2022
Table 8.Flame retardant apparel Market, By Region ($Million), 2017-2022
Table 9.Clean room clothing Market, By Region ($Million), 2017-2022
Table 10.Industrial Protective Clothing Market, By Region ($Million), 2017-2022
Table 11.North America Industrial Protective Clothing Market, By Country, 2017-2022 ($Million)
Table 12.North America Industrial Protective Clothing Market, By Product, 2017-2022 ($Million)
Table 13.North America Industrial Protective Clothing Market, By Application, 2017-2022 ($Million)
Table 14.U.S. Industrial Protective Clothing Market, By Product, 2017-2022 ($Million)
Table 15.U.S. Industrial Protective Clothing Market, By Application, 2017-2022 ($Million)
Table 16.Canada Industrial Protective Clothing Market, By Product, 2017-2022 ($Million)
Table 17.Canada Industrial Protective Clothing Market, By Application, 2017-2022 ($Million)
Table 18.Mexico Industrial Protective Clothing Market, By Product, 2017-2022 ($Million)
Table 19.Mexico Industrial Protective Clothing Market, By Application, 2017-2022 ($Million)
Table 20.Europe Industrial Protective Clothing Market, By Country, 2017-2022 ($Million)
Table 21.Europe Industrial Protective Clothing Market, By Product, 2017-2022 ($Million)
Table 22.Europe Industrial Protective Clothing Market, By Application, 2017-2022 ($Million)
Table 23.Germany Industrial Protective Clothing Market, By Product, 2017-2022 ($Million)
Table 24.Germany Industrial Protective Clothing Market, By Application, 2017-2022 ($Million)
Table 25.France Industrial Protective Clothing Market, By Product, 2017-2022 ($Million)
Table 26.France Industrial Protective Clothing Market, By Application, 2017-2022 ($Million)
Table 27.UK Industrial Protective Clothing Market, By Product, 2017-2022 ($Million)
Table 28.UK Industrial Protective Clothing Market, By Application, 2017-2022 ($Million)
Table 29.Italy Industrial Protective Clothing Market, By Product, 2017-2022 ($Million)
Table 30.Italy Industrial Protective Clothing Market, By Application, 2017-2022 ($Million)
Table 31.Spain Industrial Protective Clothing Market, By Product, 2017-2022 ($Million)
Table 32.Spain Industrial Protective Clothing Market, By Application, 2017-2022 ($Million)
Table 33.Russia Industrial Protective Clothing Market, By Product, 2017-2022 ($Million)
Table 34.Russia Industrial Protective Clothing Market, By Application, 2017-2022 ($Million)
Table 35.Rest of Europe Industrial Protective Clothing Market, By Product, 2017-2022 ($Million)
Table 36.Rest of Europe Industrial Protective Clothing Market, By Application, 2017-2022 ($Million)
Table 37.Asia-Pacific Industrial Protective Clothing Market, By Country, 2017-2022 ($Million)
Table 38.Asia-Pacific Industrial Protective Clothing Market, By Product, 2017-2022 ($Million)
Table 39.Asia-Pacific Industrial Protective Clothing Market, By Application, 2017-2022 ($Million)
Table 40.Japan Industrial Protective Clothing Market, By Product, 2017-2022 ($Million)
Table 41.Japan Industrial Protective Clothing Market, By Application, 2017-2022 ($Million)
Table 42.China Industrial Protective Clothing Market, By Product, 2017-2022 ($Million)
Table 43.China Industrial Protective Clothing Market, By Application, 2017-2022 ($Million)
Table 44.Australia Industrial Protective Clothing Market, By Product, 2017-2022 ($Million)
Table 45.Australia Industrial Protective Clothing Market, By Application, 2017-2022 ($Million)
Table 46.India Industrial Protective Clothing Market, By Product, 2017-2022 ($Million)
Table 47.India Industrial Protective Clothing Market, By Application, 2017-2022 ($Million)
Table 48.South Korea Industrial Protective Clothing Market, By Product, 2017-2022 ($Million)
Table 49.South Korea Industrial Protective Clothing Market, By Application, 2017-2022 ($Million)
Table 50.Taiwan Industrial Protective Clothing Market, By Product, 2017-2022 ($Million)
Table 51.Taiwan Industrial Protective Clothing Market, By Application, 2017-2022 ($Million)
Table 52.Rest of Asia-Pacific Industrial Protective Clothing Market, By Product, 2017-2022 ($Million)
Table 53.Rest of Asia-Pacific Industrial Protective Clothing Market, By Application, 2017-2022 ($Million)
Table 54.Rest of the World Industrial Protective Clothing Market, By Country, 2017-2022 ($Million)
Table 55.Rest of the World Industrial Protective Clothing Market, By Product, 2017-2022 ($Million)
Table 56.Rest of the World Industrial Protective Clothing Market, By Application, 2017-2022 ($Million)
Table 57.Brazil Industrial Protective Clothing Market, By Product, 2017-2022 ($Million)
Table 58.Brazil Industrial Protective Clothing Market, By Application, 2017-2022 ($Million)
Table 59.Turkey Industrial Protective Clothing Market, By Product, 2017-2022 ($Million)
Table 60.Turkey Industrial Protective Clothing Market, By Application, 2017-2022 ($Million)
Table 61.Saudi Arabia Industrial Protective Clothing Market, By Product, 2017-2022 ($Million)
Table 62.Saudi Arabia Industrial Protective Clothing Market, By Application, 2017-2022 ($Million)
Table 63.South Africa Industrial Protective Clothing Market, By Product, 2017-2022 ($Million)
Table 64.South Africa Industrial Protective Clothing Market, By Application, 2017-2022 ($Million)
Table 65.United Arab Emirates Industrial Protective Clothing Market, By Product, 2017-2022 ($Million)
Table 66.United Arab Emirates Industrial Protective Clothing Market, By Application, 2017-2022 ($Million)
Table 67.Others Industrial Protective Clothing Market, By Product, 2017-2022 ($Million)
Table 68.Others Industrial Protective Clothing Market, By Application, 2017-2022 ($Million)
Table 69.LAKELAND INDUSTRIES, INC.: Key Strategic Developments, 2017-2017
Table 70.E. I. du Pont de Nemours and Company: Key Strategic Developments, 2017-2017
Table 71.3M Company: Key Strategic Developments, 2017-2017
Table 72.BALLYCLARE LIMITED: Key Strategic Developments, 2017-2017
Table 73.KONINKLIJKE TEN CATE NV: Key Strategic Developments, 2017-2017
Table 74.WORKRITE UNIFORM COMPANY, INC.: Key Strategic Developments, 2017-2017
Table 75.TEIJIN LIMITED: Key Strategic Developments, 2017-2017
Table 76.CETRIKO S.L.: Key Strategic Developments, 2017-2017
Table 77.GLEN RAVEN INC.: Key Strategic Developments, 2017-2017
Table 78.W.L. GORE & ASSOCIATES, INC.: Key Strategic Developments, 2017-2017
List of Figures
Figure 1.Industrial Protective Clothing Market Share, By Product, 2017 & 2022 ($Million)
Figure 2.Industrial Protective Clothing Market, By Application, 2017 & 2022 ($Million)
Figure 3.Industrial Protective Clothing Market, By Region, 2017, ($Million)
Figure 4.E. I. du Pont de Nemours and Company: Net Revenues, 2017-2017 ($Million)
Figure 5.E. I. du Pont de Nemours and Company: Net Revenue Share, By Segment, 2017
Figure 6.E. I. du Pont de Nemours and Company: Net Revenue Share, By Geography, 2017
Figure 7.3M Company: Net Revenues, 2017-2017 ($Million)
Figure 8.3M Company: Net Revenue Share, By Segment, 2017
Figure 9.3M Company: Net Revenue Share, By Geography, 2017
Figure 10.TEIJIN LIMITED: Net Revenues, 2017-2017 ($Million)
Figure 11.TEIJIN LIMITED: Net Revenue Share, By Segment, 2017
Figure 12.TEIJIN LIMITED: Net Revenue Share, By Geography, 2017
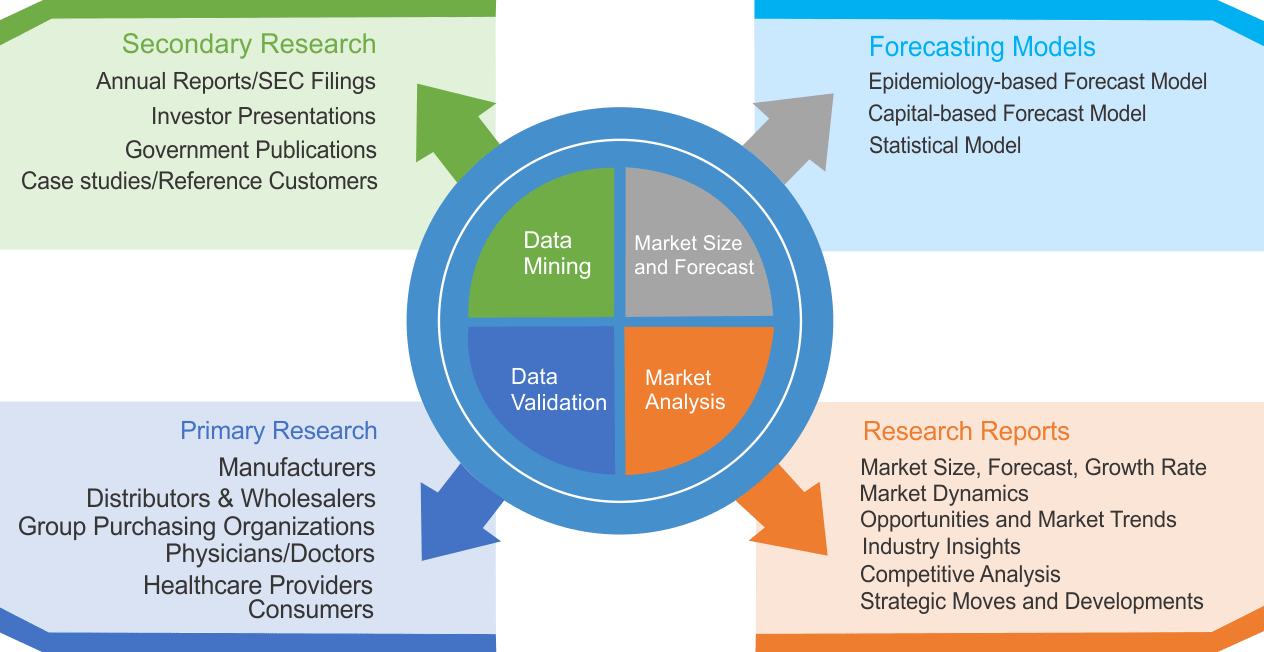
Research Methodology
We use both primary as well as secondary research for our market surveys, estimates and for developing forecast. Our research process commence by analyzing the problem which enable us to design the scope for our research study. Our research process is uniquely designed with enough flexibility to adjust according to changing nature of products and markets, while retaining core element to ensure reliability and accuracy in research findings. We understand both macro and micro-economic factors to evaluate and forecast different market segments.
Data Mining
Data is extensively collected through various secondary sources such as annual reports, investor presentations, SEC filings, and other corporate publications. We also refer trade magazines, technical journals, paid databases such as Factiva and Bloomberg, industry trade journals, scientific journals, and social media data to understand market dynamics and industry trends. Further, we also conduct primary research to understand market drivers, restraints, opportunities, challenges, and competitive scenario to build our analysis.
Data Collection Matrix
|
Data Collection Matrix |
Supply Side |
Demand Side |
|
Primary Data Sources |
|
|
|
Secondary Data Sources |
|
|
Market Modeling and Forecasting
We use epidemiology and capital equipment-based models to forecast market size of different segments at country and regional level.
- Epidemiology-based Forecasting Model: This method uses epidemiology data gathered through various publications and from physicians to estimate population of patients, flow of treatment of individual disease and therapies. The data collected through this method includes statics on incidence of disease, population suffering from disease, and treatment population. This method is used to understand:
- Number of patients for particular device or medical procedure and
- Repeated use of particular device depending on health and condition of patient
- Capital-based Forecasting Model: This method of forecasting is based on number of replacements, installed-based and new sales of capital equipment used in various healthcare and diagnostic centers. These three parameters are calculated and forecast is developed. Installation base is calculated as average number of units per facility; while sales for particular year is calculated from number of new and replace units. Secondary data is collected through various supply chain intermediaries and opinion leaders to arrive at installation and sales rate. These techniques help our analysts in validating market and developed market estimates and forecast.
We do forecast on basis of several parameters such as market drivers, market opportunities, industry trends government regulations, raw materials supply and trade dynamics to ensure relevance of forecast with market scenario. With increasing need to granulized information, we used bottom-up methodology for forecasting where we evaluate each regional segment differently and combined all forecast to develop final market forecast.
Data Validation
We believe primary research is a very important tool in analyzing and forecasting different markets. In order to make sure accuracy of our findings, our team conducts primary interviews at every stage of research to gain deep insights into current business environment and future trends and key developments in market. This includes use of various methods such as telephonic interviews, focus groups, face to face interviews and questionnaires to validate our research from all aspects. We validate our data through primary research from key industry leaders such as CEO, product managers, marketing managers, suppliers, distributors, and consumers are frequently interviewed. These interviews provide valuable insights which help us to have better market understanding besides validating our estimates and forecast.
Data Triangulation
Industry Analysis
|
Qualitative Data |
Quantitative Data (2017-2025) |
|
|