Fluorochemicals Market by Product and Application - Global Industry Analysis and Forecast to 2022
Published On : October 2017 Pages : 125 Category: Specialty & Fine Chemicals Report Code : CM10302
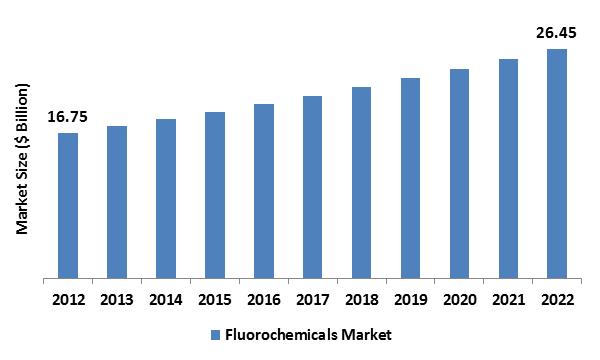
Industry Trend Analysis
In 2017, the global fluorochemicals market was valued around USD 16.75 billion and is anticipated to reach approximately USD 26.45 billion by 2022 while maintaining a compound annual growth rate (CAGR) of 4.20% during the forecast period. Increasing HVAC system installations in automotive and manufacturing sectors is anticipated to boost refrigerant application and hence prone to drive the demand of fluorochemicals in the future. High opposition to acids, bases and natural solvents presented by fluorochemicals is projected to be vital for producing demand in construction, electronics, and automotive applications during the forecast years. Though, there is a potential hazard from ammonia as an alternate product, due to its low price and regulatory growths. Hydrofluorides are predicted to experience growth owing to the growth in aluminum production, driven mainly by its escalating use in construction and automotive sector. Aluminum production demand is anticipated to grow at a compound annual growth rate of 3.8% over the forecast period, concerning volume. Implementation of Kyoto and Montreal Protocols in North America and Europe, concerning the restraint on chemicals with elevated global warming potential (GWP), is anticipated to hinder the demand of fluorocarbon including HCFC and CFC.
Product Outlook and Trend Analysis
In 2017, fluorocarbons ruled the market, reporting for around 50% of global market demand. It is likely to lose market share to the polymer and inorganic equivalents considering strict regulations in Canada and the United States to terminate HCFC and CFC compounds. Global fluoropolymers market is estimated to witness considerable growth during the forecast years, expanding at a compound annual growth rate of 10.2%, concerning volume. Growing fluoropolymer consumption in automotive, electronics, and construction industries as a result of rendering electrical insulation and high tensile strength is likely to impact the market growth positively during the projected period. In 2017, the demand for inorganic product was 986.7 kilo-tons and is anticipated to experience growth in view of rising application of aluminum fluoride, cryolite, fluorosilicate and silicofluoride in the production of aluminum and cleaning agents.
Application Outlook and Trend Analysis
In 2017, refrigerant applications ruled the global fluorochemicals market, reporting for around 40% of total market volume. Increasing significance of hygienic air systems in production industry coupled with rising HVAC system installations in vehicles is estimated to augment market growth in next few years. In 2017, demand for the component as well as other applications surpassed 1,250.0 kilo-tons and is anticipated to experience major growth taking into account the rising use in production consumables that are utilized in industrial and household appliances.
Regional Outlook and Trend Analysis
In 2017, Asia Pacific regional fluorochemicals market reported for around 45% of overall market volume. Optimistic outlook towards the automotive sector in India, Indonesia, Malaysia, and China is projected to augment the refrigerants’ applications in HVAC systems for automobiles and hence contribute to the growth of the market. The plenty of aluminum reserves in India, Australia, and China together with the regulatory preference to encourage FDI in the local metal segment is anticipated to augment its application in the future. Asia Pacific regional market is projected to experience major growth concerning volume at a compound annual growth rate of 5.2% during the forecast period. The United States government declared to terminate certain fluorochemicals counting in HCFC-142b and HCFC-22 (also called R-22) as of 2017 that is anticipated impact the market growth negatively during the forecast period.
Competitive Outlook and Trend Analysis
In 2017, four major manufacturers reported for around 40% of global fluorochemicals market. Major manufacturers are Chemours, Arkema SA, 3M, Solvay SA, Daikin Industries, Ltd., Honeywell International, Inc., Asahi Glass and Dongyue Group Ltd. Solvay started the production of NOVOLOK during July 2017 at Quzhou, China. 3M declared plans to implement an innovative non-toxic perfluorooctane-sulfonyl fluoride technology for formulating further new products in June 2017. These chemical substances can be utilized as water and oil resistant coatings. Novel product developments together with the growth of production in production units situated near or in high demand areas are anticipated to be the crucial success factors for market growth.
The global fluorochemicals market is segmented as follows :
By Product
- Fluoropolymers
- Inorganics and Specialties
- Fluorocarbons
- HFC and Others
- HCFC
By Application
- Refrigeration
- Blowing Agents
- Aluminum Production
- Components and Others
By Region
- North America
- U.S
- Canada
- Mexico
- Europe
- Germany
- France
- UK
- Italy
- Spain
- Rest of Europe
- Asia-Pacific
- Japan
- China
- Australia
- India
- South Korea
- Rest of Asia Pacific
- Rest of the World
- Brazil
- South Africa
- Saudi Arabia
- United Arab Emirates
- Others
Some of the key questions answered by the report are:
- What was the market size in 2017 and forecast from 2017 to 2022?
- What will be the industry market growth from 2017 to 2022?
- What are the major drivers, restraints, opportunities, challenges, and industry trends and their impact on the market forecast?
- What are the major segments leading the market growth and why?
- Which are the leading players in the market and what are the major strategies adopted by them to sustain the market competition?
Market Classification
- Fluorochemicals Market, By Product, Estimates and Forecast, 2012-2022 ($Million)
- Fluoropolymers
- Inorganics and Specialties
- Fluorocarbons
- HFC and Others
- HCFC
- Fluorochemicals Market, By Application, Estimates and Forecast, 2012-2022 ($Million)
- Refrigeration
- Blowing Agents
- Aluminum Production
- Components and Others
- Fluorochemicals Market, By Region, Estimates and Forecast, 2012-2022 ($Million)
- North America
- North America Fluorochemicals Market, By Country
- North America Fluorochemicals Market, By Product
- North America Fluorochemicals Market, By Application
- U.S. Fluorochemicals Market, By Product
- U.S. Fluorochemicals Market, By Application
- Canada Fluorochemicals Market, By Product
- Canada Fluorochemicals Market, By Application
- Mexico Fluorochemicals Market, By Product
- Mexico Fluorochemicals Market, By Application
-
- Europe
- Europe Fluorochemicals Market, By Country
- Europe Fluorochemicals Market, By Product
- Europe Fluorochemicals Market, By Application
- Germany Fluorochemicals Market, By Product
- Germany Fluorochemicals Market, By Application
- France Fluorochemicals Market, By Product
- France Fluorochemicals Market, By Application
- UK Fluorochemicals Market, By Product
- UK Fluorochemicals Market, By Application
- Italy Fluorochemicals Market, By Product
- Italy Fluorochemicals Market, By Application
- Spain Fluorochemicals Market, By Product
- Spain Fluorochemicals Market, By Application
- Rest of Europe Fluorochemicals Market, By Product
- Rest of Europe Fluorochemicals Market, By Application
-
- Asia-Pacific
- Asia-Pacific Fluorochemicals Market, By Country
- Asia-Pacific Fluorochemicals Market, By Product
- Asia-Pacific Fluorochemicals Market, By Application
- Japan Fluorochemicals Market, By Product
- Japan Fluorochemicals Market, By Application
- Australia Fluorochemicals Market, By Product
- Australia Fluorochemicals Market, By Application
- India Fluorochemicals Market, By Product
- India Fluorochemicals Market, By Application
- South Korea Fluorochemicals Market, By Product
- South Korea Fluorochemicals Market, By Application
- Rest of Asia-Pacific Fluorochemicals Market, By Product
- Rest of Asia-Pacific Fluorochemicals Market, By Application
- Asia-Pacific
-
- Rest of the World
- Rest of the World Fluorochemicals Market, By Country
- Rest of the World Fluorochemicals Market, By Product
- Rest of the World Fluorochemicals Market, By Application
- Brazil Fluorochemicals Market, By Product
- Brazil Fluorochemicals Market, By Application
- South Africa Fluorochemicals Market, By Product
- South Africa Fluorochemicals Market, By Application
- Saudi Arabia Fluorochemicals Market, By Product
- Saudi Arabia Fluorochemicals Market, By Application
- Turkey Fluorochemicals Market, By Product
- Turkey Fluorochemicals Market, By Application
- United Arab Emirates Fluorochemicals Market, By Product
- United Arab Emirates Fluorochemicals Market, By Application
- Others Fluorochemicals Market, By Product
- Others Fluorochemicals Market, By Application
- Rest of the World
Table of Contents
1. Introduction
1.1. Report Description
1.2. Research Methodology
1.2.1. Secondary Research
1.2.2. Primary Research
2. Executive Summary
2.1. Key Highlights
3. Market Overview
3.1. Introduction
3.1.1. Market Definition
3.1.2. Market Segmentation
3.2. Market Dynamics
3.2.1. Drivers
3.2.1.1. Increasing Demand for Refrigerants
3.2.1.2. Positive Automotive Outlook
3.2.1.3. Increasing Production of Aluminum
3.2.2. Restraints
3.2.2.1. Stringent Regulatory Policies
3.2.3. Opportunities
4. Fluorochemicals Market, By Product
4.1. Introduction
4.2. Fluorochemicals Market Assessment and Forecast, By Product, 2012-2022
4.3. Fluoropolymers
4.3.1. Market Assessment and Forecast, By Region, 2012-2022 ($Million)
4.4. Inorganics and Specialties
4.4.1. Market Assessment and Forecast, By Region, 2012-2022 ($Million)
4.5. Fluorocarbons
4.5.1. Market Assessment and Forecast, By Type, 2012-2022 ($Million)
4.5.2. Market Assessment and Forecast, By Region, 2012-2022 ($Million)
4.5.3. HFC and Others
4.5.3.1. Market Assessment and Forecast, By Region, 2012-2022 ($Million)
4.5.4. HCFC
4.5.4.1. Market Assessment and Forecast, By Region, 2012-2022 ($Million)
5. Fluorochemicals Market, By Application
5.1. Introduction
5.2. The Fluorochemicals Market Assessment and Forecast, By Application, 2012-2022
5.3. Refrigeration
5.3.1.1. Market Assessment and Forecast, By Region, 2012-2022 ($Million)
5.4. Blowing Agents
5.4.1.1. Market Assessment and Forecast, By Region, 2012-2022 ($Million)
5.5. Aluminum Production
5.5.1.1. Market Assessment and Forecast, By Region, 2012-2022 ($Million)
5.6. Components and Others
5.6.1.1. Market Assessment and Forecast, By Region, 2012-2022 ($Million)
6. Fluorochemicals Market, By Region
6.1. Introduction
6.2. Fluorochemicals Market Assessment and Forecast, By Region, 2012-2022 ($Million)
6.3. North America
6.3.1. Market Assessment and Forecast, By Country, 2012-2022 ($Million)
6.3.2. Market Assessment and Forecast, By Product, 2012-2022 ($Million)
6.3.3. Market Assessment and Forecast, By Application, 2012-2022 ($Million)
6.3.4. U.S.
6.3.4.1. Market Assessment and Forecast, By Product, 2012-2022 ($Million)
6.3.4.2. Market Assessment and Forecast, By Application, 2012-2022 ($Million)
6.3.5. Canada
6.3.5.1. Market Assessment and Forecast, By Product, 2012-2022 ($Million)
6.3.5.2. Market Assessment and Forecast, By Application, 2012-2022 ($Million)
6.3.6. Mexico
6.3.6.1. Market Assessment and Forecast, By Product, 2012-2022 ($Million)
6.3.6.2. Market Assessment and Forecast, By Application, 2012-2022 ($Million)
6.4. Europe
6.4.1. Market Assessment and Forecast, By Country, 2012-2022 ($Million)
6.4.2. Market Assessment and Forecast, By Product, 2012-2022 ($Million)
6.4.3. Market Assessment and Forecast, By Application, 2012-2022 ($Million)
6.4.4. Germany
6.4.4.1. Market Assessment and Forecast, By Product, 2012-2022 ($Million)
6.4.4.2. Market Assessment and Forecast, By Application, 2012-2022 ($Million)
6.4.5. France
6.4.5.1. Market Assessment and Forecast, By Product, 2012-2022 ($Million)
6.4.5.2. Market Assessment and Forecast, By Product, 2012-2022 ($Million)
6.4.6. UK
6.4.6.1. Market Assessment and Forecast, By Product, 2012-2022 ($Million)
6.4.6.2. Market Assessment and Forecast, By Application, 2012-2022 ($Million)
6.4.7. Italy
6.4.7.1. Market Assessment and Forecast, By Product, 2012-2022 ($Million)
6.4.7.2. Market Assessment and Forecast, By Application, 2012-2022 ($Million)
6.4.8. Spain
6.4.8.1. Market Assessment and Forecast, By Product, 2012-2022 ($Million)
6.4.8.2. Market Assessment and Forecast, By Application, 2012-2022 ($Million)
6.4.9. Rest of Europe
6.4.9.1. Market Assessment and Forecast, By Product, 2012-2022 ($Million)
6.4.9.2. Market Assessment and Forecast, By Application, 2012-2022 ($Million)
6.5. Asia-Pacific
6.5.1. Market Assessment and Forecast, By Country, 2012-2022 ($Million)
6.5.2. Market Assessment and Forecast, By Product, 2012-2022 ($Million)
6.5.3. Market Assessment and Forecast, By Application, 2012-2022 ($Million)
6.5.4. Japan
6.5.4.1. Market Assessment and Forecast, By Product, 2012-2022 ($Million)
6.5.4.2. Market Assessment and Forecast, By Application, 2012-2022 ($Million)
6.5.5. China
6.5.5.1. Market Assessment and Forecast, By Product, 2012-2022 ($Million)
6.5.5.2. Market Assessment and Forecast, By Application, 2012-2022 ($Million)
6.5.6. Australia
6.5.6.1. Market Assessment and Forecast, By Product, 2012-2022 ($Million)
6.5.6.2. Market Assessment and Forecast, By Application, 2012-2022 ($Million)
6.5.7. India
6.5.7.1. Market Assessment and Forecast, By Product, 2012-2022 ($Million)
6.5.7.2. Market Assessment and Forecast, By Application, 2012-2022 ($Million)
6.5.8. South Korea
6.5.8.1. Market Assessment and Forecast, By Product, 2012-2022 ($Million)
6.5.8.2. Market Assessment and Forecast, By Application, 2012-2022 ($Million)
6.5.9. Rest of Asia-Pacific
6.5.9.1. Market Assessment and Forecast, By Product, 2012-2022 ($Million)
6.5.9.2. Market Assessment and Forecast, By Application, 2012-2022 ($Million)
6.6. Rest of the World
6.6.1. Market Assessment and Forecast, By Country, 2012-2022 ($Million)
6.6.2. Market Assessment and Forecast, By Product, 2012-2022 ($Million)
6.6.3. Market Assessment and Forecast, By Application, 2012-2022 ($Million)
6.6.4. Brazil
6.6.4.1. Market Assessment and Forecast, By Product, 2012-2022 ($Million)
6.6.4.2. Market Assessment and Forecast, By Application, 2012-2022 ($Million)
6.6.5. Turkey
6.6.5.1. Market Assessment and Forecast, By Product, 2012-2022 ($Million)
6.6.5.2. Market Assessment and Forecast, By Application, 2012-2022 ($Million)
6.6.6. Saudi Arabia
6.6.6.1. Market Assessment and Forecast, By Product, 2012-2022 ($Million)
6.6.6.2. Market Assessment and Forecast, By Application, 2012-2022 ($Million)
6.6.7. South Africa
6.6.7.1. Market Assessment and Forecast, By Product, 2012-2022 ($Million)
6.6.7.2. Market Assessment and Forecast, By Application, 2012-2022 ($Million)
6.6.8. United Arab Emirates
6.6.8.1. Market Assessment and Forecast, By Product, 2012-2022 ($Million)
6.6.8.2. Market Assessment and Forecast, By Application, 2012-2022 ($Million)
6.6.9. Others
6.6.9.1. Market Assessment and Forecast, By Product, 2012-2022 ($Million)
6.6.9.2. Market Assessment and Forecast, By Application, 2012-2022 ($Million)
7. Company Profiles
7.1. 3M
7.1.1. Business Overview
7.1.2. Product Portfolio
7.1.3. Key Financials
7.1.4. Strategic Developments
7.2. Chemours
7.2.1. Business Overview
7.2.2. Product Portfolio
7.2.3. Key Financials
7.2.4. Strategic Developments
7.3. Asahi Glass Company
7.3.1. Business Overview
7.3.2. Product Portfolio
7.3.3. Key Financials
7.3.4. Strategic Developments
7.4. Daikin Industries Limited
7.4.1. Business Overview
7.4.2. Product Portfolio
7.4.3. Key Financials
7.4.4. Strategic Developments
7.5. Solvay S.A.
7.5.1. Business Overview
7.5.2. Product Portfolio
7.5.3. Key Financials
7.5.4. Strategic Developments
7.6. Honeywell International Inc.
7.6.1. Business Overview
7.6.2. Product Portfolio
7.6.3. Key Financials
7.6.4. Key Financials
7.6.5. Strategic Developments
7.7. Arkema
7.7.1. Business Overview
7.7.2. Product Portfolio
7.7.3. Key Financials
7.7.4. Strategic Developments
7.8. Dongyue Group Ltd.
7.8.1. Business Overview
7.8.2. Product Portfolio
7.8.3. Key Financials
7.8.4. Strategic Developments
7.9. Halocarbon Products Corporation
7.9.1. Business Overview
7.9.2. Product Portfolio
7.9.3. Key Financials
7.9.4. Strategic Developments
7.10. Pelchem SOC Ltd.
7.10.1. Business Overview
7.10.2. Product Portfolio
7.10.3. Key Financials
7.10.4. Strategic Developments
7.11. Mexichem Flúor S.A. de C.V.
7.11.1. Business Overview
7.11.2. Product Portfolio
7.11.3. Key Financials
7.11.4. Strategic Developments
List of Tables
Table 1.Global Fluorochemicals Market, By Product ($Million), 2012-2022
Table 2.Fluoropolymers Market, By Region ($Million), 2012-2022
Table 3.Inorganics and Specialties Market, By Region ($Million), 2012-2022
Table 4.Inorganics and Specialties Market, By Region ($Million), 2012-2022
Table 5.HFC and Others Market, By Region ($Million), 2012-2022
Table 6.HCFC Market, By Region ($Million), 2012-2022
Table 7.Global Fluorochemicals Market, By Application ($Million), 2012-2022
Table 8.Refrigeration Market, By Region ($Million), 2012-2022
Table 9.Blowing Agents Market, By Region ($Million), 2012-2022
Table 10.Aluminum Production Market, By Region ($Million), 2012-2022
Table 11.Components and Others Market, By Region ($Million), 2012-2022
Table 12.Fluorochemicals Market, By Region ($Million), 2012-2022
Table 13.North America Fluorochemicals Market, By Country, 2012-2022 ($Million)
Table 14.North America Fluorochemicals Market, By Product, 2012-2022 ($Million)
Table 15.North America Fluorochemicals Market, By Application, 2012-2022 ($Million)
Table 16.U.S. Fluorochemicals Market, by Product, 2012-2022 ($Million)
Table 17.U.S. Fluorochemicals Market, by Application, 2012-2022 ($Million)
Table 18.Canada Fluorochemicals Market, By Product, 2012-2022 ($Million)
Table 19.Canada Fluorochemicals Market, By Application, 2012-2022 ($Million)
Table 20.Mexico Fluorochemicals Market, By Product, 2012-2022 ($Million)
Table 21.Mexico Fluorochemicals Market, By Application, 2012-2022 ($Million)
Table 22.Europe Fluorochemicals Market, By Country, 2012-2022 ($Million)
Table 23.Europe Fluorochemicals Market, By Product, 2012-2022 ($Million)
Table 24.Europe Fluorochemicals Market, By Application, 2012-2022 ($Million)
Table 24.Germany Fluorochemicals Market, By Product, 2012-2022 ($Million)
Table 25.Germany Fluorochemicals Market, By Application, 2012-2022 ($Million)
Table 26.France Fluorochemicals Market, By Product, 2012-2022 ($Million)
Table 27.France Fluorochemicals Market, By Application, 2012-2022 ($Million)
Table 28.UK Fluorochemicals Market, By Product, 2012-2022 ($Million)
Table 29.UK Fluorochemicals Market, By Application, 2012-2022 ($Million)
Table 30.Italy Fluorochemicals Market, By Product, 2012-2022 ($Million)
Table 31.Italy Fluorochemicals Market, By Application, 2012-2022 ($Million)
Table 32.Spain Fluorochemicals Market, By Product, 2012-2022 ($Million)
Table 33.Spain Fluorochemicals Market, By Application, 2012-2022 ($Million)
Table 36.Rest of Europe Fluorochemicals Market, By Product, 2012-2022 ($Million)
Table 37.Rest of Europe Fluorochemicals Market, By Application, 2012-2022 ($Million)
Table 38.Asia-Pacific Fluorochemicals Market, By Country, 2012-2022 ($Million)
Table 39.Asia-Pacific Fluorochemicals Market, By Product, 2012-2022 ($Million)
Table 40.Asia-Pacific Fluorochemicals Market, By Application, 2012-2022 ($Million)
Table 41.Japan Fluorochemicals Market, By Product, 2012-2022 ($Million)
Table 42.Japan Fluorochemicals Market, By Application, 2012-2022 ($Million)
Table 43.China Fluorochemicals Market, By Product, 2012-2022 ($Million)
Table 44.China Fluorochemicals Market, By Application, 2012-2022 ($Million)
Table 45.Australia Fluorochemicals Market, By Product, 2012-2022 ($Million)
Table 46.Australia Fluorochemicals Market, By Application, 2012-2022 ($Million)
Table 47.India Fluorochemicals Market, By Product, 2012-2022 ($Million)
Table 48.India Fluorochemicals Market, By Application, 2012-2022 ($Million)
Table 49.South Korea Fluorochemicals Market, By Product, 2012-2022 ($Million)
Table 50.South Korea Fluorochemicals Market, By Application, 2012-2022 ($Million)
Table 53.Rest of Asia-Pacific Fluorochemicals Market, By Product, 2012-2022 ($Million)
Table 54.Rest of Asia-Pacific Fluorochemicals Market, By Application, 2012-2022 ($Million)
Table 55.Rest of the World Fluorochemicals Market, By Country, 2012-2022 ($Million)
Table 56.Rest of the World Fluorochemicals Market, By Product, 2012-2022 ($Million)
Table 57.Rest of the World Fluorochemicals Market, By Application, 2012-2022 ($Million)
Table 58.Brazil Fluorochemicals Market, By Product, 2012-2022 ($Million)
Table 59.Brazil Fluorochemicals Market, By Application, 2012-2022 ($Million)
Table 60.Turkey Fluorochemicals Market, By Product, 2012-2022 ($Million)
Table 61.Turkey Fluorochemicals Market, By Application, 2012-2022 ($Million)
Table 62.Saudi Arabia Fluorochemicals Market, By Product, 2012-2022 ($Million)
Table 63.Saudi Arabia Fluorochemicals Market, By Application, 2012-2022 ($Million)
Table 64.South Africa Fluorochemicals Market, By Product, 2012-2022 ($Million)
Table 65.South Africa Fluorochemicals Market, By Application, 2012-2022 ($Million)
Table 66.United Arab Emirates Fluorochemicals Market, By Product, 2012-2022 ($Million)
Table 67.United Arab Emirates Fluorochemicals Market, By Application, 2012-2022 ($Million)
Table 68.Others Fluorochemicals Market, By Product, 2012-2022 ($Million)
Table 71.Others Fluorochemicals Market, By Application, 2012-2022 ($Million)
Table 72.3M: Key Strategic Developments, 2017-2017
Table 73.DuPont: Key Strategic Developments, 2017-2017
Table 74.Asahi Glass Company: Key Strategic Developments, 2017-2017
Table 75.Daikin Industries Limited: Key Strategic Developments, 2017-2017
Table 76.Solvay S.A.: Key Strategic Developments, 2017-2017
Table 77.Honeywell International Inc.: Key Strategic Developments, 2017-2017
Table 78.Arkema: Key Strategic Developments, 2017-2017
Table 79.Dongyue Group Ltd.: Key Strategic Developments, 2017-2017
Table 80.Halocarbon Products Corporation: Key Strategic Developments, 2017-2017
Table 81.Pelchem SOC Ltd.: Key Strategic Developments, 2017-2017
Table 82.Mexichem Flúor S.A. de C.V.: Key Strategic Developments, 2017-2017
List of Figures
Figure 1.Global Fluorochemicals Market Share, By Product, 2012 & 2022
Figure 2.Fluorochemicals Market, By Application, 2012 & 2022, ($Million)
Figure 3.Fluorochemicals Market, By Region, 2012 & 2022, ($Million)
Figure 4.3M: Net Revenues, 2017-2017 ($Million)
Figure 5.3M: Net Revenue Share, By Segment, 2017
Figure 6.3M: Net Revenue Share, By Geography, 2017
Figure 7.DuPont: Net Revenues, 2017-2017 ($Million)
Figure 8.DuPont: Net Revenue Share, By Segment, 2017
Figure 9.DuPont: Net Revenue Share, By Geography, 2017
Figure 10.Asahi Glass Company: Net Revenues, 2017-2017 ($Million)
Figure 11.Asahi Glass Company: Net Revenue Share, By Segment, 2017
Figure 12.Asahi Glass Company: Net Revenue Share, By Geography, 2017
Figure 13.Daikin Industries Limited: Net Revenues, 2017-2017 ($Million)
Figure 14.Daikin Industries Limited: Net Revenue Share, By Segment, 2017
Figure 15.Daikin Industries Limited: Net Revenue Share, By Geography, 2017
Figure 16.Solvay S.A.: Net Revenues, 2017-2017 ($Million)
Figure 17.Solvay S.A.: Net Revenue Share, By Segment, 2017
Figure 18.Solvay S.A.: Net Revenue Share, By Geography, 2017
Figure 16.Honeywell International Inc..: Net Revenues, 2017-2017 ($Million)
Figure 17.Honeywell International Inc..: Net Revenue Share, By Segment, 2017
Figure 18.Honeywell International Inc..: Net Revenue Share, By Geography, 2017
Figure 16.Arkema: Net Revenues, 2017-2017 ($Million)
Figure 17.Arkema: Net Revenue Share, By Segment, 2017
Figure 18.Arkema: Net Revenue Share, By Geography, 2017
Figure 16.Dongyue Group Ltd.: Net Revenues, 2017-2017 ($Million)
Figure 17.Dongyue Group Ltd.: Net Revenue Share, By Segment, 2017
Figure 18.Dongyue Group Ltd.: Net Revenue Share, By Geography, 2017
Figure 16.Halocarbon Products Corporation: Net Revenues, 2017-2017 ($Million)
Figure 17.Halocarbon Products Corporation: Net Revenue Share, By Segment, 2017
Figure 18.Halocarbon Products Corporation: Net Revenue Share, By Geography, 2017
Research Methodology
We use both primary as well as secondary research for our market surveys, estimates and for developing forecast. Our research process commence by analyzing the problem which enable us to design the scope for our research study. Our research process is uniquely designed with enough flexibility to adjust according to changing nature of products and markets, while retaining core element to ensure reliability and accuracy in research findings. We understand both macro and micro-economic factors to evaluate and forecast different market segments.
Data Mining
Data is extensively collected through various secondary sources such as annual reports, investor presentations, SEC filings, and other corporate publications. We also refer trade magazines, technical journals, paid databases such as Factiva and Bloomberg, industry trade journals, scientific journals, and social media data to understand market dynamics and industry trends. Further, we also conduct primary research to understand market drivers, restraints, opportunities, challenges, and competitive scenario to build our analysis.
Data Collection Matrix
|
Data Collection Matrix |
Supply Side |
Demand Side |
|
Primary Data Sources |
|
|
|
Secondary Data Sources |
|
|
Market Modeling and Forecasting
We use epidemiology and capital equipment-based models to forecast market size of different segments at country and regional level.
- Epidemiology-based Forecasting Model: This method uses epidemiology data gathered through various publications and from physicians to estimate population of patients, flow of treatment of individual disease and therapies. The data collected through this method includes statics on incidence of disease, population suffering from disease, and treatment population. This method is used to understand:
- Number of patients for particular device or medical procedure and
- Repeated use of particular device depending on health and condition of patient
- Capital-based Forecasting Model: This method of forecasting is based on number of replacements, installed-based and new sales of capital equipment used in various healthcare and diagnostic centers. These three parameters are calculated and forecast is developed. Installation base is calculated as average number of units per facility; while sales for particular year is calculated from number of new and replace units. Secondary data is collected through various supply chain intermediaries and opinion leaders to arrive at installation and sales rate. These techniques help our analysts in validating market and developed market estimates and forecast.
We do forecast on basis of several parameters such as market drivers, market opportunities, industry trends government regulations, raw materials supply and trade dynamics to ensure relevance of forecast with market scenario. With increasing need to granulized information, we used bottom-up methodology for forecasting where we evaluate each regional segment differently and combined all forecast to develop final market forecast.
Data Validation
We believe primary research is a very important tool in analyzing and forecasting different markets. In order to make sure accuracy of our findings, our team conducts primary interviews at every stage of research to gain deep insights into current business environment and future trends and key developments in market. This includes use of various methods such as telephonic interviews, focus groups, face to face interviews and questionnaires to validate our research from all aspects. We validate our data through primary research from key industry leaders such as CEO, product managers, marketing managers, suppliers, distributors, and consumers are frequently interviewed. These interviews provide valuable insights which help us to have better market understanding besides validating our estimates and forecast.
Data Triangulation

Industry Analysis
|
Qualitative Data |
Quantitative Data (2017-2025) |
|
|