Dental Bone Graft Substitutes Market by Product and Application - Global Industry Analysis and Forecast to 2027
Published On : August 2017 Pages : 98 Category: Medical Devices Report Code : HC08191
Industry Trend Analysis
The global dental bone graft substitutes market is expected to be around $1 billion by 2027. The market is primarily driven by factors such as increased prevalence of dental cavities and periodontal diseases, high prevalence of geriatric population and rising demand for minimally invasive dental procedures. Moreover, significant increase in incidences of dental fractures in recent years and availability of products with high osteoconductive and osteoinductive properties will also largely contribute to the increasing demand for dental bone graft substitutes during the forecast period. However, factors such as high cost of dental bone grafting procedures and stringent regulatory policies can hamper the growth of global dental bone graft substitutes market during the forecast period.
Product Outlook and Trend Analysis
The xenograft segment accounted for the major share of the dental bone graft substitutes market in 2017 due to their abundant availability. Xenografts are bone grafts extracted from other species which usually include porcine (pig) or bovine (cow) origin. As molecular structure of bone is similar across different species, xenografts can be efficiently used for dental bone grafts. Due to recent technological advancements in the field of dentistry, the use of tissue engineered and synthetic bone grafts is increasing considerably, thus contributing to the growth of global dental bone graft substitutes market.
Application Outlook and Trend Analysis
The socket preservation segment held the largest share of the global dental bone graft substitutes market in 2017 due to increasing number of tooth extraction procedures across the world. Socket preservation is a procedure which reduces the soft tissue and bone loss after a tooth extraction procedure. As tooth extraction can significantly impact the facial bone height, socket preservation is performed immediately after tooth extraction.
Regional Outlook and Trend Analysis
Europe accounted for the major share of the global dental bone graft substitutes market in 2017 owing to high incidences of periodontal diseases, significant increase in geriatric population and substantial expenditure on research and development in the field of implant dentistry. Asia-Pacific dental bone graft substitutes market is expected to witness lucrative growth over the forecast period due to increased disposable income in emerging nations such China and India and rising awareness about dental diseases and available treatment options.
Competitive Analysis
The major players operating in the global dental bone graft substitutes market focus on product development to develop and commercialize advanced bone grafts in the market. Also, strategic acquisitions and mergers ensure a competitive position for the key players in the market through expansion of existing product portfolios. In line to this strategy, in February 2017, DENTSPLY International Inc. and Sirona Dental Systems, Inc. merged to form Dentsply Sirona International. This merger enabled Dentsply Sirona to focus its efforts on providing better dental care. Some of the key players in the global dental bone graft substitutes market are, Graftys SA, Collagen Matrix, Inc., LifeNet Health, Sunstar Americas, Inc. (a part of Sunstar Group), Ed. Geistlich Söhne AG, NovaBone Products, LLC, Institut Straumann AG, Curasan AG, Zimmer Biomet Holdings, Inc., DENTSPLY SIRONA Inc., Medtronic plc, BioHorizons, Inc., ACE Surgical Supply Company, Inc., Dentium USA and Genoss Co., Ltd.
Market Opportunities
With increasing awareness related to dental disorders and availability of treatment options in emerging markets, the key players in the global dental bone graft substitutes market have immense growth opportunities in emerging countries such as China and India. Also, increase in disposable income in these countries will boost the demand for dental bone graft substitutes in coming years.
Dental Bone Graft Substitutes Market Segmentation:
By Product:
- Demineralized Allograft
- Allograft
- Xenograft
- Synthetic Bone Graft
By Application:
- Periodontal Defect Regeneration
- Sinus Lift
- Socket Preservation
- Implant Bone Regeneration
- Ridge Augmentation
- Others
By Region:
- North America
- U.S
- Canada
- Mexico
- Europe
- Germany
- France
- UK
- Italy
- Spain
- Rest of Europe
- Asia-Pacific
- Japan
- China
- Australia
- India
- South Korea
- Rest of Asia-Pacific
- Rest of the World
- Brazil
- South Africa
- Saudi Arabia
- Turkey
- United Arab Emirates
- Others
Some of the key questions answered by the report are:
- What was the market size in 2017 and forecast from 2022 to 2027?
- What will be the industry market growth from 2022 to 2027?
- What are the major drivers, restraints, opportunities, challenges, and industry trends and their impact on the market forecast?
- What are the major segments leading the market growth and why?
- Which are the leading players in the market and what are the major strategies adopted by them to sustain the market competition?
Market Classification
- Dental Bone Graft Substitutes Market, By Product, Estimates and Forecast, 2017-2027 ($Million)
- Demineralized Allograft
- Allograft
- Xenograft
- Synthetic Bone Graft
- Dental Bone Graft Substitutes Market, By Application, Estimates and Forecast, 2017-2027 ($Million)
- Periodontal Defect Regeneration
- Sinus Lift
- Socket Preservation
- Implant Bone Regeneration
- Ridge Augmentation
- Others
- Dental Bone Graft Substitutes Market, By Region, Estimates and Forecast, 2017-2027 ($Million)
- North America
- North America Dental Bone Graft Substitutes Market, By Country
- North America Dental Bone Graft Substitutes Market, By Product
- North America Dental Bone Graft Substitutes Market, By Application
- U.S. Dental Bone Graft Substitutes Market, By Product
- U.S. Dental Bone Graft Substitutes Market, By Application
- Canada Dental Bone Graft Substitutes Market, By Product
- Canada Dental Bone Graft Substitutes Market, By Application
- Mexico Dental Bone Graft Substitutes Market, By Product
- Mexico Dental Bone Graft Substitutes Market, By Application
-
- Europe
- Europe Dental Bone Graft Substitutes Market, By Country
- Europe Dental Bone Graft Substitutes Market, By Product
- Europe Dental Bone Graft Substitutes Market, By Application
- Germany Dental Bone Graft Substitutes Market, By Product
- Germany Dental Bone Graft Substitutes Market, By Application
- France Dental Bone Graft Substitutes Market, By Product
- France Dental Bone Graft Substitutes Market, By Application
- UK Dental Bone Graft Substitutes Market, By Product
- UK Dental Bone Graft Substitutes Market, By Application
- Italy Dental Bone Graft Substitutes Market, By Product
- Italy Dental Bone Graft Substitutes Market, By Application
- Spain Dental Bone Graft Substitutes Market, By Product
- Spain Dental Bone Graft Substitutes Market, By Application
- Rest of Europe Dental Bone Graft Substitutes Market, By Product
- Rest of Europe Dental Bone Graft Substitutes Market, By Application
-
- Asia-Pacific
- Asia-Pacific Dental Bone Graft Substitutes Market, By Country
- Asia-Pacific Dental Bone Graft Substitutes Market, By Product
- Asia-Pacific Dental Bone Graft Substitutes Market, By Application
- Japan Dental Bone Graft Substitutes Market, By Product
- Japan Dental Bone Graft Substitutes Market, By Application
- Australia Dental Bone Graft Substitutes Market, By Product
- Australia Dental Bone Graft Substitutes Market, By Application
- India Dental Bone Graft Substitutes Market, By Product
- India Dental Bone Graft Substitutes Market, By Application
- South Korea Dental Bone Graft Substitutes Market, By Product
- South Korea Dental Bone Graft Substitutes Market, By Application
- Rest of Asia-Pacific Dental Bone Graft Substitutes Market, By Product
- Rest of Asia-Pacific Dental Bone Graft Substitutes Market, By Application
- Asia-Pacific
-
- Rest of the World
- Rest of the World Dental Bone Graft Substitutes Market, By Country
- Rest of the World Dental Bone Graft Substitutes Market, By Product
- Rest of the World Dental Bone Graft Substitutes Market, By Application
- Brazil Dental Bone Graft Substitutes Market, By Product
- Brazil Dental Bone Graft Substitutes Market, By Application
- South Africa Dental Bone Graft Substitutes Market, By Product
- South Africa Dental Bone Graft Substitutes Market, By Application
- Saudi Arabia Dental Bone Graft Substitutes Market, By Product
- Saudi Arabia Dental Bone Graft Substitutes Market, By Application
- Turkey Dental Bone Graft Substitutes Market, By Product
- Turkey Dental Bone Graft Substitutes Market, By Application
- United Arab Emirates Dental Bone Graft Substitutes Market, By Product
- United Arab Emirates Dental Bone Graft Substitutes Market, By Application
- Others Dental Bone Graft Substitutes Market, By Product
- Others Dental Bone Graft Substitutes Market, By Application
- Rest of the World
Table of Contents
1. Introduction
1.1. Report Description
1.2. Research Methodology
1.2.1. Secondary Research
1.2.2. Primary Research
2. Executive Summary
2.1. Key Highlights
3. Market Overview
3.1. Introduction
3.1.1. Market Definition
3.1.2. Market Segmentation
3.2. Market Share Analysis
3.3. Market Dynamics
3.3.1. Drivers
3.3.1.1. Growing Geriatric Population
3.3.1.2. Increasing Disposable Income in Emerging Economies
3.3.1.3. High Prevalence of Periodontal Diseases and Dental Cavities
3.3.1.4. Increasing Demand for Minimally Invasive Procedures
3.3.2. Restraints
3.3.2.1. High Cost of Bone Grafting Procedures
3.3.2.2. Stringent Regulatory Procedures
3.3.3. Opportunities
3.3.3.1. Emerging Markets to Offer Lucrative Growth Opportunities
4. Dental Bone Graft Substitutes market, By Product
4.1. Introduction
4.2. The Dental Bone Graft Substitutes market Assessment and Forecast, By Product, 2017-2027
4.3. Demineralized Allograft
4.3.1. Market Assessment and Forecast, By Region, 2017-2027 ($Million)
4.4. Allograft
4.4.1. Market Assessment and Forecast, By Region, 2017-2027 ($Million)
4.5. Xenograft
4.5.1. Market Assessment and Forecast, By Region, 2017-2027 ($Million)
4.6. Synthetic Bone Graft
4.6.1. Market Assessment and Forecast, By Region, 2017-2027 ($Million)
5. Dental Bone Graft Substitutes Market, By Application
5.1. Introduction
5.2. Dental Bone Graft Substitutes market Assessment and Forecast, By Application, 2017-2027
5.3. Periodontal Defect Regeneration
5.3.1. Market Assessment and Forecast, By Region, 2017-2027 ($Million)
5.4. Sinus Lift
5.4.1. Market Assessment and Forecast, By Region, 2017-2027 ($Million)
5.5. Socket Preservation
5.5.1. Market Assessment and Forecast, By Region, 2017-2027 ($Million)
5.6. Implant Bone Regeneration
5.6.1. Market Assessment and Forecast, By Region, 2017-2027 ($Million)
5.7. Ridge Augmentation
5.7.1. Market Assessment and Forecast, By Region, 2017-2027 ($Million)
5.8. Other Applications
5.8.1. Market Assessment and Forecast, By Region, 2017-2027 ($Million)
6. Dental Bone Graft Substitutes Market, By Region
6.1. Introduction
6.2. Dental Bone Graft Substitutes Market Assessment and Forecast, By Product, 2017-2027 ($Million)
6.3. Dental Bone Graft Substitutes Market Assessment and Forecast, By Application, 2017-2027 ($Million)
6.4. North America
6.4.1. Market Assessment and Forecast, By Country, 2017-2027 ($Million)
6.4.2. Market Assessment and Forecast, By Product, 2017-2027 ($Million)
6.4.3. Market Assessment and Forecast, By Application, 2017-2027 ($Million)
6.4.3.1. U.S.
6.4.3.1.1. Market Assessment and Forecast, By Product, 2017-2027 ($Million)
6.4.3.1.2. Market Assessment and Forecast, By Application, 2017-2027 ($Million)
6.4.3.2. Canada
6.4.3.2.1. Market Assessment and Forecast, By Product, 2017-2027 ($Million)
6.4.3.2.2. Market Assessment and Forecast, By Application, 2017-2027 ($Million)
6.4.3.3. Mexico
6.4.3.3.1. Market Assessment and Forecast, By Product, 2017-2027 ($Million)
6.4.3.3.2. Market Assessment and Forecast, By Application, 2017-2027 ($Million)
6.5. Europe
6.5.1. Market Assessment and Forecast, By Country, 2017-2027 ($Million)
6.5.2. Market Assessment and Forecast, By Product, 2017-2027 ($Million)
6.5.3. Market Assessment and Forecast, By Application, 2017-2027 ($Million)
6.5.3.1. Germany
6.5.3.1.1. Market Assessment and Forecast, By Product, 2017-2027 ($Million)
6.5.3.1.2. Market Assessment and Forecast, By Application, 2017-2027 ($Million)
6.5.3.2. France
6.5.3.2.1. Market Assessment and Forecast, By Product, 2017-2027 ($Million)
6.5.3.2.2. Market Assessment and Forecast, By Product, 2017-2027 ($Million)
6.5.3.3. UK
6.5.3.3.1. Market Assessment and Forecast, By Product, 2017-2027 ($Million)
6.5.3.3.2. Market Assessment and Forecast, By Application, 2017-2027 ($Million)
6.5.3.4. Italy
6.5.3.4.1. Market Assessment and Forecast, By Product, 2017-2027 ($Million)
6.5.3.4.2. Market Assessment and Forecast, By Application, 2017-2027 ($Million)
6.5.3.5. Spain
6.5.3.5.1. Market Assessment and Forecast, By Product, 2017-2027 ($Million)
6.5.3.5.2. Market Assessment and Forecast, By Application, 2017-2027 ($Million)
6.5.3.6. Russia
6.5.3.6.1. Market Assessment and Forecast, By Product, 2017-2027 ($Million)
6.5.3.6.2. Market Assessment and Forecast, By Application, 2017-2027 ($Million)
6.5.3.7. Rest of Europe
6.5.3.7.1. Market Assessment and Forecast, By Product, 2017-2027 ($Million)
6.5.3.7.2. Market Assessment and Forecast, By Application, 2017-2027 ($Million)
6.6. Asia-Pacific
6.6.1. Market Assessment and Forecast, By Country, 2017-2027 ($Million)
6.6.2. Market Assessment and Forecast, By Product, 2017-2027 ($Million)
6.6.3. Market Assessment and Forecast, By Application, 2017-2027 ($Million)
6.6.3.1. Japan
6.6.3.1.1. Market Assessment and Forecast, By Product, 2017-2027 ($Million)
6.6.3.1.2. Market Assessment and Forecast, By Application, 2017-2027 ($Million)
6.6.3.2. China
6.6.3.2.1. Market Assessment and Forecast, By Product, 2017-2027 ($Million)
6.6.3.2.2. Market Assessment and Forecast, By Application, 2017-2027 ($Million)
6.6.3.3. Australia
6.6.3.3.1. Market Assessment and Forecast, By Product, 2017-2027 ($Million)
6.6.3.3.2. Market Assessment and Forecast, By Application, 2017-2027 ($Million)
6.6.3.4. India
6.6.3.4.1. Market Assessment and Forecast, By Product, 2017-2027 ($Million)
6.6.3.4.2. Market Assessment and Forecast, By Application, 2017-2027 ($Million)
6.6.3.5. South Korea
6.6.3.5.1. Market Assessment and Forecast, By Product, 2017-2027 ($Million)
6.6.3.5.2. Market Assessment and Forecast, By Application, 2017-2027 ($Million)
6.6.3.6. Taiwan
6.6.3.6.1. Market Assessment and Forecast, By Product, 2017-2027 ($Million)
6.6.3.6.2. Market Assessment and Forecast, By Application, 2017-2027 ($Million)
6.6.3.7. Rest of Asia-Pacific
6.6.3.7.1. Market Assessment and Forecast, By Product, 2017-2027 ($Million)
6.6.3.7.2. Market Assessment and Forecast, By Application, 2017-2027 ($Million)
6.7. Rest of the World
6.7.1. Market Assessment and Forecast, By Country, 2017-2027 ($Million)
6.7.2. Market Assessment and Forecast, By Product, 2017-2027 ($Million)
6.7.3. Market Assessment and Forecast, By Application, 2017-2027 ($Million)
6.7.3.1. Brazil
6.7.3.1.1. Market Assessment and Forecast, By Product, 2017-2027 ($Million)
6.7.3.1.2. Market Assessment and Forecast, By Application, 2017-2027 ($Million)
6.7.3.2. Turkey
6.7.3.2.1. Market Assessment and Forecast, By Product, 2017-2027 ($Million)
6.7.3.2.2. Market Assessment and Forecast, By Application, 2017-2027 ($Million)
6.7.3.3. Saudi Arabia
6.7.3.3.1. Market Assessment and Forecast, By Product, 2017-2027 ($Million)
6.7.3.3.2. Market Assessment and Forecast, By Application, 2017-2027 ($Million)
6.7.3.4. South Africa
6.7.3.4.1. Market Assessment and Forecast, By Product, 2017-2027 ($Million)
6.7.3.4.2. Market Assessment and Forecast, By Application, 2017-2027 ($Million)
6.7.3.5. United Arab Emirates
6.7.3.5.1. Market Assessment and Forecast, By Product, 2017-2027 ($Million)
6.7.3.5.2. Market Assessment and Forecast, By Application, 2017-2027 ($Million)
6.7.3.6. Others
6.7.3.6.1. Market Assessment and Forecast, By Product, 2017-2027 ($Million)
6.7.3.6.2. Market Assessment and Forecast, By Application, 2017-2027 ($Million)
7. Company Profiles
7.1. Graftys SA
7.1.1. Business Overview
7.1.2. Product Portfolio
7.1.3. Strategic Developments
7.2. Collagen Matrix, Inc.
7.2.1. Business Overview
7.2.2. Product Portfolio
7.2.3. Strategic Developments
7.3. LifeNet Health
7.3.1. Business Overview
7.3.2. Product Portfolio
7.3.3. Strategic Developments
7.4. Sunstar Americas, Inc. (a part of Sunstar Group)
7.4.1. Business Overview
7.4.2. Product Portfolio
7.4.3. Key Financials
7.4.4. Strategic Developments
7.5. Ed. Geistlich Söhne AG
7.5.1. Business Overview
7.5.2. Product Portfolio
7.5.3. Strategic Developments
7.6. NovaBone Products, LLC
7.6.1. Business Overview
7.6.2. Product Portfolio
7.6.3. Strategic Developments
7.7. Institut Straumann AG
7.7.1. Business Overview
7.7.2. Product Portfolio
7.7.3. Key Financials
7.7.4. Strategic Developments
7.8. Curasan AG
7.8.1. Business Overview
7.8.2. Product Portfolio
7.8.3. Key Financials
7.8.4. Strategic Developments
7.9. Zimmer Biomet Holdings, Inc.
7.9.1. Business Overview
7.9.2. Product Portfolio
7.9.3. Key Financials
7.9.4. Strategic Developments
7.10. DENTSPLY SIRONA Inc.
7.10.1. Business Overview
7.10.2. Product Portfolio
7.10.3. Key Financials
7.10.4. Strategic Developments
7.11. Medtronic plc
7.11.1. Business Overview
7.11.2. Product Portfolio
7.11.3. Key Financials
7.11.4. Strategic Developments
7.12. BioHorizons, Inc.
7.12.1. Business Overview
7.12.2. Product Portfolio
7.12.3. Strategic Developments
7.13. ACE Surgical Supply Company, Inc.
7.13.1. Business Overview
7.13.2. Product Portfolio
7.13.3. Strategic Developments
7.14. Dentium USA
7.14.1. Business Overview
7.14.2. Product Portfolio
7.14.3. Strategic Developments
7.15. Genoss Co., Ltd.
7.15.1. Business Overview
7.15.2. Product Portfolio
7.15.3. Strategic Developments
List of Tables
Table 1.Dental Bone Graft Substitutes Market, By Product, 2017-2025 ($Million)
Table 2.Demineralized Allograft Market, By Region ($Million), 2017-2025 ($Million)
Table 3.Allograft Market, By Region ($Million), 2017-2025 ($Million)
Table 4.Xenograft Market, By Region ($Million), 2017-2025 ($Million)
Table 5.Synthetic Bone Graft Market, By Region, 2017-2025 ($Million)
Table 6.Dental Bone Graft Substitutes Market, By Application, 2017-2025 ($Million)
Table 7.Periodontal Defect Regeneration Market, By Region, 2017-2025 ($Million)
Table 8.Sinus Lift Market, By Region, 2017-2025 ($Million)
Table 9 Socket Preservation Market, By Region, 2017-2025 ($Million)
Table 10.Implant Bone Regeneration Market, By Region, 2017-2025, ($Million)
Table 11.Ridge Augmentation Market, By Region, 2017-2025, ($Million)
Table 12. Other Applications Market, By Region, 2017-2025, ($Million)
Table 17.Dental Bone Graft Substitutes Market, By Region, 2017-2025 ($Million)
Table 18.North America Dental Bone Graft Substitutes Market, By Country, 2017-2025 ($Million)
Table 19.North America Dental Bone Graft Substitutes Market, By Product, 2017-2025 ($Million)
Table 20.North America Dental Bone Graft Substitutes Market, By Application, 2017-2025 ($Million)
Table 21.U.S. Dental Bone Graft Substitutes Market, by Product, 2017-2025 ($Million)
Table 22.U.S. Dental Bone Graft Substitutes Market, by Application, 2017-2025 ($Million)
Table 23.Canada Dental Bone Graft Substitutes Market, By Product, 2017-2025 ($Million)
Table 24.Canada Dental Bone Graft Substitutes Market, By Application, 2017-2025 ($Million)
Table 25.Mexico Dental Bone Graft Substitutes Market, By Product, 2017-2025 ($Million)
Table 26.Mexico Dental Bone Graft Substitutes Market, By Application, 2017-2025 ($Million)
Table 27.Europe Dental Bone Graft Substitutes Market, By Country, 2017-2025 ($Million)
Table 28.Europe Dental Bone Graft Substitutes Market, By Product, 2017-2025 ($Million)
Table 29.Europe Dental Bone Graft Substitutes Market, By Application, 2017-2025 ($Million)
Table 30.Germany Dental Bone Graft Substitutes Market, By Product, 2017-2025 ($Million)
Table 31.Germany Dental Bone Graft Substitutes Market, By Application, 2017-2025 ($Million)
Table 32.France Dental Bone Graft Substitutes Market, By Product, 2017-2025 ($Million)
Table 33.France Dental Bone Graft Substitutes Market, By Application, 2017-2025 ($Million)
Table 34.UK Dental Bone Graft Substitutes Market, By Product, 2017-2025 ($Million)
Table 35.UK Dental Bone Graft Substitutes Market, By Application, 2017-2025 ($Million)
Table 36.Italy Dental Bone Graft Substitutes Market, By Product, 2017-2025 ($Million)
Table 37.Italy Dental Bone Graft Substitutes Market, By Application, 2017-2025 ($Million)
Table 38.Spain Dental Bone Graft Substitutes Market, By Product, 2017-2025 ($Million)
Table 39.Spain Dental Bone Graft Substitutes Market, By Application, 2017-2025 ($Million)
Table 40.Russia Dental Bone Graft Substitutes Market, By Product, 2017-2025 ($Million)
Table 41.Russia Dental Bone Graft Substitutes Market, By Application, 2017-2025 ($Million)
Table 42.Rest of Europe Dental Bone Graft Substitutes Market, By Product, 2017-2025 ($Million)
Table 43.Rest of Europe Dental Bone Graft Substitutes Market, By Application, 2017-2025 ($Million)
Table 44.Asia-Pacific Dental Bone Graft Substitutes Market, By Country, 2017-2025 ($Million)
Table 45.Asia-Pacific Dental Bone Graft Substitutes Market, By Product, 2017-2025 ($Million)
Table 46.Asia-Pacific Dental Bone Graft Substitutes Market, By Application, 2017-2025 ($Million)
Table 47.Japan Dental Bone Graft Substitutes Market, By Product, 2017-2025 ($Million)
Table 48.Japan Dental Bone Graft Substitutes Market, By Application, 2017-2025 ($Million)
Table 49.China Dental Bone Graft Substitutes Market, By Product, 2017-2025 ($Million)
Table 50.China Dental Bone Graft Substitutes Market, By Application, 2017-2025 ($Million)
Table 51.Australia Dental Bone Graft Substitutes Market, By Product, 2017-2025 ($Million)
Table 52.Australia Dental Bone Graft Substitutes Market, By Application, 2017-2025 ($Million)
Table 53.India Dental Bone Graft Substitutes Market, By Product, 2017-2025 ($Million)
Table 54.India Dental Bone Graft Substitutes Market, By Application, 2017-2025 ($Million)
Table 55.South Korea Dental Bone Graft Substitutes Market, By Product, 2017-2025 ($Million)
Table 56.South Korea Dental Bone Graft Substitutes Market, By Application, 2017-2025 ($Million)
Table 57.Taiwan Dental Bone Graft Substitutes Market, By Product, 2017-2025 ($Million)
Table 58.Taiwan Dental Bone Graft Substitutes Market, By Application, 2017-2025 ($Million)
Table 59.Rest of Asia-Pacific Dental Bone Graft Substitutes Market, By Product, 2017-2025 ($Million)
Table 60.Rest of Asia-Pacific Dental Bone Graft Substitutes Market, By Application, 2017-2025 ($Million)
Table 61.Rest of the World Dental Bone Graft Substitutes Market, By Country, 2017-2025 ($Million)
Table 62.Rest of the World Dental Bone Graft Substitutes Market, By Product, 2017-2025 ($Million)
Table 63.Rest of the World Dental Bone Graft Substitutes Market, By Application, 2017-2025 ($Million)
Table 64.Brazil Dental Bone Graft Substitutes Market, By Product, 2017-2025 ($Million)
Table 65.Brazil Dental Bone Graft Substitutes Market, By Application, 2017-2025 ($Million)
Table 66.Turkey Dental Bone Graft Substitutes Market, By Product, 2017-2025 ($Million)
Table 67.Turkey Dental Bone Graft Substitutes Market, By Application, 2017-2025 ($Million)
Table 68.Saudi Arabia Dental Bone Graft Substitutes Market, By Product, 2017-2025 ($Million)
Table 69.Saudi Arabia Dental Bone Graft Substitutes Market, By Application, 2017-2025 ($Million)
Table 70.South Africa Dental Bone Graft Substitutes Market, By Product, 2017-2025 ($Million)
Table 71.South Africa Dental Bone Graft Substitutes Market, By Application, 2017-2025 ($Million)
Table 72.United Arab Emirates Dental Bone Graft Substitutes Market, By Product, 2017-2025 ($Million)
Table 73.United Arab Emirates Dental Bone Graft Substitutes Market, By Application, 2017-2025 ($Million)
Table 74.Others Dental Bone Graft Substitutes Market, By Product, 2017-2025 ($Million)
Table 75.Others Dental Bone Graft Substitutes Market, By Application, 2017-2025 ($Million)
Table 76.Graftys SA: Key Strategic Developments, 2017-2017
Table 77.Collagen Matrix, Inc.: Key Strategic Developments, 2017-2017
Table 78.LifeNet Health: Key Strategic Developments, 2017-2017
Table 79.Sunstar Americas, Inc. (a part of Sunstar Group): Key Strategic Developments, 2017-2017
Table 80.Ed. Geistlich Söhne AG: Key Strategic Developments, 2017-2017
Table 81.NovaBone Products, LLC: Key Strategic Developments, 2017-2017
Table 82.Institut Straumann AG: (GlobalMed): Key Strategic Developments, 2017-2017
Table 83.Curasan AG: Key Strategic Developments, 2017-2017
Table 84.Zimmer Biomet Holdings, Inc.: Key Strategic Developments, 2017-2017
Table 85.DENTSPLY SIRONA Inc.: Key Strategic Developments, 2017-2017
Table 86.Medtronic plc: Key Strategic Developments, 2017-2017
Table 87.BioHorizons, Inc.: Key Strategic Developments, 2017-2017
Table 87.ACE Surgical Supply Company, Inc.: Key Strategic Developments, 2017-2017
Table 87.Dentium USA: Key Strategic Developments, 2017-2017
Table 87.Genoss Co., Ltd.: Key Strategic Developments, 2017-2017
List of Figures
Figure 1.Dental Bone Graft Substitutes Market Share, By Product, 2017 & 2025 ($Million)
Figure 2.Dental Bone Graft Substitutes Market, By Application, 2017 & 2025, ($Million)
Figure 3.Dental Bone Graft Substitutes Market, By Region, 2017 & 2025, ($Million)
Figure 4.Sunstar Group: Net Revenues, 2017-2017 ($Million)
Figure 5.Sunstar Group: Net Revenue Share, By Segment, 2017
Figure 6.Sunstar Group: Net Revenue Share, By Geography, 2017
Figure 7.Institut Straumann AG: Net Revenues, 2017-2017 ($Million)
Figure 8.Institut Straumann AG: Net Revenue Share, By Segment, 2017
Figure 9.Institut Straumann AG: Net Revenue Share, By Geography, 2017
Figure 10.Curasan AG: Net Revenues, 2017-2017 ($Million)
Figure 11.Curasan AG: Net Revenue Share, By Segment, 2017
Figure 12.Curasan AG: Net Revenue Share, By Geography, 2017
Figure 13.Zimmer Biomet Holdings, Inc.: Net Revenues, 2017-2017 ($Million)
Figure 14.Zimmer Biomet Holdings, Inc.: Net Revenue Share, By Segment, 2017
Figure 15.Zimmer Biomet Holdings, Inc.: Net Revenue Share, By Geography, 2017
Figure 16.DENTSPLY SIRONA Inc.: Net Revenues, 2017-2017 ($Million)
Figure 17.DENTSPLY SIRONA Inc.: Net Revenue Share, By Segment, 2017
Figure 18.DENTSPLY SIRONA Inc.: Net Revenue Share, By Geography, 2017
Figure 16.Medtronic plc: Net Revenues, 2017-2017 ($Million)
Figure 17.Medtronic plc: Net Revenue Share, By Segment, 2017
Figure 18.Medtronic plc: Net Revenue Share, By Geography, 2017
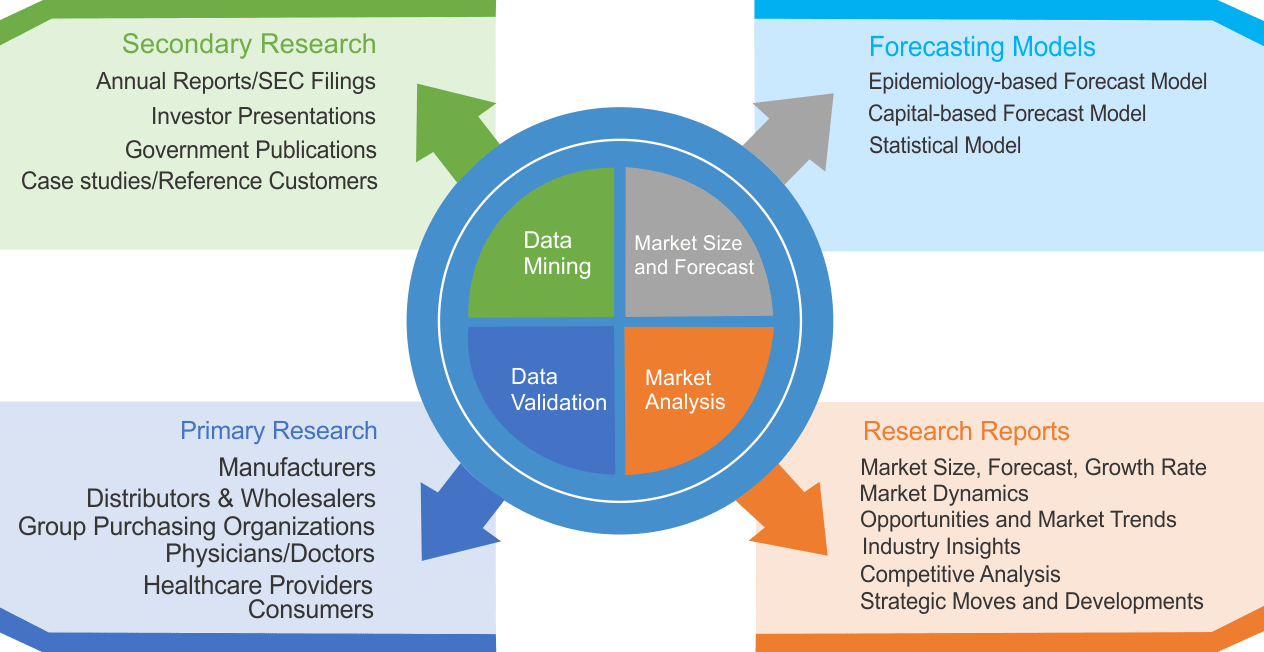
Research Methodology
We use both primary as well as secondary research for our market surveys, estimates and for developing forecast. Our research process commence by analyzing the problem which enable us to design the scope for our research study. Our research process is uniquely designed with enough flexibility to adjust according to changing nature of products and markets, while retaining core element to ensure reliability and accuracy in research findings. We understand both macro and micro-economic factors to evaluate and forecast different market segments.
Data Mining
Data is extensively collected through various secondary sources such as annual reports, investor presentations, SEC filings, and other corporate publications. We also refer trade magazines, technical journals, paid databases such as Factiva and Bloomberg, industry trade journals, scientific journals, and social media data to understand market dynamics and industry trends. Further, we also conduct primary research to understand market drivers, restraints, opportunities, challenges, and competitive scenario to build our analysis.
Data Collection Matrix
|
Data Collection Matrix |
Supply Side |
Demand Side |
|
Primary Data Sources |
|
|
|
Secondary Data Sources |
|
|
Market Modeling and Forecasting
We use epidemiology and capital equipment-based models to forecast market size of different segments at country and regional level.
- Epidemiology-based Forecasting Model: This method uses epidemiology data gathered through various publications and from physicians to estimate population of patients, flow of treatment of individual disease and therapies. The data collected through this method includes statics on incidence of disease, population suffering from disease, and treatment population. This method is used to understand:
- Number of patients for particular device or medical procedure and
- Repeated use of particular device depending on health and condition of patient
- Capital-based Forecasting Model: This method of forecasting is based on number of replacements, installed-based and new sales of capital equipment used in various healthcare and diagnostic centers. These three parameters are calculated and forecast is developed. Installation base is calculated as average number of units per facility; while sales for particular year is calculated from number of new and replace units. Secondary data is collected through various supply chain intermediaries and opinion leaders to arrive at installation and sales rate. These techniques help our analysts in validating market and developed market estimates and forecast.
We do forecast on basis of several parameters such as market drivers, market opportunities, industry trends government regulations, raw materials supply and trade dynamics to ensure relevance of forecast with market scenario. With increasing need to granulized information, we used bottom-up methodology for forecasting where we evaluate each regional segment differently and combined all forecast to develop final market forecast.
Data Validation
We believe primary research is a very important tool in analyzing and forecasting different markets. In order to make sure accuracy of our findings, our team conducts primary interviews at every stage of research to gain deep insights into current business environment and future trends and key developments in market. This includes use of various methods such as telephonic interviews, focus groups, face to face interviews and questionnaires to validate our research from all aspects. We validate our data through primary research from key industry leaders such as CEO, product managers, marketing managers, suppliers, distributors, and consumers are frequently interviewed. These interviews provide valuable insights which help us to have better market understanding besides validating our estimates and forecast.
Data Triangulation
Industry Analysis
|
Qualitative Data |
Quantitative Data (2017-2025) |
|
|