Craft Beer Market by Distribution - Global Industry Analysis and Forecast to 2027
Published On : May 2022 Pages : 98 Category: Food and Beverages Report Code : FB0641
Industry Trend Analysis
The global craft beer market is expected to be around $505 billion by 2027. Due to rising preference of consumers for flavored beer, this market is expected to grow significantly over the forecast period. Rising demand for beer with low alcohol by volume (ABV) has also contributed to the growth of this market around the world. Growing number of craft beer admirers around the world will drive the market growth in coming years.
Distribution Outlook and Trend Analysis
On trade distribution market held more than half of the total market for craft beer in 2017. In on-trade distribution, the alcoholic drinks are sold in bars, restaurants, clubs and pubs and similar channels of distribution in the hospitality industry. Comparatively, on-trade craft beer is costlier than off-trade craft beer. Hence, the market for on-trade craft beer is significantly growing in developed countries where the hospitality industry is booming. In off-trade distribution, craft beer is distributed through retailers, wholesalers, and online channels. This market has more growth prospects in emerging economies where affordability is the key to sales performance.
Regional Outlook and Trend Analysis
European dominated the global craft beer market in 2017. Rising acceptance and liking for flavored beer by the people are the key factors driving the market growth. On the basis of consumption, Germany and UK are at the forefront with more than one fourth of the total market revenue.
U.S. occupied major share of the North American craft beer market in 2017. Increased liking for low alcohol by volume (ABV) beverages in the U.S. will ensure the rapid pace of this market growth. North America will witness significant growth in the near future with more and more beer enthusiasts choosing flavored craft beer over mainstream beer.
Competitive Analysis
The craft beer market is currently in the growth stage with steady progress in different territorial markets. The introduction of new flavors and brewing processes are the key areas that the producers are exploiting to gain a competitive edge over other players. For instance, in December 2017, New Belgium Brewing Company announced the introduction of four new varieties of craft beer, Dayblazer Easygoing Ale, Tartastic Lemon Ginger Sour, Citradelic Exotic Lime Ale, Bell's Brewery, Inc., and Voodoo Ranger 8 Hop Ale.
Some of the key players operating in the global craft beer market are D.G. Yuengling and Son, Inc., The Gambrinus Company, The Boston Beer Company, Inc., Chimay Beers and Cheeses, New Belgium Brewing Company, Vagabund, The Lagunitas Brewing Company and Stone & Wood Brewing Co.
Market Opportunities
With increasing preferences of beer aficionados towards low ABV flavored beverages in developed and developing countries, the craft beer market will witness an exponential growth worldwide. Introduction of new flavors and tastes with innovative marketing and promotion activities will provide huge opportunities for brewers in this market. Efficient use of distribution channels can enable small and medium brewers to sustain and grow in this lucrative market.
Craft Beer Market Segmentation:
By Distribution:
- Off-trade Distribution
- On-trade Distribution
By Region:
- North America
- U.S
- Canada
- Mexico
- Europe
- Germany
- France
- UK
- Italy
- Spain
- Rest of Europe
- Asia-Pacific
- Japan
- China
- Australia
- India
- South Korea
- Rest of Asia-Pacific
- Rest of the World
- Brazil
- South Africa
- Saudi Arabia
- Turkey
- United Arab Emirates
- Others
Some of the key questions answered by the report are:
- What was the market size in 2017 and forecast from 2022 to 2027?
- What will be the industry market growth from 2022 to 2027?
- What are the major drivers, restraints, opportunities, challenges, and industry trends and their impact on the market forecast?
- What are the major segments leading the market growth and why?
- Which are the leading players in the market and what are the major strategies adopted by them to sustain the market competition?
Market Classification
- Craft Beer Market, By Distribution, Estimates and Forecast, 2017-2027 ($Million)
- On-trade Distribution
- Off-trade Distribution
- Craft Beer Market, By Region, Estimates and Forecast, 2017-2027 ($Million)
- North America
- North America Craft Beer Market, By Country
- North America Craft Beer Market, By Distribution
- U.S. Craft Beer Market, By Distribution
- Canada Craft Beer Market, By Distribution
- Mexico Craft Beer Market, By Distribution
-
- Europe
- Europe Craft Beer Market, By Country
- Europe Craft Beer Market, By Distribution
- Germany Craft Beer Market, By Distribution
- France Craft Beer Market, By Distribution
- UK Craft Beer Market, By Distribution
- Italy Craft Beer Market, By Distribution
- Spain Craft Beer Market, By Distribution
- Rest of Europe Craft Beer Market, By Distribution
-
- Asia-Pacific
- Asia-Pacific Craft Beer Market, By Country
- Asia-Pacific Craft Beer Market, By Distribution
- Japan Craft Beer Market, By Distribution
- China Craft Beer Market, By Distribution
- Australia Craft Beer Market, By Distribution
- India Craft Beer Market, By Distribution
- South Korea Craft Beer Market, By Distribution
- Rest of Asia-Pacific Craft Beer Market, By Distribution
- Asia-Pacific
-
- Rest of the World
- Rest of the World Craft Beer Market, By Country
- Rest of the World Craft Beer Market, By Distribution
- Brazil Craft Beer Market, By Distribution
- South Africa Craft Beer Market, By Distribution
- Saudi Arabia Craft Beer Market, By Distribution
- Turkey Craft Beer Market, By Distribution
- United Arab Emirates Craft Beer Market, By Distribution
- Others Craft Beer Market, By Distribution
- Rest of the World
Table of Contents
1. Introduction
1.1. Report Description
1.2. Research Methodology
1.2.1. Secondary Research
1.2.2. Primary Research
2. Executive Summary
2.1. Key Highlights
3. Market Overview
3.1. Introduction
3.1.1. Market Definition
3.1.2. Market Segmentation
3.2. Market Share Analysis
3.3. Market Dynamics
3.3.1. Drivers
3.3.1.1. Rising Demand for Beer With Low Alcohol by Volume
3.3.1.2. Increasing Preference for Flavored Beer than Regular Beer by Consumers
3.3.2. Restraints
3.3.2.1. High Prices of Craft Beer
3.3.3. Opportunities
3.3.3.1. Introduction of New Flavors and Tastes
3.4. Industry Trends
4. Craft Beer Market, By Distribution
4.1. Introduction
4.2. Craft Beer Market Assessment and Forecast, By Distribution, 2017-2027
4.3. On-Trade
4.3.1. Market Assessment and Forecast, By Region, 2017-2027 ($Million)
4.4. Off-Trade
4.4.1. Market Assessment and Forecast, By Region, 2017-2027 ($Million)
5. Craft Beer Market, By Region
5.1. Introduction
5.2. Craft Beer Market Assessment and Forecast, By Region, 2017-2027 ($Million)
5.3. North America
5.3.1. Market Assessment and Forecast, By Country, 2017-2027 ($Million)
5.3.2. Market Assessment and Forecast, By Distribution, 2017-2027 ($Million)
5.3.2.1. U.S.
5.3.2.1.1. Market Assessment and Forecast, By Distribution, 2017-2027 ($Million)
5.3.2.2. Canada
5.3.2.2.1. Market Assessment and Forecast, By Distribution, 2017-2027 ($Million)
5.3.2.3. Mexico
5.3.2.3.1. Market Assessment and Forecast, By Distribution, 2017-2027 ($Million)
5.4. Europe
5.4.1. Market Assessment and Forecast, By Country, 2017-2027 ($Million)
5.4.2. Market Assessment and Forecast, By Distribution, 2017-2027 ($Million)
5.4.2.1. Germany
5.4.2.1.1. Market Assessment and Forecast, By Distribution, 2017-2027 ($Million)
5.4.2.2. France
5.4.2.2.1. Market Assessment and Forecast, By Distribution, 2017-2027 ($Million)
5.4.2.3. UK
5.4.2.3.1. Market Assessment and Forecast, By Distribution, 2017-2027 ($Million)
5.4.2.4. Italy
5.4.2.4.1. Market Assessment and Forecast, By Distribution, 2017-2027 ($Million)
5.4.2.5. Spain
5.4.2.5.1. Market Assessment and Forecast, By Distribution, 2017-2027 ($Million)
5.4.2.6. Russia
5.4.2.6.1. Market Assessment and Forecast, By Distribution, 2017-2027 ($Million)
5.4.2.7. Rest of Europe
5.4.2.7.1. Market Assessment and Forecast, By Distribution, 2017-2027 ($Million)
5.5. Asia-Pacific
5.5.1. Market Assessment and Forecast, By Country, 2017-2027 ($Million)
5.5.2. Market Assessment and Forecast, By Distribution, 2017-2027 ($Million)
5.5.2.1. Japan
5.5.2.1.1. Market Assessment and Forecast, By Distribution, 2017-2027 ($Million)
5.5.2.2. China
5.5.2.2.1. Market Assessment and Forecast, By Distribution, 2017-2027 ($Million)
5.5.2.3. Australia
5.5.2.3.1. Market Assessment and Forecast, By Distribution, 2017-2027 ($Million)
5.5.2.4. India
5.5.2.4.1. Market Assessment and Forecast, By Distribution, 2017-2027 ($Million)
5.5.2.5. South Korea
5.5.2.5.1. Market Assessment and Forecast, By Distribution, 2017-2027 ($Million)
5.5.2.6. Taiwan
5.5.2.6.1. Market Assessment and Forecast, By Distribution, 2017-2027 ($Million)
5.5.2.7. Rest of Asia-Pacific
5.5.2.7.1. Market Assessment and Forecast, By Distribution, 2017-2027 ($Million)
5.6. Rest of the World
5.6.1. Market Assessment and Forecast, By Country, 2017-2027 ($Million)
5.6.2. Market Assessment and Forecast, By Distribution, 2017-2027 ($Million)
5.6.2.1. Brazil
5.6.2.1.1. Market Assessment and Forecast, By Distribution, 2017-2027 ($Million)
5.6.2.2. Turkey
5.6.2.2.1. Market Assessment and Forecast, By Distribution, 2017-2027 ($Million)
5.6.2.3. Saudi Arabia
5.6.2.3.1. Market Assessment and Forecast, By Distribution, 2017-2027 ($Million)
5.6.2.4. South Africa
5.6.2.4.1. Market Assessment and Forecast, By Distribution, 2017-2027 ($Million)
5.6.2.5. United Arab Emirates
5.6.2.5.1. Market Assessment and Forecast, By Distribution, 2017-2027 ($Million)
5.6.2.6. Others
5.6.2.6.1. Market Assessment and Forecast, By Distribution, 2017-2027 ($Million)
6. Company Profiles
6.1. The Boston Beer Company
6.1.1. Business Overview
6.1.2. Product Portfolio
6.1.3. Key Financials
6.1.4. Strategic Developments
6.2. Chimay Beers and Cheeses
6.2.1. Business Overview
6.2.2. Product Portfolio
6.2.3. Key Financials
6.2.4. Strategic Developments
6.3. D.G. Yuengling and Son
6.3.1. Business Overview
6.3.2. Product Portfolio
6.3.3. Key Financials
6.3.4. Strategic Developments
6.4. The Gambrinus Company
6.4.1. Business Overview
6.4.2. Product Portfolio
6.4.3. Key Financials
6.4.4. Strategic Developments
6.5. New Belgium Brewing Company
6.5.1. Business Overview
6.5.2. Product Portfolio
6.5.3. Key Financials
6.5.4. Strategic Developments
6.6. Bell's Brewery, Inc.
6.6.1. Business Overview
6.6.2. Product Portfolio
6.6.3. Key Financials
6.6.4. Strategic Developments
6.7. Vagabund
6.7.1. Business Overview
6.7.2. Product Portfolio
6.7.3. Key Financials
6.7.4. Strategic Developments
6.8. Lagunitas Brewing Company
6.8.1. Business Overview
6.8.2. Product Portfolio
6.8.3. Key Financials
6.8.4. Strategic Developments
6.9. Stone & Wood Brewing Co.
6.9.1. Business Overview
6.9.2. Product Portfolio
6.9.3. Key Financials
6.9.4. Strategic Developments
List of Tables
Table 1.Global Craft Beer Market, By Distribution, 2017-2025 ($Million)
Table 2.On-Trade Market, By Region, 2017-2025 ($Million)
Table 3.Off-Trade Market, By Region, 2017-2025 ($Million)
Table 4.Craft Beer Market, By Region, 2017-2025 ($Million)
Table 5.North America Craft Beer Market, By Country, 2017-2025 ($Million)
Table 6.North America Craft Beer Market, By Distribution, 2017-2025 ($Million)
Table 7.U.S. Craft Beer Market, by Distribution, 2017-2025 ($Million)
Table 8.Canada Craft Beer Market, By Distribution, 2017-2025 ($Million)
Table 9.Mexico Craft Beer Market, By Distribution, 2017-2025 ($Million)
Table 10.Europe Craft Beer Market, By Country, 2017-2025 ($Million)
Table 11.Europe Craft Beer Market, By Distribution, 2017-2025 ($Million)
Table 12.Germany Craft Beer Market, By Distribution, 2017-2025 ($Million)
Table 13.France Craft Beer Market, By Distribution, 2017-2025 ($Million)
Table 14.UK Craft Beer Market, By Distribution, 2017-2025 ($Million)
Table 15.Italy Craft Beer Market, By Distribution, 2017-2025 ($Million)
Table 16.Spain Craft Beer Market, By Distribution, 2017-2025 ($Million)
Table 17.Russia Craft Beer Market, By Distribution, 2017-2025 ($Million)
Table 18.Rest of Europe Craft Beer Market, By Distribution, 2017-2025 ($Million)
Table 19.Asia-Pacific Craft Beer Market, By Country, 2017-2025 ($Million)
Table 20.Asia-Pacific Craft Beer Market, By Distribution, 2017-2025 ($Million)
Table 21.Japan Craft Beer Market, By Distribution, 2017-2025 ($Million)
Table 22.China Craft Beer Market, By Distribution, 2017-2025 ($Million)
Table 23.Australia Craft Beer Market, By Distribution, 2017-2025 ($Million)
Table 24.India Craft Beer Market, By Distribution, 2017-2025 ($Million)
Table 25.South Korea Craft Beer Market, By Distribution, 2017-2025 ($Million)
Table 26.Taiwan Craft Beer Market, By Distribution, 2017-2025 ($Million)
Table 27.Rest of Asia-Pacific Craft Beer Market, By Distribution, 2017-2025 ($Million)
Table 28.Rest of the World Craft Beer Market, By Country, 2017-2025 ($Million)
Table 29.Rest of the World Craft Beer Market, By Distribution, 2017-2025 ($Million)
Table 30.Brazil Craft Beer Market, By Distribution, 2017-2025 ($Million)
Table 31.Turkey Craft Beer Market, By Distribution, 2017-2025 ($Million)
Table 32.Saudi Arabia Craft Beer Market, By Distribution, 2017-2025 ($Million)
Table 33.South Africa Craft Beer Market, By Distribution, 2017-2025 ($Million)
Table 34.United Arab Emirates Craft Beer Market, By Distribution, 2017-2025 ($Million)
Table 35.Others Craft Beer Market, By Distribution, 2017-2025 ($Million)
Table 36.The Boston Beer Company: Key Strategic Developments, 2017-2017
Table 37.Chimay Beers and Cheeses: Key Strategic Developments, 2017-2017
Table 38.D.G. Yuengling and Son: Key Strategic Developments, 2017-2017
Table 39.The Gambrinus Company: Key Strategic Developments, 2017-2017
Table 40.New Belgium Brewing Company: Key Strategic Developments, 2017-2017
Table 41.Bell’s Brewery, Inc.: Key Strategic Developments, 2017-2017
Table 42.Vagabund: Key Strategic Developments, 2017-2017
Table 43.Lagunitas Brewing Company: Key Strategic Developments, 2017-2017
Table 44.Stone & Wood Brewing Co.: Key Strategic Developments, 2017-2017
List of Figures
Figure 1.Global Craft Beer Market Share, By Distribution, 2017 & 2025
Figure 2.Craft Beer Market, By Region, 2017 ($Million)
Figure 3.The Boston Beer Company: Net Revenues, 2017-2017 ($Million)
Figure 4.The Boston Beer Company: Net Revenue Share, By Segment, 2017
Figure 5.The Boston Beer Company: Net Revenue Share, By Geography, 2017
Figure 6.Chimay Beers and Cheeses: Net Revenues, 2017-2017 ($Million)
Figure 7.Chimay Beers and Cheeses: Net Revenue Share, By Segment, 2017
Figure 8.Chimay Beers and Cheeses: Net Revenue Share, By Geography, 2017
Figure 9.D.G. Yuengling and Son: Net Revenues, 2017-2017 ($Million)
Figure 10.D.G. Yuengling and Son: Net Revenue Share, By Segment, 2017
Figure 11.D.G. Yuengling and Son: Net Revenue Share, By Geography, 2017
Figure 12.The Gambrinus Company: Net Revenues, 2017-2017 ($Million)
Figure 13.The Gambrinus Company: Net Revenue Share, By Segment, 2017
Figure 14.The Gambrinus Company: Net Revenue Share, By Geography, 2017
Figure 15.New Belgium Brewing Company: Net Revenues, 2017-2017 ($Million)
Figure 16.New Belgium Brewing Company: Net Revenue Share, By Segment, 2017
Figure 17.New Belgium Brewing Company: Net Revenue Share, By Geography, 2017
Figure 18.Bell’s Brewery, Inc.: Net Revenues, 2017-2017 ($Million)
Figure 19.Bell’s Brewery, Inc.: Net Revenue Share, By Segment, 2017
Figure 20.Bell’s Brewery, Inc.: Net Revenue Share, By Geography, 2017
Figure 21.Vagabund: Net Revenues, 2017-2017 ($Million)
Figure 22.Vagabund: Net Revenue Share, By Segment, 2017
Figure 23.Vagabund: Net Revenue Share, By Geography, 2017
Figure 24.Lagunitas Brewing Company: Net Revenues, 2017-2017 ($Million)
Figure 25.Lagunitas Brewing Company: Net Revenue Share, By Segment, 2017
Figure 26.Lagunitas Brewing Company: Net Revenue Share, By Geography, 2017
Figure 27.Stone & Wood Brewing Co.: Net Revenues, 2017-2017 ($Million)
Figure 28.Stone & Wood Brewing Co.: Net Revenue Share, By Segment, 2017
Figure 29.Stone & Wood Brewing Co.: Net Revenue Share, By Geography, 2017
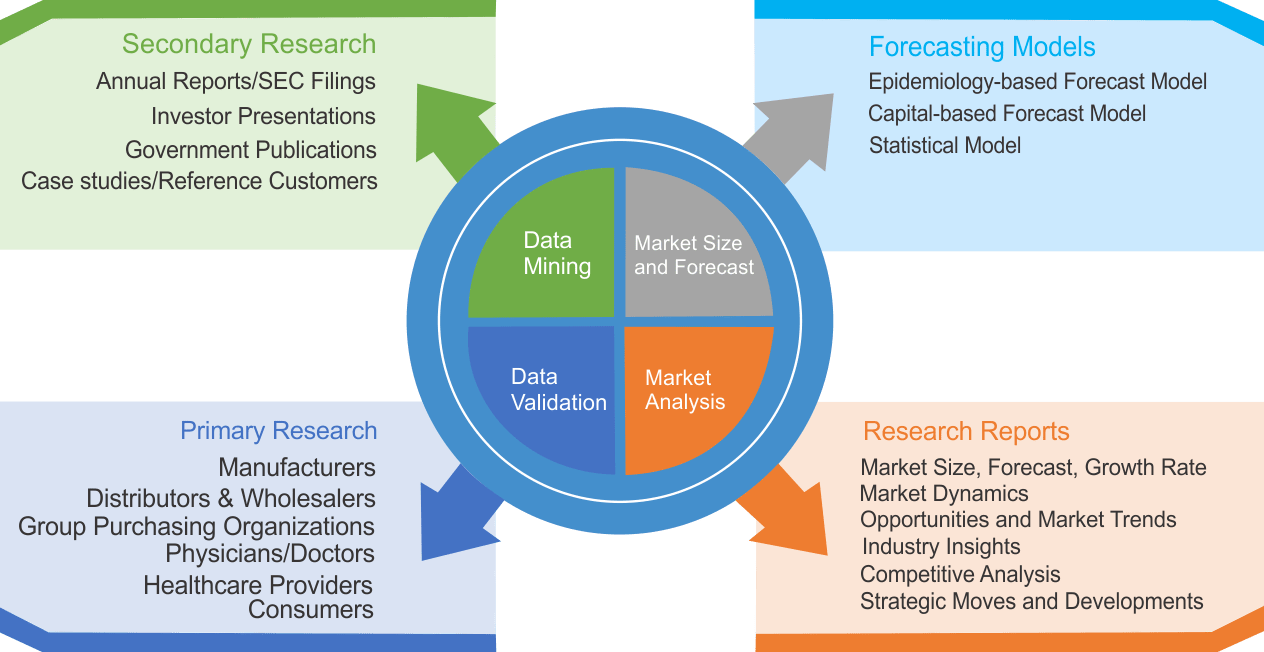
Research Methodology
We use both primary as well as secondary research for our market surveys, estimates and for developing forecast. Our research process commence by analyzing the problem which enable us to design the scope for our research study. Our research process is uniquely designed with enough flexibility to adjust according to changing nature of products and markets, while retaining core element to ensure reliability and accuracy in research findings. We understand both macro and micro-economic factors to evaluate and forecast different market segments.
Data Mining
Data is extensively collected through various secondary sources such as annual reports, investor presentations, SEC filings, and other corporate publications. We also refer trade magazines, technical journals, paid databases such as Factiva and Bloomberg, industry trade journals, scientific journals, and social media data to understand market dynamics and industry trends. Further, we also conduct primary research to understand market drivers, restraints, opportunities, challenges, and competitive scenario to build our analysis.
Data Collection Matrix
|
Data Collection Matrix |
Supply Side |
Demand Side |
|
Primary Data Sources |
|
|
|
Secondary Data Sources |
|
|
Market Modeling and Forecasting
We use epidemiology and capital equipment-based models to forecast market size of different segments at country and regional level.
- Epidemiology-based Forecasting Model: This method uses epidemiology data gathered through various publications and from physicians to estimate population of patients, flow of treatment of individual disease and therapies. The data collected through this method includes statics on incidence of disease, population suffering from disease, and treatment population. This method is used to understand:
- Number of patients for particular device or medical procedure and
- Repeated use of particular device depending on health and condition of patient
- Capital-based Forecasting Model: This method of forecasting is based on number of replacements, installed-based and new sales of capital equipment used in various healthcare and diagnostic centers. These three parameters are calculated and forecast is developed. Installation base is calculated as average number of units per facility; while sales for particular year is calculated from number of new and replace units. Secondary data is collected through various supply chain intermediaries and opinion leaders to arrive at installation and sales rate. These techniques help our analysts in validating market and developed market estimates and forecast.
We do forecast on basis of several parameters such as market drivers, market opportunities, industry trends government regulations, raw materials supply and trade dynamics to ensure relevance of forecast with market scenario. With increasing need to granulized information, we used bottom-up methodology for forecasting where we evaluate each regional segment differently and combined all forecast to develop final market forecast.
Data Validation
We believe primary research is a very important tool in analyzing and forecasting different markets. In order to make sure accuracy of our findings, our team conducts primary interviews at every stage of research to gain deep insights into current business environment and future trends and key developments in market. This includes use of various methods such as telephonic interviews, focus groups, face to face interviews and questionnaires to validate our research from all aspects. We validate our data through primary research from key industry leaders such as CEO, product managers, marketing managers, suppliers, distributors, and consumers are frequently interviewed. These interviews provide valuable insights which help us to have better market understanding besides validating our estimates and forecast.
Data Triangulation
Industry Analysis
|
Qualitative Data |
Quantitative Data (2017-2025) |
|
|