Catalyst Market by Type and Application - Global Industry Analysis and Forecast to 2027
Published On : September 2017 Pages : 165 Category: Organic Chemicals Report Code : CM09210
Industry Outlook and Trend Analysis
The global catalyst market was worth USD 29.28 billion in the year of 2017 and is anticipated to reach approximately USD 40.92 billion by 2027, while registering itself at a compound annual growth rate (CAGR) of 3.79% during the forecast period. Increased value of catalysts in industries such as oil & gas and chemicals in order to improve the rate of reaction and decrease the lead time is anticipated to influence the growth of the sector significantly in the coming years. A catalyst is useful as a supplementary element in a reaction between two chemicals which accelerates the process and causes less energy of activation. Catalysts are utilized in variety of applications that includes production of petrochemical, refining petroleum, combining of bulk chemicals, environment protecting reactions and polymer processing. Acquiring prominence of the catalytic reforming process in sectors such as oil and gas in order to provide enhanced benefits of light cut oils that include superior kerosene oil, high-speed diesel and gasoline is anticipated to boost the utilization of the product. Additionally, increased expenditure for the manufacturing of the derivatives of petroleum via syngas is anticipated to fuel the usage of catalyst in the future. Varying prices of raw materials, specifically zeolite along with other precious metals, because of their rising demand in various applications like construction, chemicals and automotive is said to result in product supply to manufacturers which will be limited. As a result, this may increase the price of catalysts which may inhibit the growth of this market.
Application Outlook and Trend Analysis
A share of 29.1 percent of the total volume was held by chemical combining in the year 2017. Catalysts are extensively being utilized in chemical combining due to its exceptional benefits like convenient activation of alkenes and alkynes and high stability. The use of catalysts for environmental applications is said to encounter significant growth in the coming years. Increasing implementation of catalysts for applications like treatment of municipal and industrial waste is anticipated to drive the growth of the market.
Raw Material Outlook and Trend Analysis
In the year 2017 as share of 41 percent was held by chemical compounds that include amine, peroxide and acid products. In comparison to metals and zeolite, the process of chemical are low this is anticipated to be one of the major factors to drive the growth of this market. The requirement for metal catalyst was 1,568.4 kilo tons in the year 2017 and is expected to encounter substantial growth due to its increasing applications in various fields. Metals like palladium, rhodium, nickel, copper, molybdenum, ruthenium, platinum, chromium and gold are extremely useful as catalysts for improving the rate of reaction in the production of polymer, chemical refining and processing. Products that are zeolite-based have high adjustable acidity and porosity; hence it is anticipated to encounter significant growth in the coming years.
Product Outlook and Trend Analysis
In the year 2017 heterogeneous catalyst held a share of 73.6 percent of the market share. Convenient availability and low prices of heterogeneous products are expected to spur the growth of the market significantly in the coming years. On the other hand, homogeneous catalysts have high solubility and are beneficial for the production of petrochemicals, polymers and bulk chemicals. Owing to such factors homogeneous catalysts are anticipated to witness significant growth in the upcoming years.
Regional Outlook and Trend Analysis
The largest market in 2017 was held by Asia Pacific that registered 34 percent of the total volume. Developing economies like India and China are hubs for the production of the derivatives of petroleum and chemicals which is one of the factors that boosts the growth of the market in the region. Growth of refining capacities in Saudi Arabia, Qatar and Oman along with riding demand of petrochemicals is said to boost the demand in the Middle East and Africa.
Competitive Insights
Major players in the Catalysts market are DuPoint, BASF, W.E Grace and Company, Johnson Matthey, Albemarle Corporation and Evonik Industries. A new production site was introduced by Johnson Matthey process technologies in Brazil in the year 2017 which will produce catalysts for the refining sector for captive hydrogen production.
The global catalyst market is segmented as follows-
By Type
- Chemical compounds
- Amines
- Acids
- Peroxides
- Other Chemicals
- Enzymes
- Metals
- Precious Metals
- Base Metals
- Zeolites
- MFI
- FAU
- LTA
- Other Zeolites
- Organometallic Materials
By Application
- Environmental
- Heavy-duty vehicles
- Light-duty vehicles
- Others Environmental
- Polymer Catalysts
- Reaction Initiator
- Ziegler‐Natta
- Single-site
- Other Polymer Catalyst
- Petroleum Refining
- Alkylation Catalysts
- Fluid Catalytic Cracking (FCC)
- Catalytic Reforming
- Hydroprocessing Catalysts
- Other Petroleum Refining
- Chemical synthesis
- Polyolefins
- Hydrogenation Catalysts
- Catalytic Oxidation
- Other Chemical Synthesis
By Region
- North America
- U.S
- Canada
- Mexico
- Europe
- Germany
- France
- UK
- Italy
- Spain
- Rest of Europe
- Asia-Pacific
- Japan
- China
- Australia
- India
- South Korea
- Rest of Asia Pacific
- Rest of the World
- Brazil
- South Africa
- Saudi Arabia
- United Arab Emirates
- Others
Some of the key questions answered by the report are:
- What was the market size in 2017 and forecast from 2022 to 2027?
- What will be the industry market growth from 2022 to 2027?
- What are the major drivers, restraints, opportunities, challenges, and industry trends and their impact on the market forecast?
- What are the major segments leading the market growth and why?
- Which are the leading players in the market and what are the major strategies adopted by them to sustain the market competition?
Market Classification
- Catalyst Market, By Type, Estimates and Forecast, 2017-2027 ($Million)
- Chemical compounds
- Amines
- Acids
- Peroxides
- Other Chemicals
- Enzymes
- Metals
- Precious Metals
- Base Metals
- Zeolites
- MFI
- FAU
- LTA
- Other Zeolites
- Organometallic Materials
- Chemical compounds
- Catalyst Market, By Application, Estimates and Forecast, 2017-2027 ($Million)
- Environmental
- Heavy-duty vehicles
- Light-duty vehicles
- Others Environmental
- Polymer Catalysts
- Reaction Initiator
- Ziegler‐Natta
- Single-site
- Other Polymer Catalyst
- Petroleum Refining
- Alkylation Catalysts
- Fluid Catalytic Cracking (FCC)
- Catalytic Reforming
- Hydroprocessing Catalysts
- Other Petroleum Refining
- Chemical synthesis
- Polyolefins
- Hydrogenation Catalysts
- Catalytic Oxidation
- Other Chemical Synthesis
- Catalyst Market, By Region, Estimates and Forecast, 2017-2027 ($Million)
- North America
- North America Catalyst Market, By Country
- North America Catalyst Market, By Type
- North America Catalyst Market, By Application
- U.S. Catalyst Market, By Type
- U.S. Catalyst Market, By Application
- Canada Catalyst Market, By Type
- Canada Catalyst Market, By Application
- Mexico Catalyst Market, By Type
- Mexico Catalyst Market, By Application
-
- Europe
- Europe Catalyst Market, By Country
- Europe Catalyst Market, By Type
- Europe Catalyst Market, By Application
- Germany Catalyst Market, By Type
- Germany Catalyst Market, By Application
- France Catalyst Market, By Type
- France Catalyst Market, By Application
- UK Catalyst Market, By Type
- UK Catalyst Market, By Application
- Italy Catalyst Market, By Type
- Italy Catalyst Market, By Application
- Spain Catalyst Market, By Type
- Spain Catalyst Market, By Application
- Rest of Europe Catalyst Market, By Type
- Rest of Europe Catalyst Market, By Application
-
- Asia-Pacific
- Asia-Pacific Catalyst Market, By Country
- Asia-Pacific Catalyst Market, By Type
- Asia-Pacific Catalyst Market, By Application
- Japan Catalyst Market, By Type
- Japan Catalyst Market, By Application
- Australia Catalyst Market, By Type
- Australia Catalyst Market, By Application
- India Catalyst Market, By Type
- India Catalyst Market, By Application
- South Korea Catalyst Market, By Type
- South Korea Catalyst Market, By Application
- Rest of Asia-Pacific Catalyst Market, By Type
- Rest of Asia-Pacific Catalyst Market, By Application
- Asia-Pacific
-
- Rest of the World
- Rest of the World Catalyst Market, By Country
- Rest of the World Catalyst Market, By Type
- Rest of the World Catalyst Market, By Application
- Brazil Catalyst Market, By Type
- Brazil Catalyst Market, By Application
- South Africa Catalyst Market, By Type
- South Africa Catalyst Market, By Application
- Saudi Arabia Catalyst Market, By Type
- Saudi Arabia Catalyst Market, By Application
- Turkey Catalyst Market, By Type
- Turkey Catalyst Market, By Application
- United Arab Emirates Catalyst Market, By Type
- United Arab Emirates Catalyst Market, By Application
- Others Catalyst Market, By Type
- Others Catalyst Market, By Application
- Rest of the World
Table of Contents
1.Introduction
1.1.Report Description
1.2.Research Methodology
1.2.1. Secondary Research
1.2.2. Primary Research
2.Executive Summary
2.1.Key Highlights
3.Market Overview
3.1.Introduction
3.1.1. Market Definition
3.1.2. Market Segmentation
3.2.Market Share Analysis
3.3.Market Dynamics
3.3.1. Drivers
3.3.1.1.Rise In Number of Applications in End User Industries
3.3.1.2.Financial Growth toward Higher Utilization of Catalytic Processes
3.3.1.3.Rigorous Environmental Legislation Regarding Automotive Emissions
3.3.2. Restraints
3.3.2.1.Limited Progress and Distribution of New Catalysts
3.3.3. Opportunities
3.3.3.1.Expansion of Biochemicals Through Catalysis
3.4.Industry Trends
4.Catalyst Market, By Type
4.1.Introduction
4.2.Catalyst Market Assessment and Forecast, By Type, 2017-2027
4.3.Chemical compounds
4.3.1. Market Assessment and Forecast, By Type, 2017-2027 ($Million)
4.3.2. Market Assessment and Forecast, By Region, 2017-2027 ($Million)
4.3.3. Amines
4.3.3.1.Market Assessment and Forecast, By Region, 2017-2027 ($Million)
4.3.4. Acids
4.3.4.1.Market Assessment and Forecast, By Region, 2017-2027 ($Million)
4.3.5. Peroxides
4.3.5.1.Market Assessment and Forecast, By Region, 2017-2027 ($Million)
4.3.6. Other Chemicals
4.3.6.1.Market Assessment and Forecast, By Region, 2017-2027 ($Million)
4.4.Pressure and Force Sensors
4.4.1. Market Assessment and Forecast, By Region, 2017-2027 ($Million)
4.5.Temperature and Humidity Sensors
4.5.1. Market Assessment and Forecast, By Region, 2017-2027 ($Million)
4.6.Enzymes
4.6.1. Market Assessment and Forecast, By Region, 2017-2027 ($Million)
4.7.Metals
4.7.1. Market Assessment and Forecast, By Type, 2017-2027 ($Million)
4.7.2. Market Assessment and Forecast, By Region, 2017-2027 ($Million)
4.7.3. Precious Metals
4.7.3.1.Market Assessment and Forecast, By Region, 2017-2027 ($Million)
4.7.4. Base Metals
4.7.4.1.Market Assessment and Forecast, By Region, 2017-2027 ($Million)
4.8.Zeolites
4.8.1. Market Assessment and Forecast, By Type, 2017-2027 ($Million)
4.8.2. Market Assessment and Forecast, By Region, 2017-2027 ($Million)
4.8.3. MFI
4.8.3.1.Market Assessment and Forecast, By Region, 2017-2027 ($Million)
4.8.4. FAU
4.8.4.1.Market Assessment and Forecast, By Region, 2017-2027 ($Million)
4.8.5. LTA
4.8.5.1.Market Assessment and Forecast, By Region, 2017-2027 ($Million)
4.8.6. Other Zeolites
4.8.6.1.Market Assessment and Forecast, By Region, 2017-2027 ($Million)
4.9.Organometallic Materials
4.9.1. Market Assessment and Forecast, By Region, 2017-2027 ($Million)
5.Catalyst Market, By Application
5.1.Introduction
5.2.Catalyst Market Assessment and Forecast, By Application, 2017-2027
5.3.Environmental
5.3.1.1.Market Assessment and Forecast, By Type, 2017-2027 ($Million)
5.3.1.2.Market Assessment and Forecast, By Region, 2017-2027 ($Million)
5.3.1.3.Environmental
5.3.1.3.1.Market Assessment and Forecast, By Region, 2017-2027 ($Million)
5.3.1.4.Light-duty vehicles
5.3.1.4.1.Market Assessment and Forecast, By Region, 2017-2027 ($Million)
5.3.1.5.Others Environmental
5.3.1.5.1.1.Market Assessment and Forecast, By Region, 2017-2027 ($Million)
5.4.Polymer Catalysts
5.4.1.1.Market Assessment and Forecast, By Type, 2017-2027 ($Million)
5.4.1.2.Market Assessment and Forecast, By Region, 2017-2027 ($Million)
5.4.1.3.Reaction Initiator
5.4.1.3.1.Market Assessment and Forecast, By Region, 2017-2027 ($Million)
5.4.1.4.Ziegler‐Natta
5.4.1.4.1.Market Assessment and Forecast, By Region, 2017-2027 ($Million)
5.4.1.5.Single-site
5.4.1.5.1.1.Market Assessment and Forecast, By Region, 2017-2027 ($Million)
5.4.1.6.Other Polymer Catalyst
5.4.1.6.1.Market Assessment and Forecast, By Region, 2017-2027 ($Million)
5.5.Petroleum Refining
5.5.1.1.Market Assessment and Forecast, By Type, 2017-2027 ($Million)
5.5.1.2.Market Assessment and Forecast, By Region, 2017-2027 ($Million)
5.5.1.3.Alkylation Catalysts
5.5.1.3.1.Market Assessment and Forecast, By Region, 2017-2027 ($Million)
5.5.1.4.Fluid Catalytic Cracking (FCC)
5.5.1.4.1.Market Assessment and Forecast, By Region, 2017-2027 ($Million)
5.5.1.5.Catalytic Reforming
5.5.1.5.1.Market Assessment and Forecast, By Region, 2017-2027 ($Million)
5.5.1.6.Hydroprocessing Catalysts
5.5.1.6.1.Market Assessment and Forecast, By Region, 2017-2027 ($Million)
5.5.1.7.Other Petroleum Refining
5.5.1.7.1.Market Assessment and Forecast, By Region, 2017-2027 ($Million)
5.6.Chemical synthesis
5.6.1.1.Market Assessment and Forecast, By Type, 2017-2027 ($Million)
5.6.1.2.Market Assessment and Forecast, By Region, 2017-2027 ($Million)
5.6.1.2.1.Polyolefins
5.6.1.2.1.1.Market Assessment and Forecast, By Region, 2017-2027 ($Million)
5.6.1.2.2.Hydrogenation Catalysts
5.6.1.2.2.1.Market Assessment and Forecast, By Region, 2017-2027 ($Million)
5.6.1.2.3.Catalytic Oxidation
5.6.1.2.3.1.Market Assessment and Forecast, By Region, 2017-2027 ($Million)
5.6.1.2.4.Other Chemical Synthesis
5.6.1.2.4.1.1.Market Assessment and Forecast, By Region, 2017-2027 ($Million)
6.Catalyst Market, By Region
6.1.Introduction
6.2.Catalyst Market Assessment and Forecast, By Region, 2017-2027 ($Million)
6.3.North America
6.3.1. Market Assessment and Forecast, By Country, 2017-2027 ($Million)
6.3.2. Market Assessment and Forecast, By Type, 2017-2027 ($Million)
6.3.3. Market Assessment and Forecast, By Application, 2017-2027 ($Million)
6.3.3.1.U.S.
6.3.3.1.1.Market Assessment and Forecast, By Type, 2017-2027 ($Million)
6.3.3.1.2.Market Assessment and Forecast, By Application, 2017-2027 ($Million)
6.3.3.2.Canada
6.3.3.2.1.Market Assessment and Forecast, By Type, 2017-2027 ($Million)
6.3.3.2.2.Market Assessment and Forecast, By Application, 2017-2027 ($Million)
6.3.3.3.Mexico
6.3.3.3.1.Market Assessment and Forecast, By Type, 2017-2027 ($Million)
6.3.3.3.2.Market Assessment and Forecast, By Application, 2017-2027 ($Million)
6.4.Europe
6.4.1. Market Assessment and Forecast, By Country, 2017-2027 ($Million)
6.4.2. Market Assessment and Forecast, By Type, 2017-2027 ($Million)
6.4.3. Market Assessment and Forecast, By Application, 2017-2027 ($Million)
6.4.3.1.Germany
6.4.3.1.1.Market Assessment and Forecast, By Type, 2017-2027 ($Million)
6.4.3.1.2.Market Assessment and Forecast, By Application, 2017-2027 ($Million)
6.4.3.2.France
6.4.3.2.1.Market Assessment and Forecast, By Type, 2017-2027 ($Million)
6.4.3.2.2.Market Assessment and Forecast, By Type, 2017-2027 ($Million)
6.4.3.3.UK
6.4.3.3.1.Market Assessment and Forecast, By Type, 2017-2027 ($Million)
6.4.3.3.2.Market Assessment and Forecast, By Application, 2017-2027 ($Million)
6.4.3.4.Italy
6.4.3.4.1.Market Assessment and Forecast, By Type, 2017-2027 ($Million)
6.4.3.4.2.Market Assessment and Forecast, By Application, 2017-2027 ($Million)
6.4.3.5.Spain
6.4.3.5.1.Market Assessment and Forecast, By Type, 2017-2027 ($Million)
6.4.3.5.2.Market Assessment and Forecast, By Application, 2017-2027 ($Million)
6.4.3.6.Russia
6.4.3.6.1.Market Assessment and Forecast, By Type, 2017-2027 ($Million)
6.4.3.6.2.Market Assessment and Forecast, By Application, 2017-2027 ($Million)
6.4.3.7.Rest of Europe
6.4.3.7.1.Market Assessment and Forecast, By Type, 2017-2027 ($Million)
6.4.3.7.2.Market Assessment and Forecast, By Application, 2017-2027 ($Million)
6.5.Asia-Pacific
6.5.1. Market Assessment and Forecast, By Country, 2017-2027 ($Million)
6.5.2. Market Assessment and Forecast, By Type, 2017-2027 ($Million)
6.5.3. Market Assessment and Forecast, By Application, 2017-2027 ($Million)
6.5.3.1.Japan
6.5.3.1.1.Market Assessment and Forecast, By Type, 2017-2027 ($Million)
6.5.3.1.2.Market Assessment and Forecast, By Application, 2017-2027 ($Million)
6.5.3.2.China
6.5.3.2.1.Market Assessment and Forecast, By Type, 2017-2027 ($Million)
6.5.3.2.2.Market Assessment and Forecast, By Application, 2017-2027 ($Million)
6.5.3.3.Australia
6.5.3.3.1.Market Assessment and Forecast, By Type, 2017-2027 ($Million)
6.5.3.3.2.Market Assessment and Forecast, By Application, 2017-2027 ($Million)
6.5.3.4.India
6.5.3.4.1.Market Assessment and Forecast, By Type, 2017-2027 ($Million)
6.5.3.4.2.Market Assessment and Forecast, By Application, 2017-2027 ($Million)
6.5.3.5.South Korea
6.5.3.5.1.Market Assessment and Forecast, By Type, 2017-2027 ($Million)
6.5.3.5.2.Market Assessment and Forecast, By Application, 2017-2027 ($Million)
6.5.3.6.Taiwan
6.5.3.6.1.Market Assessment and Forecast, By Type, 2017-2027 ($Million)
6.5.3.6.2.Market Assessment and Forecast, By Application, 2017-2027 ($Million)
6.5.3.7.Rest of Asia-Pacific
6.5.3.7.1.Market Assessment and Forecast, By Type, 2017-2027 ($Million)
6.5.3.7.2.Market Assessment and Forecast, By Application, 2017-2027 ($Million)
6.6.Rest of the World
6.6.1. Market Assessment and Forecast, By Country, 2017-2027 ($Million)
6.6.2. Market Assessment and Forecast, By Type, 2017-2027 ($Million)
6.6.3. Market Assessment and Forecast, By Application, 2017-2027 ($Million)
6.6.3.1.Brazil
6.6.3.1.1.Market Assessment and Forecast, By Type, 2017-2027 ($Million)
6.6.3.1.2.Market Assessment and Forecast, By Application, 2017-2027 ($Million)
6.6.3.2.Turkey
6.6.3.2.1.Market Assessment and Forecast, By Type, 2017-2027 ($Million)
6.6.3.2.2.Market Assessment and Forecast, By Application, 2017-2027 ($Million)
6.6.3.3.Saudi Arabia
6.6.3.3.1.Market Assessment and Forecast, By Type, 2017-2027 ($Million)
6.6.3.3.2.Market Assessment and Forecast, By Application, 2017-2027 ($Million)
6.6.3.4.South Africa
6.6.3.4.1.Market Assessment and Forecast, By Type, 2017-2027 ($Million)
6.6.3.4.2.Market Assessment and Forecast, By Application, 2017-2027 ($Million)
6.6.3.5.United Arab Emirates
6.6.3.5.1.Market Assessment and Forecast, By Type, 2017-2027 ($Million)
6.6.3.5.2.Market Assessment and Forecast, By Application, 2017-2027 ($Million)
6.6.3.6.Others
6.6.3.6.1.Market Assessment and Forecast, By Type, 2017-2027 ($Million)
6.6.3.6.2.Market Assessment and Forecast, By Application, 2017-2027 ($Million)
7.Company Profiles
7.1.Albemarle Corporation
7.1.1. Business Overview
7.1.2. Product Portfolio
7.1.3. Key Financials
7.1.4. Strategic Developments
7.2.Arkema Group
7.2.1. Business Overview
7.2.2. Product Portfolio
7.2.3. Key Financials
7.2.4. Strategic Developments
7.3.Chevron Corporation
7.3.1. Business Overview
7.3.2. Product Portfolio
7.3.3. Key Financials
7.3.4. Strategic Developments
7.4.BASF
7.4.1. Business Overview
7.4.2. Product Portfolio
7.4.3. Key Financials
7.4.4. Strategic Developments
7.5.Akzo Nobel N.V.
7.5.1. Business Overview
7.5.2. Product Portfolio
7.5.3. Key Financials
7.5.4. Strategic Developments
7.6.DowDuPont
7.6.1. Business Overview
7.6.2. Product Portfolio
7.6.3. Key Financials
7.6.4. Strategic Developments
7.7.Exxon Mobil Corporation
7.7.1. Business Overview
7.7.2. Product Portfolio
7.7.3. Key Financials
7.7.4. Strategic Developments
7.8.Ineos group
7.8.1. Business Overview
7.8.2. Product Portfolio
7.8.3. Strategic Developments
7.9.Honeywell International Inc.
7.9.1. Business Overview
7.9.2. Product Portfolio
7.9.3. Key Financials
7.9.4. Strategic Developments
7.10.W. R. Grace & Co.-Conn.
7.10.1.Business Overview
7.10.2.Product Portfolio
7.10.3.Key Financials
7.10.4.Strategic Developments
7.11.Air Products and Chemicals, Inc.
7.11.1.Business Overview
7.11.2.Product Portfolio
7.11.3.Key Financials
7.11.4.Strategic Developments
7.12.Zeolyst International Inc.
7.12.1.Business Overview
7.12.2.Product Portfolio
7.12.3.Strategic Developments
7.13.Johnson Matthey PLC
7.13.1.Business Overview
7.13.2.Product Portfolio
7.13.3.Key Financials
7.13.4.Strategic Developments
7.14.Evonik Industries AG
7.14.1.Business Overview
7.14.2.Product Portfolio
7.14.3.Key Financials
7.14.4.Strategic Developments
List of Tables
Table 1.Catalyst Market, By Type ($Million), 2017-2025
Table 2.Chemical compounds Market, By Region ($Million), 2017-2025
Table 3.Amines Market, By Region ($Million), 2017-2025
Table 4.Acids Market, By Region ($Million), 2017-2025
Table 5.Peroxides Market, By Region ($Million), 2017-2025
Table 6.Other Chemicals Market, By Region ($Million), 2017-2025
Table 7.Enzymes Market, By Region ($Million), 2017-2025
Table 8.Metals Market, By Region ($Million), 2017-2025
Table 9.Precious Metals Market, By Region ($Million), 2017-2025
Table 10.Base Metals Market, By Region ($Million), 2017-2025
Table 11.Zeolites Market, By Region ($Million), 2017-2025
Table 12.MFI Market, By Region ($Million), 2017-2025
Table 13.FAU Market, By Region ($Million), 2017-2025
Table 14.LTA Market, By Region ($Million), 2017-2025
Table 15.Other Zeolites Market, By Region ($Million), 2017-2025
Table 16.Organometallic Materials Market, By Region ($Million), 2017-2025
Table 17.Catalyst Market, By Application ($Million), 2017-2025
Table 18.Environmental Market, By Region ($Million), 2017-2025
Table 19.Heavy-duty vehicles Market, By Region ($Million), 2017-2025
Table 20.Light-duty vehicles Market, By Region ($Million), 2017-2025
Table 21.Others Environmental Market, By Region ($Million), 2017-2025
Table 22.Polymer Catalysts Market, By Region ($Million), 2017-2025
Table 23.Reaction Initiator Market, By Region ($Million), 2017-2025
Table 24.Ziegler‐Natta Market, By Region ($Million), 2017-2025
Table 25.Single-site Market, By Region ($Million), 2017-2025
Table 26.Other Polymer Catalyst Market, By Region ($Million), 2017-2025
Table 27.Petroleum Refining Market, By Region ($Million), 2017-2025
Table 28.Alkylation Catalysts Market, By Region ($Million), 2017-2025
Table 29.Fluid Catalytic Cracking (FCC) Market, By Region ($Million), 2017-2025
Table 30.Catalytic Reforming Market, By Region ($Million), 2017-2025
Table 31.Hydroprocessing Catalysts Market, By Region ($Million), 2017-2025
Table 32.Other Petroleum Refining Market, By Region ($Million), 2017-2025
Table 33.Chemical synthesis Market, By Region ($Million), 2017-2025
Table 34.Polyolefins Market, By Region ($Million), 2017-2025
Table 35.Hydrogenation Catalysts Market, By Region ($Million), 2017-2025
Table 36.Catalytic Oxidation Market, By Region ($Million), 2017-2025
Table 37.Other Chemical Synthesis Market, By Region ($Million), 2017-2025
Table 38.Catalyst Market, By Region ($Million), 2017-2025
Table 39.North America Catalyst Market, By Country, 2017-2025 ($Million)
Table 40.North America Catalyst Market, By Type, 2017-2025 ($Million)
Table 41.North America Catalyst Market, By Application, 2017-2025 ($Million)
Table 42.U.S. Catalyst Market, By Type, 2017-2025 ($Million)
Table 43.U.S. Catalyst Market, By Application, 2017-2025 ($Million)
Table 44.Canada Catalyst Market, By Type, 2017-2025 ($Million)
Table 45.Canada Catalyst Market, By Application, 2017-2025 ($Million)
Table 46.Mexico Catalyst Market, By Type, 2017-2025 ($Million)
Table 47.Mexico Catalyst Market, By Application, 2017-2025 ($Million)
Table 48.Europe Catalyst Market, By Country, 2017-2025 ($Million)
Table 49.Europe Catalyst Market, By Type, 2017-2025 ($Million)
Table 50.Europe Catalyst Market, By Application, 2017-2025 ($Million)
Table 51.Germany Catalyst Market, By Type, 2017-2025 ($Million)
Table 52.Germany Catalyst Market, By Application, 2017-2025 ($Million)
Table 53.France Catalyst Market, By Type, 2017-2025 ($Million)
Table 54.France Catalyst Market, By Application, 2017-2025 ($Million)
Table 55.UK Catalyst Market, By Type, 2017-2025 ($Million)
Table 56.UK Catalyst Market, By Application, 2017-2025 ($Million)
Table 57.Italy Catalyst Market, By Type, 2017-2025 ($Million)
Table 58.Italy Catalyst Market, By Application, 2017-2025 ($Million)
Table 59.Spain Catalyst Market, By Type, 2017-2025 ($Million)
Table 60.Spain Catalyst Market, By Application, 2017-2025 ($Million)
Table 61.Russia Catalyst Market, By Type, 2017-2025 ($Million)
Table 62.Russia Catalyst Market, By Application, 2017-2025 ($Million)
Table 63.Rest of Europe Catalyst Market, By Type, 2017-2025 ($Million)
Table 64.Rest of Europe Catalyst Market, By Application, 2017-2025 ($Million)
Table 65.Asia-Pacific Catalyst Market, By Country, 2017-2025 ($Million)
Table 66.Asia-Pacific Catalyst Market, By Type, 2017-2025 ($Million)
Table 67.Asia-Pacific Catalyst Market, By Application, 2017-2025 ($Million)
Table 68.Japan Catalyst Market, By Type, 2017-2025 ($Million)
Table 69.Japan Catalyst Market, By Application, 2017-2025 ($Million)
Table 70.China Catalyst Market, By Type, 2017-2025 ($Million)
Table 70.China Catalyst Market, By Application, 2017-2025 ($Million)
Table 72.Australia Catalyst Market, By Type, 2017-2025 ($Million)
Table 73.Australia Catalyst Market, By Application, 2017-2025 ($Million)
Table 74.India Catalyst Market, By Type, 2017-2025 ($Million)
Table 75.India Catalyst Market, By Application, 2017-2025 ($Million)
Table 76.South Korea Catalyst Market, By Type, 2017-2025 ($Million)
Table 77.South Korea Catalyst Market, By Application, 2017-2025 ($Million)
Table 78.Taiwan Catalyst Market, By Type, 2017-2025 ($Million)
Table 79.Taiwan Catalyst Market, By Application, 2017-2025 ($Million)
Table 80.Rest of Asia-Pacific Catalyst Market, By Type, 2017-2025 ($Million)
Table 81.Rest of Asia-Pacific Catalyst Market, By Application, 2017-2025 ($Million)
Table 82.Rest of the World Catalyst Market, By Country, 2017-2025 ($Million)
Table 83.Rest of the World Catalyst Market, By Type, 2017-2025 ($Million)
Table 84.Rest of the World Catalyst Market, By Application, 2017-2025 ($Million)
Table 85.Brazil Catalyst Market, By Type, 2017-2025 ($Million)
Table 86.Brazil Catalyst Market, By Application, 2017-2025 ($Million)
Table 87.Turkey Catalyst Market, By Type, 2017-2025 ($Million)
Table 88.Turkey Catalyst Market, By Application, 2017-2025 ($Million)
Table 89.Saudi Arabia Catalyst Market, By Type, 2017-2025 ($Million)
Table 90.Saudi Arabia Catalyst Market, By Application, 2017-2025 ($Million)
Table 91.South Africa Catalyst Market, By Type, 2017-2025 ($Million)
Table 92.South Africa Catalyst Market, By Application, 2017-2025 ($Million)
Table 93.United Arab Emirates Catalyst Market, By Type, 2017-2025 ($Million)
Table 94.United Arab Emirates Catalyst Market, By Application, 2017-2025 ($Million)
Table 95.Others Catalyst Market, By Type, 2017-2025 ($Million)
Table 96.Others Catalyst Market, By Application, 2017-2025 ($Million)
Table 97.Albemarle Corporation: Key Strategic Developments, 2017-2017
Table 98.Arkema Group: Key Strategic Developments, 2017-2017
Table 99.Chevron Corporation: Key Strategic Developments, 2017-2017
Table 10.BASF: Key Strategic Developments, 2017-2017
Table 101.Akzo Nobel N.V.: Key Strategic Developments, 2017-2017
Table 102.DowDuPont: Key Strategic Developments, 2017-2017
Table 103.Exxon Mobil Corporation: Key Strategic Developments, 2017-2017
Table 104.Ineos group: Key Strategic Developments, 2017-2017
Table 105.Honeywell International Inc.: Key Strategic Developments, 2017-2017
Table 106.W. R. Grace & Co.-Conn.: Key Strategic Developments, 2017-2017
Table 107.Air Products and Chemicals, Inc.: Key Strategic Developments, 2017-2017
Table 108.Zeolyst International Inc.: Key Strategic Developments, 2017-2017
Table 109.Johnson Matthey PLC: Key Strategic Developments, 2017-2017
Table 110.Evonik Industries AG: Key Strategic Developments, 2017-2017
List of Figures
Figure 1.Catalyst Market Share, By Type, 2017 & 2025 ($Million)
Figure 2.Catalyst Market, By Application, 2017 & 2025 ($Million)
Figure 3.Catalyst Market, By Region, 2017, ($Million)
Figure 4.Albemarle Corporation: Net Revenues, 2017-2017 ($Million)
Figure 5.Albemarle Corporation: Net Revenue Share, By Segment, 2017
Figure 6.Albemarle Corporation: Net Revenue Share, By Geography, 2017
Figure 7.Arkema Group: Net Revenues, 2017-2017 ($Million)
Figure 8.Arkema Group: Net Revenue Share, By Segment, 2017
Figure 9.Arkema Group: Net Revenue Share, By Geography, 2017
Figure 10.Chevron Corporation: Net Revenues, 2017-2017 ($Million)
Figure 11.Chevron Corporation: Net Revenue Share, By Segment, 2017
Figure 12.Chevron Corporation: Net Revenue Share, By Geography, 2017
Figure 13.BASF: Net Revenues, 2017-2017 ($Million)
Figure 14.BASF: Net Revenue Share, By Segment, 2017
Figure 15.BASF: Net Revenue Share, By Geography, 2017
Figure 16.Akzo Nobel N.V.: Net Revenues, 2017-2017 ($Million)
Figure 17.Akzo Nobel N.V.: Net Revenue Share, By Segment, 2017
Figure 18.Akzo Nobel N.V.: Net Revenue Share, By Geography, 2017
Figure 19.DowDuPont: Net Revenues, 2017-2017 ($Million)
Figure 20.DowDuPont: Net Revenue Share, By Segment, 2017
Figure 21.DowDuPont: Net Revenue Share, By Geography, 2017
Figure 22.Exxon Mobil Corporation: Net Revenues, 2017-2017 ($Million)
Figure 23.Exxon Mobil Corporation: Net Revenue Share, By Segment, 2017
Figure 24.Exxon Mobil Corporation: Net Revenue Share, By Geography, 2017
Figure 25.Honeywell International Inc.: Net Revenues, 2017-2017 ($Million)
Figure 26.Honeywell International Inc.: Net Revenue Share, By Segment, 2017
Figure 27.Honeywell International Inc.: Net Revenue Share, By Geography, 2017
Figure 28.W. R. Grace & Co.-Conn.: Net Revenues, 2017-2017 ($Million)
Figure 29.W. R. Grace & Co.-Conn.: Net Revenue Share, By Segment, 2017
Figure 30.W. R. Grace & Co.-Conn.: Net Revenue Share, By Geography, 2017
Figure 31.Air Products and Chemicals, Inc.: Net Revenues, 2017-2017 ($Million)
Figure 32.Air Products and Chemicals, Inc.: Net Revenue Share, By Segment, 2017
Figure 33.Air Products and Chemicals, Inc.: Net Revenue Share, By Geography, 2017
Figure 34.Johnson Matthey PLC: Net Revenues, 2017-2017 ($Million)
Figure 35.Johnson Matthey PLC: Net Revenue Share, By Segment, 2017
Figure 36.Johnson Matthey PLC: Net Revenue Share, By Geography, 2017
Figure 37.Evonik Industries AG: Net Revenues, 2017-2017 ($Million)
Figure 38.Evonik Industries AG: Net Revenue Share, By Segment, 2017
Figure 39.Evonik Industries AG: Net Revenue Share, By Geography, 2017
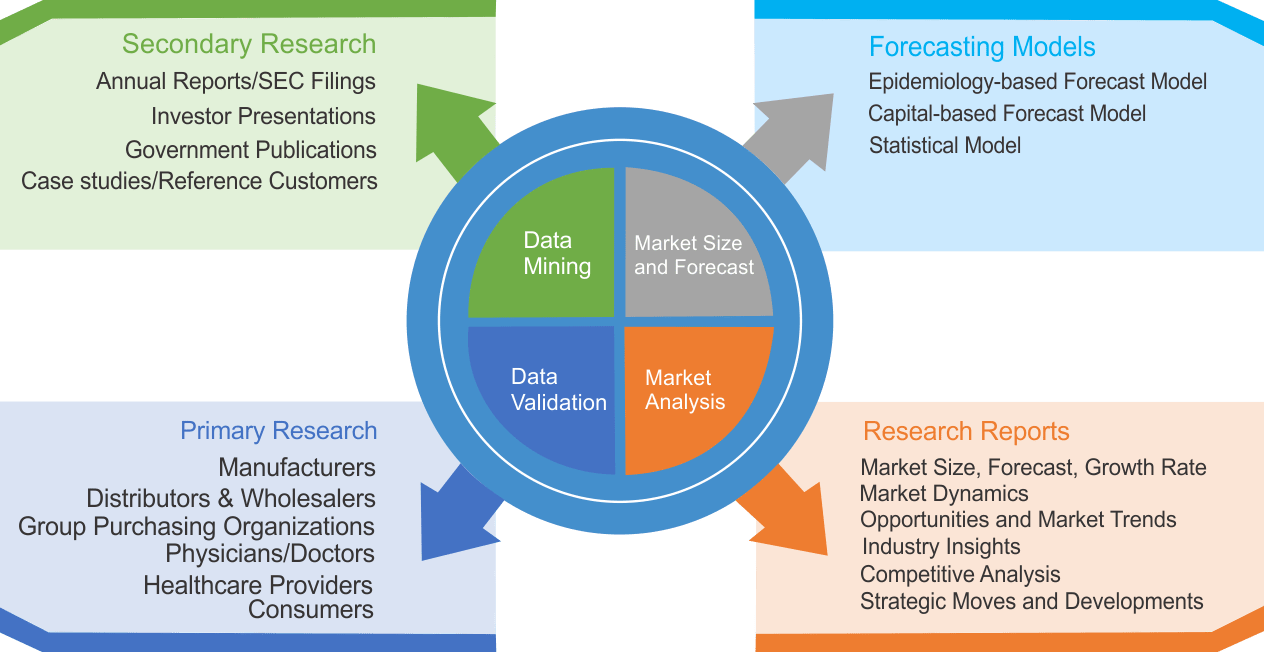
Research Methodology
We use both primary as well as secondary research for our market surveys, estimates and for developing forecast. Our research process commence by analyzing the problem which enable us to design the scope for our research study. Our research process is uniquely designed with enough flexibility to adjust according to changing nature of products and markets, while retaining core element to ensure reliability and accuracy in research findings. We understand both macro and micro-economic factors to evaluate and forecast different market segments.
Data Mining
Data is extensively collected through various secondary sources such as annual reports, investor presentations, SEC filings, and other corporate publications. We also refer trade magazines, technical journals, paid databases such as Factiva and Bloomberg, industry trade journals, scientific journals, and social media data to understand market dynamics and industry trends. Further, we also conduct primary research to understand market drivers, restraints, opportunities, challenges, and competitive scenario to build our analysis.
Data Collection Matrix
|
Data Collection Matrix |
Supply Side |
Demand Side |
|
Primary Data Sources |
|
|
|
Secondary Data Sources |
|
|
Market Modeling and Forecasting
We use epidemiology and capital equipment-based models to forecast market size of different segments at country and regional level.
- Epidemiology-based Forecasting Model: This method uses epidemiology data gathered through various publications and from physicians to estimate population of patients, flow of treatment of individual disease and therapies. The data collected through this method includes statics on incidence of disease, population suffering from disease, and treatment population. This method is used to understand:
- Number of patients for particular device or medical procedure and
- Repeated use of particular device depending on health and condition of patient
- Capital-based Forecasting Model: This method of forecasting is based on number of replacements, installed-based and new sales of capital equipment used in various healthcare and diagnostic centers. These three parameters are calculated and forecast is developed. Installation base is calculated as average number of units per facility; while sales for particular year is calculated from number of new and replace units. Secondary data is collected through various supply chain intermediaries and opinion leaders to arrive at installation and sales rate. These techniques help our analysts in validating market and developed market estimates and forecast.
We do forecast on basis of several parameters such as market drivers, market opportunities, industry trends government regulations, raw materials supply and trade dynamics to ensure relevance of forecast with market scenario. With increasing need to granulized information, we used bottom-up methodology for forecasting where we evaluate each regional segment differently and combined all forecast to develop final market forecast.
Data Validation
We believe primary research is a very important tool in analyzing and forecasting different markets. In order to make sure accuracy of our findings, our team conducts primary interviews at every stage of research to gain deep insights into current business environment and future trends and key developments in market. This includes use of various methods such as telephonic interviews, focus groups, face to face interviews and questionnaires to validate our research from all aspects. We validate our data through primary research from key industry leaders such as CEO, product managers, marketing managers, suppliers, distributors, and consumers are frequently interviewed. These interviews provide valuable insights which help us to have better market understanding besides validating our estimates and forecast.
Data Triangulation
Industry Analysis
|
Qualitative Data |
Quantitative Data (2017-2025) |
|
|