Biolubricants Market by Source, Application, and End User - Global Industry Analysis and Forecast to 2027
Published On : September 2017 Pages : 115 Category: Specialty & Fine Chemicals Report Code : CM09203
Industry Outlook and Trend Analysis
The global biolubricants market was worth USD 1.87 billion in the year 2017 and is predicted to reach approximately USD 3.23 billion by 2027, while registering itself at a compound annual growth rate (CAGR) of 6.24% during the forecast period. Increasing requirement for biolubricants due to its remarkable features such as lower emission levels, biodegradability, high flash points and high viscosity are major factors that boost the growth of the market in several industrial applications. Rising initiatives towards Research and development by major companies that are participating along with enhancements in technology are anticipated to open new opportunities for the growth of this market. Moreover, factors such as green base oils being cost-competitive, rendering significant performance are playing a vital to spur the growth of the market. The development of the automotive industry, specifically in upcoming economies such as India, China, South Africa and Brazil are expected to fuel the consumption of durable products that provide more efficiency of fuel and reduced emissions of carbon from the vehicles. The production of biolubricants widely depends on animal oils as well as vegetable oils that are side products of various industrial processes. Processing technologies that are complicated also boost the cost of production which may hinder the growth of the market.
Raw Material Outlook and Trend Analysis
Oils that are plant-based have proved to be a great alternative for traditional mineral oils as they have an identical structure to hydrocarbons present in mineral oils. As a result, these oils are being used extensively in the production of biolubricants due to its beneficial components such as non-toxicity, environment and economy friendly and renewability. Rising initiatives towards Research and Development in order to analyze chances for the formulation of biolubricants through oils and fats derived from animals are said to fuel the growth of this market significantly in the coming years. These oils provide advantageous possibilities in fields that majorly make use of petrochemical lubricants like healthcare.
Application Outlook and Trend Analysis
The global biolubricants market contains two prime application sectors that are automotive and industrial. These sectors were the largest in the year 2017, which accounted around 56 percent of the total market share. The industry is led by automotive engine oils in this segment, as these oils have superior performance compared to traditional engine oils. Moreover, engine oils that are bio-based emit less poisonous substance to aquatic organisms; have higher rate of biodegradation and extremely low levels of bioaccumulation which are said to be factors that boost the utilization of these oils. A considerable share was held by process oils in industrial applications. These oils are extensively used in the chemicals and technical industries in order to enhance the process of production. Rising requirement for these specialty chemicals in upcoming economies of the Asia Pacific region are said to boost the utilization of these oils.
Regional Outlook and Trend Analysis
In the year 2017 a huge part of this market was occupied by North America which accounted 34.98 percent of share. A modernized industry of automotive in the United States and Canada coupled with rising mediation by the United States government that has stated a limited content that is renewable for different products are anticipated to boost the consumption of bio-based lubricants. The Air force of the United States is said to encourage biodegradable products that are derived from plants in order to promote national security which is also a significant factor that boosts the growth of this market. Asia Pacific came up as a swiftly growing consumer as there are some of the largest hubs of automobile manufacturing in that region. Developing economies such as India, Thailand, Indonesia and China are extensively producing and trading passenger cars along with other vehicles to countries that are developed.
Competitive Insights
The industry of biolubricants is yet in the state of development. However, it contains some major companies that hold a significant share like ExxonMobil, British Petroleum, UBL, Chevron, Shell and S.A. Huge companies that refine oil that are included in the production of traditional lubricants are extensively providing biodegradable lubricants for transportation purposes. The biolubricant market consists of more prominent vendors such as Kluber International, Castrol, Albemarle, Emery Oleochemicals, Petronas Lubricant International and Solution Biogen Sdn Bhd.
The global biolubricants market are segmented as follows-
By Source
- Animal Fats
- Edible and Non-edible oils
- Others
By Applications
- Greases
- Metal working
- Automotive
- Oilfield
- Industrial lubricant
- Others
By End User
- Oil and Gas
- Marine Industry
- Construction
- Automotive Industry
- Others
By Region
- North America
- U.S
- Canada
- Mexico
- Europe
- Germany
- France
- UK
- Italy
- Spain
- Rest of Europe
- Asia-Pacific
- Japan
- China
- Australia
- India
- South Korea
- Rest of Asia Pacific
- Rest of the World
- Brazil
- South Africa
- Saudi Arabia
- United Arab Emirates
- Others
Some of the key questions answered by the report are:
- What was the market size in 2017 and forecast from 2022 to 2027?
- What will be the industry market growth from 2022 to 2027?
- What are the major drivers, restraints, opportunities, challenges, and industry trends and their impact on the market forecast?
- What are the major segments leading the market growth and why?
- Which are the leading players in the market and what are the major strategies adopted by them to sustain the market competition?
Market Classification
- Biolubricants Market, By Source, Estimates and Forecast, 2017-2027 ($Million)
- Animal Fats
- Edible and Non-edible oils
- Other Sources
- Biolubricants Market, By Application, Estimates and Forecast, 2017-2027 ($Million)
- Greases
- Metal working
- Automotive
- Oilfield
- Industrial lubricant
- Other Applications
- Biolubricants Market, By End User, Estimates and Forecast, 2017-2027 ($Million)
- Oil and Gas
- Marine Industry
- Construction
- Automotive Industry
- Other End Users
- Biolubricants Market, By Region, Estimates and Forecast, 2017-2027 ($Million)
- North America
- North America Biolubricants Market, By Country
- North America Biolubricants Market, By Source
- North America Biolubricants Market, By Application
- North America Biolubricants Market, By End User
- U.S. Biolubricants Market, By Source
- U.S. Biolubricants Market, By Application
- U.S. Biolubricants Market, By End User
- Canada Biolubricants Market, By Source
- Canada Biolubricants Market, By Application
- Canada Biolubricants Market, By End User
- Mexico Biolubricants Market, By Source
- Mexico Biolubricants Market, By Application
- Mexico Biolubricants Market, By End User
- North America
-
- Europe
- Europe Biolubricants Market, By Country
- Europe Biolubricants Market, By Source
- Europe Biolubricants Market, By Application
- Europe Biolubricants Market, By End User
- Germany Biolubricants Market, By Source
- Germany Biolubricants Market, By Application
- Germany Biolubricants Market, By End User
- France Biolubricants Market, By Source
- France Biolubricants Market, By Application
- France Biolubricants Market, By End User
- UK Biolubricants Market, By Source
- UK Biolubricants Market, By Application
- UK Biolubricants Market, By End User
- Italy Biolubricants Market, By Source
- Italy Biolubricants Market, By Application
- Italy Biolubricants Market, By End User
- Spain Biolubricants Market, By Source
- Spain Biolubricants Market, By Application
- Spain Biolubricants Market, By End User
- Rest of Europe Biolubricants Market, By Source
- Rest of Europe Biolubricants Market, By Application
- Rest of Europe Biolubricants Market, By End User
- Europe
-
- Asia-Pacific
- Asia-Pacific Biolubricants Market, By Country
- Asia-Pacific Biolubricants Market, By Source
- Asia-Pacific Biolubricants Market, By Application
- Asia-Pacific Biolubricants Market, By End User
- Japan Biolubricants Market, By Source
- Japan Biolubricants Market, By Application
- Japan Biolubricants Market, By End User
- Australia Biolubricants Market, By Source
- Australia Biolubricants Market, By Application
- Australia Biolubricants Market, By End User
- India Biolubricants Market, By Source
- India Biolubricants Market, By Application
- India Biolubricants Market, By End User
- South Korea Biolubricants Market, By Source
- South Korea Biolubricants Market, By Application
- South Korea Biolubricants Market, By End User
- Rest of Asia-Pacific Biolubricants Market, By Source
- Rest of Asia-Pacific Biolubricants Market, By Application
- Rest of Asia-Pacific Biolubricants Market, By End User
- Asia-Pacific
-
- Rest of the World
- Rest of the World Biolubricants Market, By Country
- Rest of the World Biolubricants Market, By Source
- Rest of the World Biolubricants Market, By Application
- Rest of the World Biolubricants Market, By End User
- Brazil Biolubricants Market, By Source
- Brazil Biolubricants Market, By Application
- Brazil Biolubricants Market, By End User
- South Africa Biolubricants Market, By Source
- South Africa Biolubricants Market, By Application
- South Africa Biolubricants Market, By End User
- Saudi Arabia Biolubricants Market, By Source
- Saudi Arabia Biolubricants Market, By Application
- Saudi Arabia Biolubricants Market, By End User
- Turkey Biolubricants Market, By Source
- Turkey Biolubricants Market, By Application
- Turkey Biolubricants Market, By End User
- United Arab Emirates Biolubricants Market, By Source
- United Arab Emirates Biolubricants Market, By Application
- United Arab Emirates Biolubricants Market, By End User
- Others Biolubricants Market, By Source
- Others Biolubricants Market, By Application
- Others Biolubricants Market, By End User
- Rest of the World
Table of Contents
1.Introduction
1.1.Report Description
1.2.Research Methodology
1.2.1. Secondary Research
1.2.2. Primary Research
2.Executive Summary
2.1.Key Highlights
3.Market Overview
3.1.Introduction
3.1.1. Market Definition
3.1.2. Market Segmentation
3.2.Market Share Analysis
3.3.Market Dynamics
3.3.1. Drivers
3.3.1.1.Regulatory initiative for use of Biolubricants
3.3.1.2.Rising environmental concern and stringent regulation over the use of conventional lubricants
3.3.1.3.Eco-friendly nature and rapid degradability of Biolubricants
3.3.2. Restraints
3.3.2.1.High cost of biolubricants
3.3.3. Opportunities
3.3.3.1.Emerging need of Biolubricants in developing nation
3.4.Industry Trends
4.Biolubricants Market, By Source
4.1.Introduction
4.2.Biolubricants Market Assessment and Forecast, By Type, 2017-2027
4.3.Animal Fats
4.3.1. Market Assessment and Forecast, By Region, 2017-2027 ($Million)
4.4.Edible and Non-edible oils
4.4.1. Market Assessment and Forecast, By Region, 2017-2027 ($Million)
4.5.Other Sources
4.5.1. Market Assessment and Forecast, By Region, 2017-2027 ($Million)
5.Biolubricants Market, By Application
5.1.Introduction
5.2.Biolubricants Market Assessment and Forecast, By Application, 2017-2027
5.3.Greases
5.3.1.1.Market Assessment and Forecast, By Region, 2017-2027 ($Million)
5.4.Metal working
5.4.1.1.Market Assessment and Forecast, By Region, 2017-2027 ($Million)
5.5.Automotive
5.5.1.1.Market Assessment and Forecast, By Region, 2017-2027 ($Million)
5.6.Oilfield
5.6.1.1.Market Assessment and Forecast, By Region, 2017-2027 ($Million)
5.7.Industrial lubricant
5.7.1.1.Market Assessment and Forecast, By Region, 2017-2027 ($Million)
5.8.Other Applications
5.8.1.1.Market Assessment and Forecast, By Region, 2017-2027 ($Million)
6.Biolubricants Market, By End User
6.1.Introduction
6.2.Biolubricants Market Assessment and Forecast, By End User, 2017-2027 ($Million)
6.3.Oil and Gas
6.3.1.1.Market Assessment and Forecast, By Region, 2017-2027 ($Million)
6.4.Marine Industry
6.4.1.1.Market Assessment and Forecast, By Region, 2017-2027 ($Million)
6.5.Construction
6.5.1.1.Market Assessment and Forecast, By Region, 2017-2027 ($Million)
6.6.Automotive Industry
6.6.1.1.Market Assessment and Forecast, By Region, 2017-2027 ($Million)
6.7.Other End Users
6.7.1.1.Market Assessment and Forecast, By Region, 2017-2027 ($Million)
7.Biolubricants Market, By Region
7.1.Introduction
7.2.Biolubricants Market Assessment and Forecast, By Region, 2017-2027 ($Million)
7.3.North America
7.3.1. Market Assessment and Forecast, By Country, 2017-2027 ($Million)
7.3.2. Market Assessment and Forecast, By Source, 2017-2027 ($Million)
7.3.3. Market Assessment and Forecast, By Application, 2017-2027 ($Million)
7.3.4. Market Assessment and Forecast, By End User, 2017-2027 ($Million)
7.3.4.1.U.S.
7.3.4.1.1.Market Assessment and Forecast, By Source, 2017-2027 ($Million)
7.3.4.1.2.Market Assessment and Forecast, By Application, 2017-2027 ($Million)
7.3.4.1.3.Market Assessment and Forecast, By End User, 2017-2027 ($Million)
7.3.4.1.4.
7.3.4.2.Canada
7.3.4.2.1.Market Assessment and Forecast, By Source, 2017-2027 ($Million)
7.3.4.2.2.Market Assessment and Forecast, By Application, 2017-2027 ($Million)
7.3.4.2.3.Market Assessment and Forecast, By End User, 2017-2027 ($Million)
7.3.4.3.Mexico
7.3.4.3.1.Market Assessment and Forecast, By Source, 2017-2027 ($Million)
7.3.4.3.2.Market Assessment and Forecast, By Application, 2017-2027 ($Million)
7.3.4.3.3.Market Assessment and Forecast, By End User, 2017-2027 ($Million)
7.4.Europe
7.4.1. Market Assessment and Forecast, By Country, 2017-2027 ($Million)
7.4.2. Market Assessment and Forecast, By Source, 2017-2027 ($Million)
7.4.3. Market Assessment and Forecast, By Application, 2017-2027 ($Million)
7.4.4. Market Assessment and Forecast, By End User, 2017-2027 ($Million)
7.4.4.1.Germany
7.4.4.1.1.Market Assessment and Forecast, By Source, 2017-2027 ($Million)
7.4.4.1.2.Market Assessment and Forecast, By Application, 2017-2027 ($Million)
7.4.4.1.3.Market Assessment and Forecast, By End User, 2017-2027 ($Million)
7.4.4.2.France
7.4.4.2.1.Market Assessment and Forecast, By Source, 2017-2027 ($Million)
7.4.4.2.2.Market Assessment and Forecast, By Source, 2017-2027 ($Million)
7.4.4.2.3.Market Assessment and Forecast, By End User, 2017-2027 ($Million)
7.4.4.3.UK
7.4.4.3.1.Market Assessment and Forecast, By Source, 2017-2027 ($Million)
7.4.4.3.2.Market Assessment and Forecast, By Application, 2017-2027 ($Million)
7.4.4.3.3.Market Assessment and Forecast, By End User, 2017-2027 ($Million)
7.4.4.4.Italy
7.4.4.4.1.Market Assessment and Forecast, By Source, 2017-2027 ($Million)
7.4.4.4.2.Market Assessment and Forecast, By Application, 2017-2027 ($Million)
7.4.4.4.3.Market Assessment and Forecast, By End User, 2017-2027 ($Million)
7.4.4.5.Spain
7.4.4.5.1.Market Assessment and Forecast, By Source, 2017-2027 ($Million)
7.4.4.5.2.Market Assessment and Forecast, By Application, 2017-2027 ($Million)
7.4.4.5.3.Market Assessment and Forecast, By End User, 2017-2027 ($Million)
7.4.4.6.Russia
7.4.4.6.1.Market Assessment and Forecast, By Source, 2017-2027 ($Million)
7.4.4.6.2.Market Assessment and Forecast, By Application, 2017-2027 ($Million)
7.4.4.6.3.Market Assessment and Forecast, By End User, 2017-2027 ($Million)
7.4.4.7.Rest of Europe
7.4.4.7.1.Market Assessment and Forecast, By Source, 2017-2027 ($Million)
7.4.4.7.2.Market Assessment and Forecast, By Application, 2017-2027 ($Million)
7.4.4.7.3.Market Assessment and Forecast, By End User, 2017-2027 ($Million)
7.5.Asia-Pacific
7.5.1. Market Assessment and Forecast, By Country, 2017-2027 ($Million)
7.5.2. Market Assessment and Forecast, By Source, 2017-2027 ($Million)
7.5.3. Market Assessment and Forecast, By Application, 2017-2027 ($Million)
7.5.4. Market Assessment and Forecast, By End User, 2017-2027 ($Million)
7.5.4.1.Japan
7.5.4.1.1.Market Assessment and Forecast, By Source, 2017-2027 ($Million)
7.5.4.1.2.Market Assessment and Forecast, By Application, 2017-2027 ($Million)
7.5.4.1.3.Market Assessment and Forecast, By End User, 2017-2027 ($Million)
7.5.4.2.China
7.5.4.2.1.Market Assessment and Forecast, By Source, 2017-2027 ($Million)
7.5.4.2.2.Market Assessment and Forecast, By Application, 2017-2027 ($Million)
7.5.4.2.3.Market Assessment and Forecast, By End User, 2017-2027 ($Million)
7.5.4.3.Australia
7.5.4.3.1.Market Assessment and Forecast, By Source, 2017-2027 ($Million)
7.5.4.3.2.Market Assessment and Forecast, By Application, 2017-2027 ($Million)
7.5.4.3.3.Market Assessment and Forecast, By End User, 2017-2027 ($Million)
7.5.4.4.India
7.5.4.4.1.Market Assessment and Forecast, By Source, 2017-2027 ($Million)
7.5.4.4.2.Market Assessment and Forecast, By Application, 2017-2027 ($Million)
7.5.4.4.3.Market Assessment and Forecast, By End User, 2017-2027 ($Million)
7.5.4.5.South Korea
7.5.4.5.1.Market Assessment and Forecast, By Source, 2017-2027 ($Million)
7.5.4.5.2.Market Assessment and Forecast, By Application, 2017-2027 ($Million)
7.5.4.5.3.Market Assessment and Forecast, By End User, 2017-2027 ($Million)
7.5.4.6.Taiwan
7.5.4.6.1.Market Assessment and Forecast, By Source, 2017-2027 ($Million)
7.5.4.6.2.Market Assessment and Forecast, By Application, 2017-2027 ($Million)
7.5.4.6.3.Market Assessment and Forecast, By End User, 2017-2027 ($Million)
7.5.4.7.Rest of Asia-Pacific
7.5.4.7.1.Market Assessment and Forecast, By Source, 2017-2027 ($Million)
7.5.4.7.2.Market Assessment and Forecast, By Application, 2017-2027 ($Million)
7.5.4.7.3.Market Assessment and Forecast, By End User, 2017-2027 ($Million)
7.6.Rest of the World
7.6.1. Market Assessment and Forecast, By Country, 2017-2027 ($Million)
7.6.2. Market Assessment and Forecast, By Source, 2017-2027 ($Million)
7.6.3. Market Assessment and Forecast, By Application, 2017-2027 ($Million)
7.6.4. Market Assessment and Forecast, By End User, 2017-2027 ($Million)
7.6.4.1.Brazil
7.6.4.1.1.Market Assessment and Forecast, By Source, 2017-2027 ($Million)
7.6.4.1.2.Market Assessment and Forecast, By Application, 2017-2027 ($Million)
7.6.4.1.3.Market Assessment and Forecast, By End User, 2017-2027 ($Million)
7.6.4.2.Turkey
7.6.4.2.1.Market Assessment and Forecast, By Source, 2017-2027 ($Million)
7.6.4.2.2.Market Assessment and Forecast, By Application, 2017-2027 ($Million)
7.6.4.2.3.Market Assessment and Forecast, By End User, 2017-2027 ($Million)
7.6.4.3.Saudi Arabia
7.6.4.3.1.Market Assessment and Forecast, By Source, 2017-2027 ($Million)
7.6.4.3.2.Market Assessment and Forecast, By Application, 2017-2027 ($Million)
7.6.4.3.3.Market Assessment and Forecast, By End User, 2017-2027 ($Million)
7.6.4.4.South Africa
7.6.4.4.1.Market Assessment and Forecast, By Source, 2017-2027 ($Million)
7.6.4.4.2.Market Assessment and Forecast, By Application, 2017-2027 ($Million)
7.6.4.4.3.Market Assessment and Forecast, By End User, 2017-2027 ($Million)
7.6.4.5.United Arab Emirates
7.6.4.5.1.Market Assessment and Forecast, By Source, 2017-2027 ($Million)
7.6.4.5.2.Market Assessment and Forecast, By Application, 2017-2027 ($Million)
7.6.4.5.3.Market Assessment and Forecast, By End User, 2017-2027 ($Million)
7.6.4.6.Others
7.6.4.6.1.Market Assessment and Forecast, By Source, 2017-2027 ($Million)
7.6.4.6.2.Market Assessment and Forecast, By Application, 2017-2027 ($Million)
7.6.4.6.3.Market Assessment and Forecast, By End User, 2017-2027 ($Million)
8.Company Profiles
8.1.Royal Dutch Shell plc
8.1.1. Business Overview
8.1.2. Product Portfolio
8.1.3. Key Financials
8.1.4. Strategic Developments
8.2.Liquon Lubricants GmbH
8.2.1. Business Overview
8.2.2. Product Portfolio
8.2.3. Strategic Developments
8.3.FUCHS
8.3.1. Business Overview
8.3.2. Product Portfolio
8.3.3. Key Financials
8.3.4. Strategic Developments
8.4.PANOLIN AG
8.4.1. Business Overview
8.4.2. Product Portfolio
8.4.3. Strategic Developments
8.5.Novvi, LLC
8.5.1. Business Overview
8.5.2. Product Portfolio
8.5.3. Strategic Developments
8.6.Goodall, Bates & Todd Limited
8.6.1. Business Overview
8.6.2. Product Portfolio
8.6.3. Strategic Developments
8.7.Exxon Mobil Corporation
8.7.1. Business Overview
8.7.2. Product Portfolio
8.7.3. Key Financials
8.7.4. Strategic Developments
8.8.BP p.l.c.
8.8.1. Business Overview
8.8.2. Product Portfolio
8.8.3. Key Financials
8.8.4. Strategic Developments
8.9.Binol Biolubricants
8.9.1. Business Overview
8.9.2. Product Portfolio
8.9.3. Strategic Developments
8.10.RSC Bio Solutions LLC
8.10.1.Business Overview
8.10.2.Product Portfolio
8.10.3.Strategic Developments
8.11.Albemarle Corporation
8.11.1.Business Overview
8.11.2.Product Portfolio
8.11.3.Key Financials
8.11.4.Strategic Developments
List of Tables
Table 1.Biolubricants Market, By Source ($Million), 2017-2025
Table 2.Animal Fats Market, By Region ($Million), 2017-2025
Table 3.Edible and Non-edible oils Market, By Region ($Million), 2017-2025
Table 4.Other Sources Market, By Region ($Million), 2017-2025
Table 5.Biolubricants Market, By Application ($Million), 2017-2025
Table 6.Greases Market, By Region ($Million), 2017-2025
Table 7.Metal working Market, By Region ($Million), 2017-2025
Table 8.Automotive Market, By Region ($Million), 2017-2025
Table 9.Oilfield By Region ($Million), 2017-2025
Table 10.Industrial lubricant Market, By Region ($Million), 2017-2025
Table 11.Other Applications Market, By Region ($Million), 2017-2025
Table 12.Biolubricants Market, By End User ($Million), 2017-2025
Table 13.Oil and Gas Market, By Region ($Million), 2017-2025
Table 14.Marine Industry Market, By Region ($Million), 2017-2025
Table 15.Construction Market, By Region ($Million), 2017-2025
Table 16.Automotive Industry By Region ($Million), 2017-2025
Table 17.Other End User Market, By Region ($Million), 2017-2025
Table 18.Biolubricants Market, By Region ($Million), 2017-2025
Table 19.North America Biolubricants Market, By Country, 2017-2025 ($Million)
Table 20.North America Biolubricants Market, By Source, 2017-2025 ($Million)
Table 21.North America Biolubricants Market, By Application, 2017-2025 ($Million)
Table 22.North America Biolubricants Market, By End User, 2017-2025 ($Million)
Table 23.U.S. Biolubricants Market, By Source, 2017-2025 ($Million)
Table 24.U.S. Biolubricants Market, By Application, 2017-2025 ($Million)
Table 25.U.S. Biolubricants Market, By End User, 2017-2025 ($Million)
Table 26.Canada Biolubricants Market, By Source, 2017-2025 ($Million)
Table 27.Canada Biolubricants Market, By Application, 2017-2025 ($Million)
Table 28.Canada Biolubricants Market, By End User, 2017-2025 ($Million)
Table 29.Mexico Biolubricants Market, By Source, 2017-2025 ($Million)
Table 30.Mexico Biolubricants Market, By Application, 2017-2025 ($Million)
Table 31.Mexico Biolubricants Market, By End User, 2017-2025 ($Million)
Table 32.Europe Biolubricants Market, By Country, 2017-2025 ($Million)
Table 33.Europe Biolubricants Market, By Source, 2017-2025 ($Million)
Table 34.Europe Biolubricants Market, By Application, 2017-2025 ($Million)
Table 35.Europe Biolubricants Market, By End User, 2017-2025 ($Million)
Table 36.Germany Biolubricants Market, By Source, 2017-2025 ($Million)
Table 37.Germany Biolubricants Market, By Application, 2017-2025 ($Million)
Table 38.Germany Biolubricants Market, By End User, 2017-2025 ($Million)
Table 39.France Biolubricants Market, By Source, 2017-2025 ($Million)
Table 40.France Biolubricants Market, By Application, 2017-2025 ($Million)
Table 41.France Biolubricants Market, By End User, 2017-2025 ($Million)
Table 42.UK Biolubricants Market, By Source, 2017-2025 ($Million)
Table 43.UK Biolubricants Market, By Application, 2017-2025 ($Million)
Table 44.UK Biolubricants Market, By End User, 2017-2025 ($Million)
Table 45.Italy Biolubricants Market, By Source, 2017-2025 ($Million)
Table 46.Italy Biolubricants Market, By Application, 2017-2025 ($Million)
Table 47.Italy Biolubricants Market, By End User, 2017-2025 ($Million)
Table 48.Spain Biolubricants Market, By Source, 2017-2025 ($Million)
Table 49.Spain Biolubricants Market, By Application, 2017-2025 ($Million)
Table 50.Spain Biolubricants Market, By End User, 2017-2025 ($Million)
Table 51.Russia Biolubricants Market, By Source, 2017-2025 ($Million)
Table 52.Russia Biolubricants Market, By Application, 2017-2025 ($Million)
Table 53.Russia Biolubricants Market, By End User, 2017-2025 ($Million)
Table 54.Rest of Europe Biolubricants Market, By Source, 2017-2025 ($Million)
Table 55.Rest of Europe Biolubricants Market, By Application, 2017-2025 ($Million)
Table 56.Rest of Europe Biolubricants Market, By End User, 2017-2025 ($Million)
Table 57.Asia-Pacific Biolubricants Market, By Country, 2017-2025 ($Million)
Table 58.Asia-Pacific Biolubricants Market, By Source, 2017-2025 ($Million)
Table 59.Asia-Pacific Biolubricants Market, By Application, 2017-2025 ($Million)
Table 60.Asia-Pacific Biolubricants Market, By End User, 2017-2025 ($Million)
Table 61.Japan Biolubricants Market, By Source, 2017-2025 ($Million)
Table 62.Japan Biolubricants Market, By Application, 2017-2025 ($Million)
Table 63.Japan Biolubricants Market, By End User, 2017-2025 ($Million)
Table 64.China Biolubricants Market, By Source, 2017-2025 ($Million)
Table 65.China Biolubricants Market, By Application, 2017-2025 ($Million)
Table 66.China Biolubricants Market, By End User, 2017-2025 ($Million)
Table 67.Australia Biolubricants Market, By Source, 2017-2025 ($Million)
Table 68.Australia Biolubricants Market, By Application, 2017-2025 ($Million)
Table 69.Australia Biolubricants Market, By End User, 2017-2025 ($Million)
Table 70.India Biolubricants Market, By Source, 2017-2025 ($Million)
Table 71.India Biolubricants Market, By Application, 2017-2025 ($Million)
Table 72.India Biolubricants Market, By End User, 2017-2025 ($Million)
Table 73.South Korea Biolubricants Market, By Source, 2017-2025 ($Million)
Table 74.South Korea Biolubricants Market, By Application, 2017-2025 ($Million)
Table 75.South Korea Biolubricants Market, By End User, 2017-2025 ($Million)
Table 76.Taiwan Biolubricants Market, By Source, 2017-2025 ($Million)
Table 77.Taiwan Biolubricants Market, By Application, 2017-2025 ($Million)
Table 78.Taiwan Biolubricants Market, By End User, 2017-2025 ($Million)
Table 79.Rest of Asia-Pacific Biolubricants Market, By Source, 2017-2025 ($Million)
Table 80.Rest of Asia-Pacific Biolubricants Market, By Application, 2017-2025 ($Million)
Table 81.Rest of Asia-Pacific Biolubricants Market, By End User, 2017-2025 ($Million)
Table 82.Rest of the World Biolubricants Market, By Country, 2017-2025 ($Million)
Table 83.Rest of the World Biolubricants Market, By Source, 2017-2025 ($Million)
Table 84.Rest of the World Biolubricants Market, By Application, 2017-2025 ($Million)
Table 85.Rest of the World Biolubricants Market, By End User, 2017-2025 ($Million)
Table 86.Brazil Biolubricants Market, By Source, 2017-2025 ($Million)
Table 87.Brazil Biolubricants Market, By Application, 2017-2025 ($Million)
Table 88.Brazil Biolubricants Market, By End User, 2017-2025 ($Million)
Table 89.Turkey Biolubricants Market, By Source, 2017-2025 ($Million)
Table 90.Turkey Biolubricants Market, By Application, 2017-2025 ($Million)
Table 91.Turkey Biolubricants Market, By End User, 2017-2025 ($Million)
Table 92.Saudi Arabia Biolubricants Market, By Source, 2017-2025 ($Million)
Table 93.Saudi Arabia Biolubricants Market, By Application, 2017-2025 ($Million)
Table 94.Saudi Arabia Biolubricants Market, By End User, 2017-2025 ($Million)
Table 95.South Africa Biolubricants Market, By Source, 2017-2025 ($Million)
Table 96.South Africa Biolubricants Market, By Application, 2017-2025 ($Million)
Table 97.South Africa Biolubricants Market, By End User, 2017-2025 ($Million)
Table 98.United Arab Emirates Biolubricants Market, By Source, 2017-2025 ($Million)
Table 99.United Arab Emirates Biolubricants Market, By Application, 2017-2025 ($Million)
Table 100.United Arab Emirates Biolubricants Market, By End User, 2017-2025 ($Million)
Table 101.Others Biolubricants Market, By Source, 2017-2025 ($Million)
Table 102.Others Biolubricants Market, By Application, 2017-2025 ($Million)
Table 103.Others Biolubricants Market, By End User, 2017-2025 ($Million)
Table 104.Royal Dutch Shell plc: Key Strategic Developments, 2017-2017
Table 105.Liquon Lubricants GmbH: Key Strategic Developments, 2017-2017
Table 106.FUCHS: Key Strategic Developments, 2017-2017
Table 107.PANOLIN AG: Key Strategic Developments, 2017-2017
Table 108.Novvi, LLC.: Key Strategic Developments, 2017-2017
Table 109.Goodall, Bates & Todd Limited: Key Strategic Developments, 2017-2017
Table 110.Exxon Mobil Corporation: Key Strategic Developments, 2017-2017
Table 111.BP p.l.c.: Key Strategic Developments, 2017-2017
Table 112.Binol Biolubricants: Key Strategic Developments, 2017-2017
Table 113.RSC Bio Solutions LLC: Key Strategic Developments, 2017-2017
Table 114.Albemarle Corporation: Key Strategic Developments, 2017-2017
List of Figures
Figure 1.Biolubricants Market Share, By Source, 2017 & 2025 ($Million)
Figure 2.Biolubricants Market, By Application, 2017 & 2025 ($Million)
Figure 3.Biolubricants Market, By End User, 2017 & 2025 ($Million)
Figure 4.Biolubricants Market, By Region, 2017, ($Million)
Figure 5.Royal Dutch Shell plc: Net Revenues, 2017-2017 ($Million)
Figure 6.Royal Dutch Shell plc: Net Revenue Share, By Segment, 2017
Figure 7.Royal Dutch Shell plc: Net Revenue Share, By Geography, 2017
Figure 8.FUCHS: Net Revenues, 2017-2017 ($Million)
Figure 9.FUCHS: Net Revenue Share, By Segment, 2017
Figure 10.FUCHS: Net Revenue Share, By Geography, 2017
Figure 11.Exxon Mobil Corporation: Net Revenues, 2017-2017 ($Million)
Figure 12.Exxon Mobil Corporation: Net Revenue Share, By Segment, 2017
Figure 13.Exxon Mobil Corporation: Net Revenue Share, By Geography, 2017
Figure 14.BP p.l.c.: Net Revenues, 2017-2017 ($Million)
Figure 15.BP p.l.c.: Net Revenue Share, By Segment, 2017
Figure 16.BP p.l.c.: Net Revenue Share, By Geography, 2017
Figure 17.Albemarle Corporation: Net Revenues, 2017-2017 ($Million)
Figure 18.Albemarle Corporation: Net Revenue Share, By Segment, 2017
Figure 19.Albemarle Corporation: Net Revenue Share, By Geography, 2017
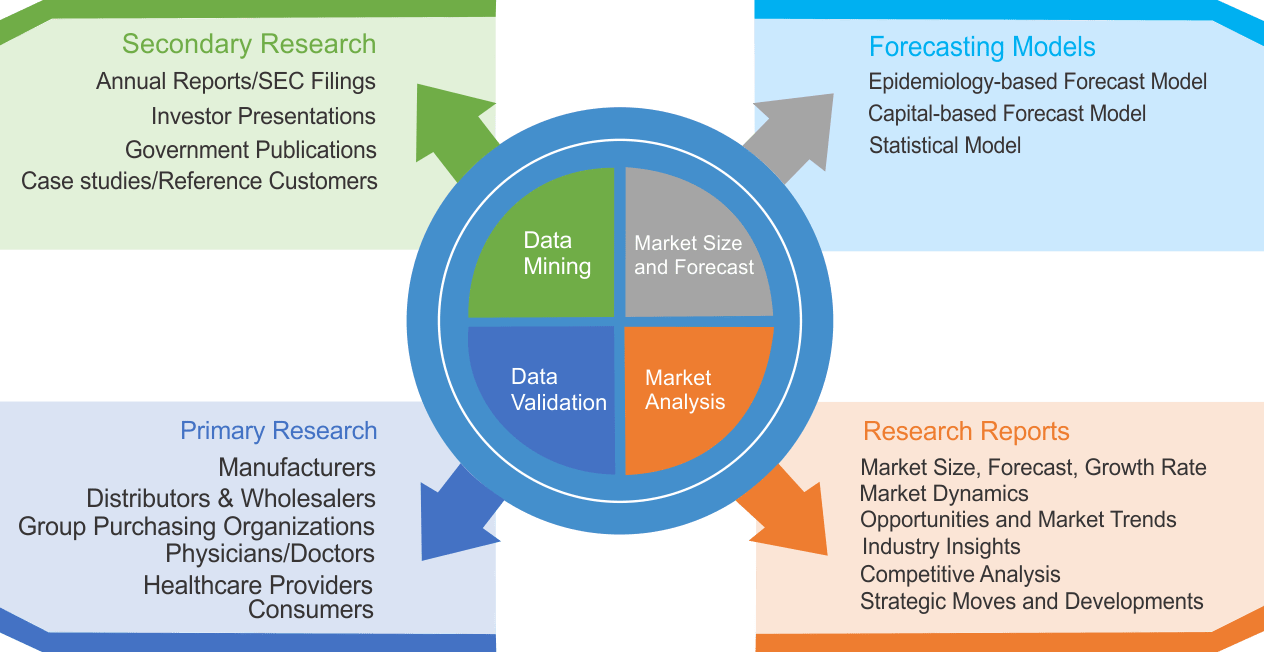
Research Methodology
We use both primary as well as secondary research for our market surveys, estimates and for developing forecast. Our research process commence by analyzing the problem which enable us to design the scope for our research study. Our research process is uniquely designed with enough flexibility to adjust according to changing nature of products and markets, while retaining core element to ensure reliability and accuracy in research findings. We understand both macro and micro-economic factors to evaluate and forecast different market segments.
Data Mining
Data is extensively collected through various secondary sources such as annual reports, investor presentations, SEC filings, and other corporate publications. We also refer trade magazines, technical journals, paid databases such as Factiva and Bloomberg, industry trade journals, scientific journals, and social media data to understand market dynamics and industry trends. Further, we also conduct primary research to understand market drivers, restraints, opportunities, challenges, and competitive scenario to build our analysis.
Data Collection Matrix
|
Data Collection Matrix |
Supply Side |
Demand Side |
|
Primary Data Sources |
|
|
|
Secondary Data Sources |
|
|
Market Modeling and Forecasting
We use epidemiology and capital equipment-based models to forecast market size of different segments at country and regional level.
- Epidemiology-based Forecasting Model: This method uses epidemiology data gathered through various publications and from physicians to estimate population of patients, flow of treatment of individual disease and therapies. The data collected through this method includes statics on incidence of disease, population suffering from disease, and treatment population. This method is used to understand:
- Number of patients for particular device or medical procedure and
- Repeated use of particular device depending on health and condition of patient
- Capital-based Forecasting Model: This method of forecasting is based on number of replacements, installed-based and new sales of capital equipment used in various healthcare and diagnostic centers. These three parameters are calculated and forecast is developed. Installation base is calculated as average number of units per facility; while sales for particular year is calculated from number of new and replace units. Secondary data is collected through various supply chain intermediaries and opinion leaders to arrive at installation and sales rate. These techniques help our analysts in validating market and developed market estimates and forecast.
We do forecast on basis of several parameters such as market drivers, market opportunities, industry trends government regulations, raw materials supply and trade dynamics to ensure relevance of forecast with market scenario. With increasing need to granulized information, we used bottom-up methodology for forecasting where we evaluate each regional segment differently and combined all forecast to develop final market forecast.
Data Validation
We believe primary research is a very important tool in analyzing and forecasting different markets. In order to make sure accuracy of our findings, our team conducts primary interviews at every stage of research to gain deep insights into current business environment and future trends and key developments in market. This includes use of various methods such as telephonic interviews, focus groups, face to face interviews and questionnaires to validate our research from all aspects. We validate our data through primary research from key industry leaders such as CEO, product managers, marketing managers, suppliers, distributors, and consumers are frequently interviewed. These interviews provide valuable insights which help us to have better market understanding besides validating our estimates and forecast.
Data Triangulation
Industry Analysis
|
Qualitative Data |
Quantitative Data (2017-2025) |
|
|