Surface Computing Market By Type, Vision and Application- Global Industry Analysis and Forecast to 2023
Published On : January 2018 Pages : 90 Category: Data Center & Networking Report Code : IC01443
Industry Trend Analysis
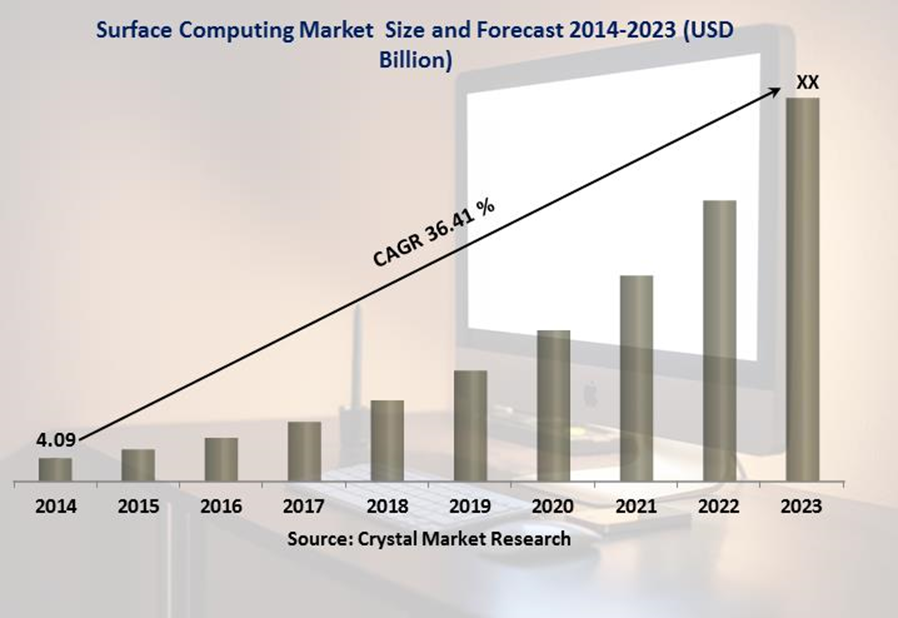
The global Surface Computing Market was worth USD 4.09 billion in 2017 and is expected to reach approximately USD 66.88 billion by 2023, while registering itself at a compound annual growth rate (CAGR) of 36.41% during the forecast period. Surface computing systems, otherwise called tabletop computers, are foreseen to be the eventual fate of desktop. Many organizations besides Microsoft, for example, HP, Sony, and Lenovo are creating computing systems of greater screen size which have been named as tabletop computers. Some of the critical highlights of surface computing incorporate multi-touch and multi-user technology, which helps in perceiving physical protests through touch. It uses regular UI (NUI) to associate with clients, in this manner upgrading the client's involvement of computerized content through characteristic motions, touch, and physical items.
Type Outlook and Trend Analysis
The surface computing market has been sectioned on the basis of type of display into flat and curved displays. Flat display based surface computing systems represented a market share of 92% in 2017. Presently, most of the surface computing systems available in the market contain a flat display and are chiefly two dimensional. Nonetheless, organizations involved in the growth of surface computing systems are focusing toward enhancement of the technology in association with curved and three dimensional base surface computing systems.
Vision Outlook and Trend Analysis
Based on vision the market is segmented into two and three dimensional surface computing systems. The market for curved display and three dimensional surface computing systems is foreseen to grow at a high CAGR in the upcoming years.
Application Outlook and Trend Analysis
Surface computing systems are mainly useful in applications such as financial services, education, automotive, government, entertainment, healthcare, retail and hospitality. Hospitality and retail segments possess a huge share in the surface computing market. The hospitality segment of the surface computing market is anticipated to develop at the highest CAGR in the upcoming years.
Regional Outlook and Trend Analysis
Asia Pacific is foreseen to be the fastest-developing market for surface computing devices and is projected to register a significant CAGR in the upcoming years. North America is the biggest market for surface computing devices and represented for the highest market share of 40% in 2017; it is foreseen to grow at a substantial rate in the upcoming years.
Competitive Insights
The leading players in the market are Touchmagix Media Pvt. Ltd, eyefactive GmbH, 3M, Apple, Microsoft Corporation and vertigo systems GmbH. The major players in the market are profiled in detail in view of qualities, for example, company portfolio, business strategies, financial overview, recent developments, and share of the overall industry.
The Surface Computing Market is segmented as follows-
By Type:
- Flat surface
- Curved Surface
By Vision:
- Two Dimensional
- Three Dimensional
By Application:
- Education
- Automotive
- Hospitality
- Retail
- Government
- Financial Services
- Healthcare
- Others
By Region
- North America
- U.S
- Canada
- Mexico
- Europe
- Germany
- France
- UK
- Italy
- Spain
- Rest of Europe
- Asia-Pacific
- Japan
- China
- Australia
- India
- South Korea
- Rest of Asia Pacific
- Rest of the World
- Brazil
- South Africa
- Saudi Arabia
- United Arab Emirates
- Others
Some of the key questions answered by the report are:
- What was the market size in 2017 and forecast from 2017 to 2023?
- What will be the industry market growth from 2017 to 2023?
- What are the major drivers, restraints, opportunities, challenges, and industry trends and their impact on the market forecast?
- What are the major segments leading the market growth and why?
- Which are the leading players in the market and what are the major strategies adopted by them to sustain the market competition?
Market Classification
- Surface Computing Market, By Type, Estimates and Forecast, 2014-2023($Billion)
- Components
- Display
- Infrared Camera
- Projector
- Sensor
- Processor and Software
- Flat Display
- Curved Display
- Components
- Surface Computing Market, By Vision, Estimates and Forecast, 2014-2023($Billion)
- Two Dimensional
- Three Dimensional
- Surface Computing Market, By Application, Estimates and Forecast, 2014-2023($Billion)
- Automotive
- Education
- Entertainment
- Financial Services
- Government
- Healthcare
- Hospitality
- Retail
- Surface Computing Market, By Region, Estimates and Forecast, 2014-2023($Billion)
- North America
- North America Surface Computing Market, By Country
- North America Surface Computing Market, By Type
- North America Surface Computing Market, By Vision
- North America Surface Computing Market, By Application
- U.S. Surface Computing Market, By Type
- U.S. Surface Computing Market, By Vision
- U.S. Surface Computing Market, By Application
- Canada Surface Computing Market, By Type
- Canada Surface Computing Market, By Vision
- Canada Surface Computing Market, By Application
- Mexico Surface Computing Market, By Type
- Mexico Surface Computing Market, By Vision
- Mexico Surface Computing Market, By Application
-
- Europe
- Europe Surface Computing Market, By Country
- Europe Surface Computing Market, By Type
- Europe Surface Computing Market, By Vision
- Europe Surface Computing Market, By Application
- Germany Surface Computing Market, By Type
- Germany Surface Computing Market, By Vision
- Germany Surface Computing Market, By Application
- France Surface Computing Market, By Type
- France Surface Computing Market, By Vision
- France Surface Computing Market, By Application
- UK Surface Computing Market, By Type
- UK Surface Computing Market, By Vision
- UK Surface Computing Market, By Application
- Italy Surface Computing Market, By Type
- Italy Surface Computing Market, By Vision
- Italy Surface Computing Market, By Application
- Spain Surface Computing Market, By Type
- Spain Surface Computing Market, By Vision
- Spain Surface Computing Market, By Application
- Rest of Europe Surface Computing Market, By Type
- Rest of Europe Surface Computing Market, By Vision
- Rest of Europe Surface Computing Market, By Application
- Europe
-
- Asia-Pacific
- Asia-Pacific Surface Computing Market, By Country
- Asia-Pacific Surface Computing Market, By Type
- Asia-Pacific Surface Computing Market, By Vision
- Asia-Pacific Surface Computing Market, By Application
- Japan Surface Computing Market, By Type
- Japan Surface Computing Market, By Vision
- Japan Surface Computing Market, By Application
- Australia Surface Computing Market, By Type
- Australia Surface Computing Market, By Vision
- Australia Surface Computing Market, By Application
- India Surface Computing Market, By Type
- India Surface Computing Market, By Vision
- India Surface Computing Market, By Application
- South Korea Surface Computing Market, By Type
- South Korea Surface Computing Market, By Vision
- South Korea Surface Computing Market, By Application
- Rest of Asia-Pacific Surface Computing Market, By Type
- Rest of Asia-Pacific Surface Computing Market, By Vision
- Rest of Asia-Pacific Surface Computing Market, By Application
- Asia-Pacific
-
- Rest of the World
- Rest of the World Surface Computing Market, By Country
- Rest of the World Surface Computing Market, By Type
- Rest of the World Surface Computing Market, By Vision
- Rest of the World Surface Computing Market, By Application
- Brazil Surface Computing Market, By Type
- Brazil Surface Computing Market, By Vision
- Brazil Surface Computing Market, By Application
- South Africa Surface Computing Market, By Type
- South Africa Surface Computing Market, By Vision
- South Africa Surface Computing Market, By Application
- Saudi Arabia Surface Computing Market, By Type
- Saudi Arabia Surface Computing Market, By Vision
- Saudi Arabia Surface Computing Market, By Application
- Turkey Surface Computing Market, By Type
- Turkey Surface Computing Market, By Vision
- Turkey Surface Computing Market, By Application
- United Arab Emirates Surface Computing Market, By Type
- United Arab Emirates Surface Computing Market, By Vision
- United Arab Emirates Surface Computing Market, By Application
- Others Surface Computing Market, By Type
- Others Surface Computing Market, By Vision
- Others Surface Computing Market, By Application
- Rest of the World
Table of Contents
1. Introduction
1.1. Report Description
1.2. Research Methodology
1.2.1. Secondary Research
1.2.2. Primary Research
2. Executive Summary
2.1. Key Highlights
3. Market Overview
3.1. Introduction
3.1.1. Market Definition
3.1.2. Market Segmentation
3.2. Market Dynamics
3.2.1. Drivers
3.2.1.1. Rising Business Revenue Due to the Adoption of Multi User Surface Computer is Driving the Growth of This Market
3.2.1.2. Increasing Emphasis of Major Players to Develop Surface Computers is Expected to Create Demand for This Market
3.2.2. Restraints
3.2.2.1. Limited Availability of Features Acts as A Restrain for the Development of Surface Computer Market
3.2.3. Opportunities
3.2.3.1. Emerging Countries to Offer Lucrative Growth Opportunities
4. Surface Computing Market, By Type
4.1. Introduction
4.2. Surface Computing Market Assessment and Forecast, By Type, 2017-2023
4.3. Components
4.3.1. Market Assessment and Forecast, By Type, 2017-2023($Billion)
4.3.2. Market Assessment and Forecast, By Region, 2017-2023($Billion)
4.3.3. Display
4.3.3.1. Market Assessment and Forecast, By Region, 2017-2023($Billion)
4.3.4. Infrared Camera
4.3.4.1. Market Assessment and Forecast, By Region, 2017-2023($Billion)
4.3.5. Projector
4.3.5.1. Market Assessment and Forecast, By Region, 2017-2023($Billion)
4.3.6. Sensor
4.3.6.1. Market Assessment and Forecast, By Region, 2017-2023($Billion)
4.3.7. Processor and Software
4.3.7.1. Market Assessment and Forecast, By Region, 2017-2023($Billion)
4.4. Flat Display
4.4.1. Market Assessment and Forecast, By Region, 2017-2023($Billion)
4.5. Curved Display
4.5.1. Market Assessment and Forecast, By Region, 2017-2023($Billion)
5. Surface Computing Market, By Vision
5.1. Introduction
5.2. Surface Computing Market Assessment and Forecast, By Vision, 2017-2023
5.3. Two Dimensional
5.3.1. Market Assessment and Forecast, By Region, 2017-2023($Billion)
5.4. Three Dimensional
5.4.1. Market Assessment and Forecast, By Region, 2017-2023($Billion)
6. Surface Computing Market, By Application
6.1. Introduction
6.2. Surface Computing Market Assessment and Forecast, By Application, 2017-2023($Billion)
6.3. Automotive
6.3.1. Market Assessment and Forecast, By Region, 2017-2023($Billion)
6.4. Education
6.4.1. Market Assessment and Forecast, By Region, 2017-2023($Billion)
6.5. Entertainment
6.5.1. Market Assessment and Forecast, By Region, 2017-2023($Billion)
6.6. Financial Services
6.6.1. Market Assessment and Forecast, By Region, 2017-2023($Billion)
6.7. Government
6.7.1. Market Assessment and Forecast, By Region, 2017-2023($Billion)
6.8. Healthcare
6.8.1. Market Assessment and Forecast, By Region, 2017-2023($Billion)
6.9. Hospitality
6.9.1. Market Assessment and Forecast, By Region, 2017-2023($Billion)
6.10. Retail
6.10.1. Market Assessment and Forecast, By Region, 2017-2023($Billion)
7. Surface Computing Market, By Region
7.1. Introduction
7.2. Surface Computing Market Assessment and Forecast, By Region, 2017-2023($Billion)
7.3. North America
7.3.1. Market Assessment and Forecast, By Country, 2017-2023($Billion)
7.3.2. Market Assessment and Forecast, By Type, 2017-2023($Billion)
7.3.3. Market Assessment and Forecast, By Vision, 2017-2023($Billion)
7.3.4. Market Assessment and Forecast, By Application, 2017-2023($Billion)
7.3.5. U.S.
7.3.5.1.1. Market Assessment and Forecast, By Type, 2017-2023($Billion)
7.3.5.1.2. Market Assessment and Forecast, By Vision, 2017-2023($Billion)
7.3.5.1.3. Market Assessment and Forecast, By Application, 2017-2023($Billion)
7.3.5.2. Canada
7.3.5.2.1. Market Assessment and Forecast, By Type, 2017-2023($Billion)
7.3.5.2.2. Market Assessment and Forecast, By Vision, 2017-2023($Billion)
7.3.5.2.3. Market Assessment and Forecast, By Application, 2017-2023($Billion)
7.3.5.3. Mexico
7.3.5.3.1. Market Assessment and Forecast, By Type, 2017-2023($Billion)
7.3.5.3.2. Market Assessment and Forecast, By Vision, 2017-2023($Billion)
7.3.5.3.3. Market Assessment and Forecast, By Application, 2017-2023($Billion)
7.4. Europe
7.4.1. Market Assessment and Forecast, By Country, 2017-2023($Billion)
7.4.2. Market Assessment and Forecast, By Type, 2017-2023($Billion)
7.4.3. Market Assessment and Forecast, By Application, 2017-2023($Billion)
7.4.4. Market Assessment and Forecast, By Application, 2017-2023($Billion)
7.4.5. Germany
7.4.5.1.1. Market Assessment and Forecast, By Type, 2017-2023($Billion)
7.4.5.1.2. Market Assessment and Forecast, By Vision, 2017-2023($Billion)
7.4.5.1.3. Market Assessment and Forecast, By Application, 2017-2023($Billion)
7.4.6. France
7.4.6.1.1. Market Assessment and Forecast, By Type, 2017-2023($Billion)
7.4.6.1.2. Market Assessment and Forecast, By Vision, 2017-2023($Billion)
7.4.6.1.3. Market Assessment and Forecast, By Application, 2017-2023($Billion)
7.4.7. UK
7.4.7.1.1. Market Assessment and Forecast, By Type, 2017-2023($Billion)
7.4.7.1.2. Market Assessment and Forecast, By Vision, 2017-2023($Billion)
7.4.7.1.3. Market Assessment and Forecast, By Application, 2017-2023($Billion)
7.4.8. Italy
7.4.8.1.1. Market Assessment and Forecast, By Type, 2017-2023($Billion)
7.4.8.1.2. Market Assessment and Forecast, By Vision, 2017-2023($Billion)
7.4.8.1.3. Market Assessment and Forecast, By Application, 2017-2023($Billion)
7.4.9. Spain
7.4.9.1.1. Market Assessment and Forecast, By Type, 2017-2023($Billion)
7.4.9.1.2. Market Assessment and Forecast, By Vision, 2017-2023($Billion)
7.4.9.1.3. Market Assessment and Forecast, By Application, 2017-2023($Billion)
7.4.9.2. Rest of Europe
7.4.9.2.1. Market Assessment and Forecast, By Type, 2017-2023($Billion)
7.4.9.2.2. Market Assessment and Forecast, By Vision, 2017-2023($Billion)
7.4.9.2.3. Market Assessment and Forecast, By Application, 2017-2023($Billion)
8. Asia-Pacific
8.1.1. Market Assessment and Forecast, By Country, 2017-2023($Billion)
8.1.2. Market Assessment and Forecast, By Type, 2017-2023($Billion)
8.1.3. Market Assessment and Forecast, By Vision, 2017-2023($Billion)
8.1.4. Market Assessment and Forecast, By Application,2017-2023($Billion)
8.1.4.1. Japan
8.1.4.1.1. Market Assessment and Forecast, By Type, 2017-2023($Billion)
8.1.4.1.2. Market Assessment and Forecast, By Vision, 2017-2023($Billion)
8.1.4.1.3. Market Assessment and Forecast, By Application,2017-2023($Billion)
8.1.5. China
8.1.5.1.1. Market Assessment and Forecast, By Type, 2017-2023($Billion)
8.1.5.1.2. Market Assessment and Forecast, By Vision, 2017-2023($Billion)
8.1.5.1.3. Market Assessment and Forecast, By Application,2017-2023($Billion)
8.1.6. Australia
8.1.6.1.1. Market Assessment and Forecast, By Type, 2017-2023($Billion)
8.1.6.1.2. Market Assessment and Forecast, By Vision, 2017-2023($Billion)
8.1.6.1.3. Market Assessment and Forecast, By Application,2017-2023($Billion)
8.1.7. India
8.1.7.1.1. Market Assessment and Forecast, By Type, 2017-2023($Billion)
8.1.7.1.2. Market Assessment and Forecast, By Vision, 2017-2023($Billion)
8.1.7.1.3. Market Assessment and Forecast, By Application,2017-2023($Billion)
8.1.8. South Korea
8.1.8.1.1. Market Assessment and Forecast, By Type, 2017-2023($Billion)
8.1.8.1.2. Market Assessment and Forecast, By Vision, 2017-2023($Billion)
8.1.8.1.3. Market Assessment and Forecast, By Application,2017-2023($Billion)
8.1.9. Rest of Asia-Pacific
8.1.9.1.1. Market Assessment and Forecast, By Type, 2017-2023($Billion)
8.1.9.1.2. Market Assessment and Forecast, By Vision, 2017-2023($Billion)
8.1.9.1.3. Market Assessment and Forecast, By Application,2017-2023($Billion)
9. Rest of the World
9.1.1. Market Assessment and Forecast, By Country, 2017-2023($Billion)
9.1.2. Market Assessment and Forecast, By Type, 2017-2023($Billion)
9.1.3. Market Assessment and Forecast, By Application,2017-2023($Billion)
9.1.4. Market Assessment and Forecast, By Application,2017-2023($Billion)
9.1.5. Brazil
9.1.5.1.1. Market Assessment and Forecast, By Type, 2017-2023($Billion)
9.1.5.1.2. Market Assessment and Forecast, By Vision , 2017-2023($Billion)
9.1.5.1.3. Market Assessment and Forecast, By Application,2017-2023($Billion)
9.1.6. Turkey
9.1.6.1.1. Market Assessment and Forecast, By Type, 2017-2023($Billion)
9.1.6.1.2. Market Assessment and Forecast, By Vision, 2017-2023($Billion)
9.1.6.1.3. Market Assessment and Forecast, By Application,2017-2023($Billion)
9.1.7. Saudi Arabia
9.1.7.1.1. Market Assessment and Forecast, By Type, 2017-2023($Billion)
9.1.7.1.2. Market Assessment and Forecast, By Vision, 2017-2023($Billion)
9.1.7.1.3. Market Assessment and Forecast, By Application,2017-2023($Billion)
9.1.8. South Africa
9.1.8.1.1. Market Assessment and Forecast, By Type, 2017-2023($Billion)
9.1.8.1.2. Market Assessment and Forecast, By Vision, 2017-2023($Billion)
9.1.8.1.3. Market Assessment and Forecast, By Application,2017-2023($Billion)
9.1.9. United Arab Emirates
9.1.9.1.1. Market Assessment and Forecast, By Type, 2017-2023($Billion)
9.1.9.1.2. Market Assessment and Forecast, By Vision, 2017-2023($Billion)
9.1.9.1.3. Market Assessment and Forecast, By Application,2017-2023($Billion)
9.1.10. Others
9.1.10.1.1. Market Assessment and Forecast, By Type, 2017-2023($Billion)
9.1.10.1.2. Market Assessment and Forecast, By Vision, 2017-2023($Billion)
9.1.10.1.3. Market Assessment and Forecast, By Application,2017-2023($Billion)
10. Company Profiles
10.1. Apple Inc.
10.1.1. Business Overview
10.1.2. Product Portfolio
10.1.3. Key Financials
10.1.4. Strategic Developments
10.2. Microsoft Corporation
10.2.1. Business Overview
10.2.2. Product Portfolio
10.2.3. Key Financials
10.2.4. Strategic Developments
10.3. Planar Systems Inc.
10.3.1. Business Overview
10.3.2. Product Portfolio
10.3.3. Key Financials
10.3.4. Strategic Developments
10.4. 3M Co.
10.4.1. Business Overview
10.4.2. Product Portfolio
10.4.3. Key Financials
10.4.4. Strategic Developments
10.5. Eyefactive GmbH
10.5.1. Business Overview
10.5.2. Product Portfolio
10.5.3. Strategic Developments
10.6. Ideum Inc.
10.6.1. Business Overview
10.6.2. Product Portfolio
10.6.3. Strategic Developments
10.7. Nvision Solutions Inc.
10.7.1. Business Overview
10.7.2. Product Portfolio
10.7.3. Key Financials
10.7.4. Strategic Developments
10.8. Sensytouch, Inc
10.8.1. Business Overview
10.8.2. Product Portfolio
10.8.3. Key Financials
10.8.4. Strategic Developments
10.9. Touchmagix Media Private Limited
10.9.1. Business Overview
10.9.2. Product Portfolio
10.9.3. Key Financials
10.9.4. Strategic Developments
10.10.Vertigo Systems GmbH
10.10.1. Business Overview
10.10.2. Product Portfolio
10.10.3. Key Financials
10.10.4. Strategic Developments
List of Tables
Table: Global Surface Computing Market, By Type, 2017-2023($Million)
Table: Components Market, By Type, 2017-2023($Million)
Table: Components Market, By Region, 2017-2023($Million)
Table: Display Market, By Region, 2017-2023($Million)
Table: Infrared Camera Market, By Region, 2017-2023($Million)
Table: Projector Market, By Region, 2017-2023($Million)
Table: Sensor Market, By Region, 2017-2023($Million)
Table: Processor and Software Market, By Region, 2017-2023($Million)
Table: Flat Display Market, By Region, 2017-2023($Million)
Table: Curved Display Market, By Region, 2017-2023($Million)
Table: Global Surface Computing Market, By Vision, 2017-2023($Million)
Table: Two Dimensional Market, By Region, 2017-2023($Million)
Table: Three Dimensional Market, By Region, 2017-2023($Million)
Table: Global Surface Computing Market, By Application, 2017-2023($Million)
Table: Automotive Market, By Region, 2017-2023($Million)
Table: Education Market, By Region, 2017-2023($Million)
Table: Entertainment Market, By Region, 2017-2023($Million)
Table: Financial Services Market, By Region, 2017-2023($Million)
Table: Government Market, By Region, 2017-2023($Million)
Table: Healthcare Market, By Region, 2017-2023($Million)
Table: Hospitality Market, By Region, 2017-2023($Million)
Table: Retail Market, By Region, 2017-2023($Million)
Table: North America Surface Computing Market, By Country, 2017-2023($Million)
Table: North America Surface Computing Market, By Type, 2017-2023($Million)
Table: North America Surface Computing Market, By Vision, 2017-2023($Million)
Table: North America Surface Computing Market, By Application, 2017-2023($Million)
Table: U.S. Surface Computing Market, By Type, 2017-2023($Million)
Table: U.S. Surface Computing Market, By Vision, 2017-2023($Million)
Table: U.S. Surface Computing Market, By Application, 2017-2023($Million)
Table: Canada Surface Computing Market, By Type, 2017-2023($Million)
Table: Canada Surface Computing Market, By Vision, 2017-2023($Million)
Table: Canada Surface Computing Market, By Application, 2017-2023($Million)
Table: Mexico Surface Computing Market, By Type, 2017-2023($Million)
Table: Mexico Surface Computing Market, By Vision, 2017-2023($Million)
Table: Mexico Surface Computing Market, By Application, 2017-2023($Million)
Table: Europe Surface Computing Market, By Country, 2017-2023($Million)
Table: Europe Surface Computing Market, By Type, 2017-2023($Million)
Table: Europe Surface Computing Market, By Vision, 2017-2023($Million)
Table: Europe Surface Computing Market, By Application, 2017-2023($Million)
Table: Germany Surface Computing Market, By Type, 2017-2023($Million)
Table: Germany Surface Computing Market, By Vision, 2017-2023($Million)
Table: Germany Surface Computing Market, By Application, 2017-2023($Million)
Table: France Surface Computing Market, By Type, 2017-2023($Million)
Table: France Surface Computing Market, By Vision, 2017-2023($Million)
Table: France Surface Computing Market, By Application, 2017-2023($Million)
Table: UK Surface Computing Market, By Type, 2017-2023($Million)
Table: UK Surface Computing Market, By Vision, 2017-2023($Million)
Table: UK Surface Computing Market, By Application, 2017-2023($Million)
Table: Italy Surface Computing Market, By Type, 2017-2023($Million)
Table: Italy Surface Computing Market, By Vision, 2017-2023($Million)
Table: Italy Surface Computing Market, By Application, 2017-2023($Million)
Table: Spain Surface Computing Market, By Type, 2017-2023($Million)
Table: Spain Surface Computing Market, By Vision, 2017-2023($Million)
Table: Spain Surface Computing Market, By Application, 2017-2023($Million)
Table: Rest of Europe Surface Computing Market, By Type, 2017-2023($Million)
Table: Rest of Europe Surface Computing Market, By Vision, 2017-2023($Million)
Table: Rest of Europe Surface Computing Market, By Application, 2017-2023($Million)
Table: Asia-Pacific Surface Computing Market, By Country, 2017-2023($Million)
Table: Asia-Pacific Surface Computing Market, By Type, 2017-2023($Million)
Table: Asia-Pacific Surface Computing Market, By Vision, 2017-2023($Million)
Table: Asia-Pacific Surface Computing Market, By Application, 2017-2023($Million)
Table: Japan Surface Computing Market, By Type, 2017-2023($Million)
Table: Japan Surface Computing Market, By Vision, 2017-2023($Million)
Table: Japan Surface Computing Market, By Application, 2017-2023($Million)
Table: China Surface Computing Market, By Type, 2017-2023($Million)
Table: China Surface Computing Market, By Vision, 2017-2023($Million)
Table: China Surface Computing Market, By Application, 2017-2023($Million)
Table: Australia Surface Computing Market, By Type, 2017-2023($Million)
Table: Australia Surface Computing Market, By Vision, 2017-2023($Million)
Table: Australia Surface Computing Market, By Application, 2017-2023($Million)
Table: India Surface Computing Market, By Type, 2017-2023($Million)
Table: India Surface Computing Market, By Vision, 2017-2023($Million)
Table: India Surface Computing Market, By Application, 2017-2023($Million)
Table: South Korea Surface Computing Market, By Type, 2017-2023($Million)
Table: South Korea Surface Computing Market, By Vision, 2017-2023($Million)
Table: South Korea Surface Computing Market, By Application, 2017-2023($Million)
Table: Rest of Asia-Pacific Surface Computing Market, By Type, 2017-2023($Million)
Table: Rest of Asia-Pacific Surface Computing Market, By Vision, 2017-2023($Million)
Table: Rest of Asia-Pacific Surface Computing Market, By Application, 2017-2023($Million)
Table: Rest of the World Surface Computing Market, By Country, 2017-2023($Million)
Table: Rest of the World Surface Computing Market, By Type, 2017-2023($Million)
Table: rest of the World Surface Computing Market, By Vision, 2017-2023($Million)
Table: Rest of the World Surface Computing Market, By Application, 2017-2023($Million)
Table: Brazil Surface Computing Market, By Type, 2017-2023($Million)
Table: Brazil Surface Computing Market, By Vision, 2017-2023($Million)
Table: Brazil Surface Computing Market, By Application, 2017-2023($Million)
Table: Turkey Surface Computing Market, By Type, 2017-2023($Million)
Table: Turkey Surface Computing Market, By Vision, 2017-2023($Million)
Table: Turkey Surface Computing Market, By Application, 2017-2023($Million)
Table: Saudi Arabia Surface Computing Market, By Type, 2017-2023($Million)
Table: Saudi Arabia Surface Computing Market, By Vision, 2017-2023($Million)
Table: Saudi Arabia Surface Computing Market, By Application, 2017-2023($Million)
Table: South Africa Surface Computing Market, By Type, 2017-2023($Million)
Table: South Africa Surface Computing Market, By Vision, 2017-2023($Million)
Table: South Africa Surface Computing Market, By Application, 2017-2023($Million)
Table: United Arab Emirates Surface Computing Market, By Type, 2017-2023($Million)
Table: United Arab Emirates Surface Computing Market, By Vision, 2017-2023($Million)
Table: United Arab Emirates Surface Computing Market, By Application, 2017-2023($Million)
Table: Others Surface Computing Market, By Type, 2017-2023($Million)
Table: Others Surface Computing Market, By Vision, 2017-2023($Million)
Table: Others Surface Computing Market, By Application, 2017-2023($Million)
Table: Apple Inc.: Key Strategic Developments, 2017-2017
Table: Microsoft Corporation: Key Strategic Developments, 2017-2017
Table: Planar Systems Inc.: Key Strategic Developments, 2017-2017
Table: 3M Co.: Key Strategic Developments, 2017-2017
Table: Eyefactive GmbH: Key Strategic Developments, 2017-2017
Table: Ideum Inc.: Key Strategic Developments, 2017-2017
Table: Nvision Solutions Inc.: Key Strategic Developments, 2017-2017
Table: Sensytouch Inc: Key Strategic Developments, 2017-2017
Table: Touchmagix Media Private Limited: Key Strategic Developments, 2017-2017
Table: Vertigo Systems GmbH: Key Strategic Developments, 2017-2017
List of Figures
Figure: Global Surface Computing Market Share, By Type, 2017 & 2023
Figure: Global Surface Computing Market, By Vision, 2017 & 2023 ($Million)
Figure: Global Surface Computing Market, By Application, 2017 & 2023 ($Million)
Figure: Global Surface Computing Market, By Region, 2017 & 2023 ($Million)
Figure: Apple Inc.: Net Revenues, 2017-2017 ($Million)
Figure: Apple Inc.: Net Revenue Share, By Segment, 2017
Figure: Apple Inc.: Net Revenue Share, By Geography, 2017
Figure: Microsoft Corporation: Net Revenues, 2017-2017 ($Million)
Figure: Microsoft Corporation: Net Revenue Share, By Segment, 2017
Figure: Microsoft Corporation: Net Revenue Share, By Geography, 2017
Figure: Planar Systems Inc.: Net Revenues, 2017-2017 ($Million)
Figure: Planar Systems Inc.: Net Revenue Share, By Segment, 2017
Figure: Planar Systems Inc.: Net Revenue Share, By Geography, 2017
Figure: 3M Co.: Net Revenues, 2017-2017 ($Million)
Figure: 3M Co.: Net Revenue Share, By Segment, 2017
Figure: 3M Co.: Net Revenue Share, By Geography, 2017
Figure: Vertigo Systems GmbH: Net Revenues, 2017-2017 ($Million)
Figure: Vertigo Systems GmbH: Net Revenue Share, By Segment, 2017
Figure: Vertigo Systems GmbH: Net Revenue Share, By Geography, 2017
Research Methodology
We use both primary as well as secondary research for our market surveys, estimates and for developing forecast. Our research process commence by analyzing the problem which enable us to design the scope for our research study. Our research process is uniquely designed with enough flexibility to adjust according to changing nature of products and markets, while retaining core element to ensure reliability and accuracy in research findings. We understand both macro and micro-economic factors to evaluate and forecast different market segments.
Data Mining
Data is extensively collected through various secondary sources such as annual reports, investor presentations, SEC filings, and other corporate publications. We also refer trade magazines, technical journals, paid databases such as Factiva and Bloomberg, industry trade journals, scientific journals, and social media data to understand market dynamics and industry trends. Further, we also conduct primary research to understand market drivers, restraints, opportunities, challenges, and competitive scenario to build our analysis.
Data Collection Matrix
|
Data Collection Matrix |
Supply Side |
Demand Side |
|
Primary Data Sources |
|
|
|
Secondary Data Sources |
|
|
Market Modeling and Forecasting
We use epidemiology and capital equipment-based models to forecast market size of different segments at country and regional level.
- Epidemiology-based Forecasting Model: This method uses epidemiology data gathered through various publications and from physicians to estimate population of patients, flow of treatment of individual disease and therapies. The data collected through this method includes statics on incidence of disease, population suffering from disease, and treatment population. This method is used to understand:
- Number of patients for particular device or medical procedure and
- Repeated use of particular device depending on health and condition of patient
- Capital-based Forecasting Model: This method of forecasting is based on number of replacements, installed-based and new sales of capital equipment used in various healthcare and diagnostic centers. These three parameters are calculated and forecast is developed. Installation base is calculated as average number of units per facility; while sales for particular year is calculated from number of new and replace units. Secondary data is collected through various supply chain intermediaries and opinion leaders to arrive at installation and sales rate. These techniques help our analysts in validating market and developed market estimates and forecast.
We do forecast on basis of several parameters such as market drivers, market opportunities, industry trends government regulations, raw materials supply and trade dynamics to ensure relevance of forecast with market scenario. With increasing need to granulized information, we used bottom-up methodology for forecasting where we evaluate each regional segment differently and combined all forecast to develop final market forecast.
Data Validation
We believe primary research is a very important tool in analyzing and forecasting different markets. In order to make sure accuracy of our findings, our team conducts primary interviews at every stage of research to gain deep insights into current business environment and future trends and key developments in market. This includes use of various methods such as telephonic interviews, focus groups, face to face interviews and questionnaires to validate our research from all aspects. We validate our data through primary research from key industry leaders such as CEO, product managers, marketing managers, suppliers, distributors, and consumers are frequently interviewed. These interviews provide valuable insights which help us to have better market understanding besides validating our estimates and forecast.
Data Triangulation

Industry Analysis
|
Qualitative Data |
Quantitative Data (2017-2025) |
|
|