Ophthalmic Surgical Devices Market by Product - Global Industry Analysis and Forecast to 2027
Published On : August 2017 Pages : 95 Category: Medical Devices Report Code : HC08184
Ophthalmic Surgical Devices Market by Product - Global Industry Analysis and Forecast to 2027
Industry Trend Analysis
The global ophthalmic surgical devices market is expected to experience significant growth in coming years between 2022 and 2027. The market is primarily driven by factors such as increasing geriatric population worldwide, rising incidence of eye-related disorders, increasing demand for ophthalmic surgical devices in emerging countries, and technological advancements in the field of ophthalmology. Aging population is more susceptible to developing glaucoma as a result of age related tissue changes. According to the 2017 World Aging Population report by the UN, between 2017 and 2030, the global population aged 60 years and over is expected to grow by 56% from 901 million to 1.4 billion. This number is projected to rise up to 2.1 billion by 2050. With such substantial increase in the older population, the demand for ophthalmic surgical devices will significantly increase in coming years, thus favorably contributing to the growth of ophthalmic surgical devices market during the forecast period. However, factors such as unfavorable reimbursement policies can hamper the growth of ophthalmic surgical devices market during the forecast period.
Product Outlook and Trend Analysis
Refractive errors in the eye occur when parallel light rays entering the eye, do not focus on the retina. Femtosecond lasers are near infrared lasers that are used in refractive and cataract surgeries to facilitate precise corneal cuts. Excimer lasers are another such advanced lasers that are used in procedures such as photorefractive keratectomy (PRK) for refractive corrections. In addition to laser surgeries, glaucoma can also be treated using implants that are used to keep the surgically created opening from closing down. These implants decrease the intra-ocular pressure (IOP) by facilitating the outflow of intra-ocular fluid from the eye.
Regional Outlook and Trend Analysis
North America dominated the global ophthalmic surgical devices market in 2017 owing to the presence of robust healthcare infrastructure in the region leading to the increasing development of minimally invasive surgical techniques. The Asia-Pacific ophthalmic surgical devices market is expected to witness fastest growth during the forecast period due to rising awareness related to eye disorders and their treatments along with increasing disposable income of the people in the region.
Competitive Outlook and Trend Analysis
Some of the key players operating in the ophthalmic surgical devices market include Glaukos Corporation, Alcon Laboratories, Inc. (acquired by Novartis AG), Ellex Medical Lasers Limited, Carl Zeiss Meditec AG, New World Medical, Inc., Johnson & Johnson Services, Inc., A.R.C. Laser GmbH, Ivantis, Inc., Allergan, Inc. (acquired by Actavis plc), Ziemer Ophthalmic Systems AG, IRIDEX Corporation, Valeant Pharmaceuticals International Inc., Topcon America Corporation, NIDEK CO., LTD. and Lumenis Ltd.
The major players focus on product development to introduce advanced products in the market that facilitate minimally invasive procedures. Also, strategic acquisition is a key strategy adopted by major players in the market to strengthen their product portfolio. For instance, in February 2017, Novartis AG’s eye care unit, Alcon, Inc., acquired Transcend Medical, a medical devices company, to strengthen its product portfolio for minimally invasive glaucoma surgery devices.
Ophthalmic Surgical Devices Market Segmentation:
By Product:
- Refractive Error Surgical Devices
- Microkeratomes
- Excimers and Femtosecond Lasers
- Cataract Surgery Devices
- Viscoelastics
- Intraocular Lenses
- Phacoemulsification Systems
- Glaucoma Surgical Devices
- Glaucoma Drainage
- Implants and Stents
- Glaucoma Laser Devices
- Vitreoretinal Surgical Devices
- Photocoagulation Lasers
- Vitrectomy Machines & Vitrectomy Packs
- Illumination Devices
By Region:
- North America
- U.S
- Canada
- Mexico
- Europe
- Germany
- France
- UK
- Italy
- Spain
- Rest of Europe
- Asia-Pacific
- Japan
- China
- Australia
- India
- South Korea
- Rest of Asia Pacific
- Rest of the World
- Brazil
- South Africa
- Saudi Arabia
- United Arab Emirates
- Others
Some of the key questions answered by the report are:
- What was the market size in 2017 and forecast from 2022 to 2027?
- What will be the industry market growth from 2022 to 2027?
- What are the major drivers, restraints, opportunities, challenges, and industry trends and their impact on the market forecast?
- What are the major segments leading the market growth and why?
- Which are the leading players in the market and what are the major strategies adopted by them to sustain the market competition?
Market Classification
- Ophthalmic Surgical Devices Market, By Product, Estimates and Forecast, 2017-2027 ($Million)
- Refractive Error Surgical Devices
- Microkeratomes
- Excimers and Femtosecond Lasers
- Cataract Surgery Devices
- Viscoelastics
- Intraocular Lenses
- Phacoemulsification Systems
- Glaucoma Surgical Devices
- Glaucoma Drainage
- Implants and Stents
- Glaucoma Laser Devices
- Vitreoretinal Surgical Devices
- Photocoagulation Lasers
- Vitrectomy Machines & Vitrectomy Packs
- Illumination Devices
- Ophthalmic Surgical Devices Market, By Region, Estimates and Forecast, 2017-2027 ($Million)
- North America
- North America Ophthalmic Surgical Devices Market, By Country
- North America Ophthalmic Surgical Devices Market, By Product
- U.S. Ophthalmic Surgical Devices Market, By Product
- Canada Ophthalmic Surgical Devices Market, By Product
- Mexico Ophthalmic Surgical Devices Market, By Product
-
- Europe
- Europe Ophthalmic Surgical Devices Market, By Country
- Europe Ophthalmic Surgical Devices Market, By Product
- Germany Ophthalmic Surgical Devices Market, By Product
- France Ophthalmic Surgical Devices Market, By Product
- UK Ophthalmic Surgical Devices Market, By Product
- Italy Ophthalmic Surgical Devices Market, By Product
- Spain Ophthalmic Surgical Devices Market, By Product
- Rest of Europe Ophthalmic Surgical Devices Market, By Product
-
- Asia-Pacific
- Asia-Pacific Ophthalmic Surgical Devices Market, By Country
- Asia-Pacific Ophthalmic Surgical Devices Market, By Product
- Japan Ophthalmic Surgical Devices Market, By Product
- Australia Ophthalmic Surgical Devices Market, By Product
- India Ophthalmic Surgical Devices Market, By Product
- South Korea Ophthalmic Surgical Devices Market, By Product
- Rest of Asia-Pacific Ophthalmic Surgical Devices Market, By Product
- Asia-Pacific
-
- Rest of the World
- Rest of the World Ophthalmic Surgical Devices Market, By Country
- Rest of the World Ophthalmic Surgical Devices Market, By Product
- Brazil Ophthalmic Surgical Devices Market, By Product
- South Africa Ophthalmic Surgical Devices Market, By Product
- Saudi Arabia Ophthalmic Surgical Devices Market, By Product
- Turkey Ophthalmic Surgical Devices Market, By Product
- United Arab Emirates Ophthalmic Surgical Devices Market, By Product
- Others Ophthalmic Surgical Devices Market, By Product
- Rest of the World
Table of Contents
1. Introduction
1.1. Report Description
1.2. Research Methodology
2. Executive Summary
2.1. Key Highlights
3. Market Overview
3.1. Introduction
3.1.1. Market Definition
3.1.2. Market Segmentation
3.2. Market Share Analysis
3.3. Market Dynamics
3.3.1. Drivers
3.3.1.1. Growing Geriatric Population
3.3.1.2. Rising Incidence of Eye-related Disorders
3.3.1.3. Technological Advancements in the field of Ophthalmology
3.3.2. Restraints
3.3.2.1. Unfavorable Reimbursement Policies
3.3.3. Opportunities
3.3.3.1. Emerging Markets to Offer Lucrative Growth Opportunities
3.4. Key Industry Trends
4. Ophthalmic Surgical Devices Market, By Product
4.1. Introduction
4.2. Ophthalmic Surgical Devices Market Assessment and Forecast, By Product, 2017-2027
4.3. Refractive Error Surgical Devices
4.3.1. Market Assessment and Forecast, By Type, 2017-2027 ($Million)
4.3.2. Market Assessment and Forecast, By Region, 2017-2027 ($Million)
4.3.3. Microkeratomes
4.3.3.1. Market Assessment and Forecast, By Region, 2017-2027 ($Million)
4.3.4. Excimers and Femtosecond Lasers
4.3.4.1. Market Assessment and Forecast, By Region, 2017-2027 ($Million)
4.4. Cataract Surgery Devices
4.4.1. Market Assessment and Forecast, By Type, 2017-2027 ($Million)
4.4.2. Market Assessment and Forecast, By Region, 2017-2027 ($Million)
4.4.3. Viscoelastics
4.4.3.1. Market Assessment and Forecast, By Region, 2017-2027 ($Million)
4.4.4. Intraocular Lenses
4.4.4.1. Market Assessment and Forecast, By Region, 2017-2027 ($Million)
4.4.5. Phacoemulsification Systems
4.4.5.1. Market Assessment and Forecast, By Region, 2017-2027 ($Million)
4.5. Glaucoma Surgical Devices
4.5.1. Market Assessment and Forecast, By Type, 2017-2027 ($Million)
4.5.2. Market Assessment and Forecast, By Region, 2017-2027 ($Million)
4.5.3. Glaucoma Drainage
4.5.3.1. Market Assessment and Forecast, By Region, 2017-2027 ($Million)
4.5.4. Implants and Stents
4.5.4.1. Market Assessment and Forecast, By Region, 2017-2027 ($Million)
4.5.5. Glaucoma Laser Devices
4.5.5.1. Market Assessment and Forecast, By Region, 2017-2027 ($Million)
4.6. Vitreoretinal Surgical Devices
4.6.1. Market Assessment and Forecast, By Type, 2017-2027 ($Million)
4.6.2. Market Assessment and Forecast, By Region, 2017-2027 ($Million)
4.6.3. Photocoagulation Lasers
4.6.3.1. Market Assessment and Forecast, By Region, 2017-2027 ($Million)
4.6.4. Vitrectomy Machines & Vitrectomy Packs
4.6.4.1. Market Assessment and Forecast, By Region, 2017-2027 ($Million)
4.6.5. Illumination Devices
4.6.5.1. Market Assessment and Forecast, By Region, 2017-2027 ($Million)
5. Ophthalmic Surgical Devices Market, By Region
5.1. Introduction
5.2. Ophthalmic Surgical Devices Market Assessment and Forecast, By Region, 2017-2027 ($Million)
5.3. North America
5.3.1. Market Assessment and Forecast, By Country, 2017-2027 ($Million)
5.3.2. Market Assessment and Forecast, By Product, 2017-2027 ($Million)
5.3.2.1. U.S.
5.3.2.1.1. Market Assessment and Forecast, By Product, 2017-2027 ($Million)
5.3.2.2. Canada
5.3.2.2.1. Market Assessment and Forecast, By Product, 2017-2027 ($Million)
5.3.2.3. Mexico
5.3.2.3.1. Market Assessment and Forecast, By Product, 2017-2027 ($Million)
5.4. Europe
5.4.1. Market Assessment and Forecast, By Country, 2017-2027 ($Million)
5.4.2. Market Assessment and Forecast, By Product, 2017-2027 ($Million)
5.4.2.1. Germany
5.4.2.1.1. Market Assessment and Forecast, By Product, 2017-2027 ($Million)
5.4.2.2. France
5.4.2.2.1. Market Assessment and Forecast, By Product, 2017-2027 ($Million)
5.4.2.3. UK
5.4.2.3.1. Market Assessment and Forecast, By Product, 2017-2027 ($Million)
5.4.2.4. Italy
5.4.2.4.1. Market Assessment and Forecast, By Product, 2017-2027 ($Million)
5.4.2.5. Spain
5.4.2.5.1. Market Assessment and Forecast, By Product, 2017-2027 ($Million)
5.4.2.6. Russia
5.4.2.6.1. Market Assessment and Forecast, By Product, 2017-2027 ($Million)
5.4.2.7. Rest of Europe
5.4.2.7.1. Market Assessment and Forecast, By Product, 2017-2027 ($Million)
5.5. Asia-Pacific
5.5.1. Market Assessment and Forecast, By Country, 2017-2027 ($Million)
5.5.2. Market Assessment and Forecast, By Product, 2017-2027 ($Million)
5.5.2.1. Japan
5.5.2.1.1. Market Assessment and Forecast, By Product, 2017-2027 ($Million)
5.5.2.2. China
5.5.2.2.1. Market Assessment and Forecast, By Product, 2017-2027 ($Million)
5.5.2.3. Australia
5.5.2.3.1. Market Assessment and Forecast, By Product, 2017-2027 ($Million)
5.5.2.4. India
5.5.2.4.1. Market Assessment and Forecast, By Product, 2017-2027 ($Million)
5.5.2.5. South Korea
5.5.2.5.1. Market Assessment and Forecast, By Product, 2017-2027 ($Million)
5.5.2.6. Taiwan
5.5.2.6.1. Market Assessment and Forecast, By Product, 2017-2027 ($Million)
5.5.2.7. Rest of Asia-Pacific
5.5.2.7.1. Market Assessment and Forecast, By Product, 2017-2027 ($Million)
5.6. Rest of the World
5.6.1. Market Assessment and Forecast, By Country, 2017-2027 ($Million)
5.6.2. Market Assessment and Forecast, By Product, 2017-2027 ($Million)
5.6.2.1. Brazil
5.6.2.1.1. Market Assessment and Forecast, By Product, 2017-2027 ($Million)
5.6.2.2. Turkey
5.6.2.2.1. Market Assessment and Forecast, By Product, 2017-2027 ($Million)
5.6.2.3. Saudi Arabia
5.6.2.3.1. Market Assessment and Forecast, By Product, 2017-2027 ($Million)
5.6.2.4. South Africa
5.6.2.4.1. Market Assessment and Forecast, By Product, 2017-2027 ($Million)
5.6.2.5. United Arab Emirates
5.6.2.5.1. Market Assessment and Forecast, By Product, 2017-2027 ($Million)
5.6.2.6. Others
5.6.2.6.1. Market Assessment and Forecast, By Product, 2017-2027 ($Million)
6. Company Profiles
6.1. Glaukos Corporation
6.1.1. Business Overview
6.1.2. Product Portfolio
6.1.3. Key Financials
6.1.4. Strategic Developments
6.2. Alcon Laboratories, Inc. (acquired by Novartis AG)
6.2.1. Business Overview
6.2.2. Product Portfolio
6.2.3. Key Financials
6.2.4. Strategic Developments
6.3. Ellex Medical Lasers Limited
6.3.1. Business Overview
6.3.2. Product Portfolio
6.3.3. Key Financials
6.3.4. Strategic Developments
6.4. Carl Zeiss Meditec AG
6.4.1. Business Overview
6.4.2. Product Portfolio
6.4.3. Key Financials
6.4.4. Strategic Developments
6.5. New World Medical, Inc.
6.5.1. Business Overview
6.5.2. Product Portfolio
6.5.3. Strategic Developments
6.6. Johnson & Johnson Services, Inc.
6.6.1. Business Overview
6.6.2. Product Portfolio
6.6.3. Strategic Developments
6.7. A.R.C. Laser GmbH
6.7.1. Business Overview
6.7.2. Product Portfolio
6.7.3. Strategic Developments
6.8. Ivantis, Inc.
6.8.1. Business Overview
6.8.2. Product Portfolio
6.8.3. Strategic Developments
6.9. Allergan, Inc. (acquired by Actavis plc)
6.9.1. Business Overview
6.9.2. Product Portfolio
6.9.3. Key Financials
6.9.4. Strategic Developments
6.10. IRIDEX Corporation
6.10.1. Business Overview
6.10.2. Product Portfolio
6.10.3. Key Financials
6.10.4. Strategic Developments
6.11. Lumenis Ltd.
6.11.1. Business Overview
6.11.2. Product Portfolio
6.11.3. Strategic Developments
6.12. Valeant Pharmaceuticals International Inc.
6.12.1. Business Overview
6.12.2. Product Portfolio
6.12.3. Key Financials
6.12.4. Strategic Developments
6.13. Topcon America Corporation
6.13.1. Business Overview
6.13.2. Product Portfolio
6.13.3. Strategic Developments
6.14. Ziemer Ophthalmic Systems AG
6.14.1. Business Overview
6.14.2. Product Portfolio
6.14.3. Strategic Developments
6.15. NIDEK CO., LTD.
6.15.1. Business Overview
6.15.2. Product Portfolio
6.15.3. Strategic Developments
List of Tables
Table 1.Ophthalmic Surgical Devices Market, By Product, 2017-2025 ($Million)
Table 2.Refractive Error Surgical Devices Market, By Type, 2017-2025 ($Million)
Table 3.Refractive Error Surgical Devices Market, By Region, 2017-2025 ($Million)
Table 4.Microkeratomes Market, By Region, 2017-2025 ($Million)
Table 5.Excimers and Femtosecond Lasers Market, By Region, 2017-2025 ($Million)
Table 6.Cataract Surgery Devices Market, By Type, 2017-2025 ($Million)
Table 7.Cataract Surgery Devices Market, By Region, 2017-2025 ($Million)
Table 8.Viscoelastics Market, By Region, 2017-2025 ($Million)
Table 9.Intraocular Lenses Market, By Region, 2017-2025 ($Million)
Table 10.Phacoemulsification Systems Market, By Region, 2017-2025 ($Million)
Table 11.Glaucoma Surgical Devices Market, By Type, 2017-2025 ($Million)
Table 12.Glaucoma Surgical Devices Market, By Region, 2017-2025 ($Million)
Table 13.Glaucoma Drainage Market, By Region, 2017-2025 ($Million)
Table 14.Implants and Stents Market, By Region, 2017-2025 ($Million)
Table 15.Glaucoma Laser Devices Market, By Region, 2017-2025 ($Million)
Table 16.Vitreoretinal Surgical Devices Market, By Type, 2017-2025 ($Million)
Table 17.Vitreoretinal Surgical Devices Market, By Region, 2017-2025 ($Million)
Table 18.Photocoagulation Lasers Market, By Region, 2017-2025 ($Million)
Table 19.Vitrectomy Machines & Vitrectomy Packs Market, By Region, 2017-2025 ($Million)
Table 20.Illumination Devices Market, By Region, 2017-2025 ($Million)
Table 21.Ophthalmic Surgical Devices Market, By Region ($Million), 2017-2025
Table 22.North America Ophthalmic Surgical Devices Market, By Country, 2017-2025 ($Million)
Table 23.North America Ophthalmic Surgical Devices Market, By Product, 2017-2025 ($Million)
Table 24.U.S. Ophthalmic Surgical Devices Market, By Product, 2017-2025 ($Million)
Table 25.Canada Ophthalmic Surgical Devices Market, By Product, 2017-2025 ($Million)
Table 26.Mexico Ophthalmic Surgical Devices Market, By Product, 2017-2025 ($Million)
Table 27.Europe Ophthalmic Surgical Devices Market, By Country, 2017-2025 ($Million)
Table 28.Europe Ophthalmic Surgical Devices Market, By Product, 2017-2025 ($Million)
Table 29.Germany Ophthalmic Surgical Devices Market, By Product, 2017-2025 ($Million)
Table 30.France Ophthalmic Surgical Devices Market, By Product, 2017-2025 ($Million)
Table 31.UK Ophthalmic Surgical Devices Market, By Product, 2017-2025 ($Million)
Table 32.Italy Ophthalmic Surgical Devices Market, By Product, 2017-2025 ($Million)
Table 33.Spain Ophthalmic Surgical Devices Market, By Product, 2017-2025 ($Million)
Table 34.Russia Ophthalmic Surgical Devices Market, By Product, 2017-2025 ($Million)
Table 35.Rest of Europe Ophthalmic Surgical Devices Market, By Product, 2017-2025 ($Million)
Table 36.Asia-Pacific Ophthalmic Surgical Devices Market, By Country, 2017-2025 ($Million)
Table 37.Asia-Pacific Ophthalmic Surgical Devices Market, By Product, 2017-2025 ($Million)
Table 38.Japan Ophthalmic Surgical Devices Market, By Product, 2017-2025 ($Million)
Table 39.China Ophthalmic Surgical Devices Market, By Product, 2017-2025 ($Million)
Table 40.Australia Ophthalmic Surgical Devices Market, By Product, 2017-2025 ($Million)
Table 41.India Ophthalmic Surgical Devices Market, By Product, 2017-2025 ($Million)
Table 42.South Korea Ophthalmic Surgical Devices Market, By Product, 2017-2025 ($Million)
Table 43.Taiwan Ophthalmic Surgical Devices Market, By Product, 2017-2025 ($Million)
Table 44.Rest of Asia-Pacific Ophthalmic Surgical Devices Market, By Product, 2017-2025 ($Million)
Table 45.Rest of the World Ophthalmic Surgical Devices Market, By Country, 2017-2025 ($Million)
Table 46.Rest of the World Ophthalmic Surgical Devices Market, By Product, 2017-2025 ($Million)
Table 47.Brazil Ophthalmic Surgical Devices Market, By Product, 2017-2025 ($Million)
Table 48.Turkey Ophthalmic Surgical Devices Market, By Product, 2017-2025 ($Million)
Table 49.Saudi Arabia Ophthalmic Surgical Devices Market, By Product, 2017-2025 ($Million)
Table 50.South Africa Ophthalmic Surgical Devices Market, By Product, 2017-2025 ($Million)
Table 51.United Arab Emirates Ophthalmic Surgical Devices Market, By Product, 2017-2025 ($Million)
Table 52.Other Ophthalmic Surgical Devices Market, By Product, 2017-2025 ($Million)
Table 53.Glaukos Corporation: Key Strategic Developments, 2017-2017
Table 54.Alcon Laboratories: Key Strategic Developments, 2017-2017
Table 55.Ellex Medical Lasers Limited: Key Strategic Developments, 2017-2017
Table 56.Carl Zeiss Meditec AG: Key Strategic Developments, 2017-2017
Table 57.New World Medical, Inc.: Key Strategic Developments, 2017-2017
Table 58.Johnson & Johnson Services, Inc.: Key Strategic Developments, 2017-2017
Table 59.A.R.C. Laser GmbH: Key Strategic Developments, 2017-2017
Table 60.Ivantis, Inc.: Key Strategic Developments, 2017-2017
Table 61.Allergan, Inc.: Key Strategic Developments, 2017-2017
Table 62.IRIDEX Corporation: Key Strategic Developments, 2017-2017
Table 63.Lumenis Ltd: Key Strategic Developments, 2017-2017
Table 64.Valeant Pharmaceuticals International Inc.: Key Strategic Developments, 2017-2017
Table 65.Topcon America Corporation: Key Strategic Developments, 2017-2017
Table 66.Ziemer Ophthalmic Systems AG: Key Strategic Developments, 2017-2017
Table 67.NIDEK CO., LTD.: Key Strategic Developments, 2017-2017
List of Figures
Figure 1.Ophthalmic Surgical Devices Market, By Product, 2017 & 2025 ($Million)
Figure 2.Refractive Error Surgical Devices Market, By Type, 2017 & 2025 ($Million)
Figure 3.Cataract Surgery Devices Market, By Type, 2017 & 2025 ($Million)
Figure 4.Glaucoma Surgical Devices Market, By Type, 2017 & 2025 ($Million)
Figure 5.Vitreoretinal Surgical Devices Market, By Type, 2017 & 2025 ($Million)
Figure 6.Ophthalmic Surgical Devices Market, By Region, 2017, ($Million)
Figure 7.Glaukos Corporation: Net Revenues, 2017-2017 ($Million)
Figure 8.Glaukos Corporation: Net Revenue Share, By Segment, 2017
Figure 9.Glaukos Corporation: Net Revenue Share, By Geography, 2017
Figure 10.Novartis AG: Net Revenues, 2017-2017 ($Million)
Figure 11.Novartis AG: Net Revenue Share, By Segment, 2017
Figure 12.Novartis AG: Net Revenue Share, By Geography, 2017
Figure 13.Ellex Medical Lasers Limited: Net Revenues, 2017-2017 ($Million)
Figure 14.Ellex Medical Lasers Limited: Net Revenue Share, By Segment, 2017
Figure 15.Ellex Medical Lasers Limited: Net Revenue Share, By Geography, 2017
Figure 16.Carl Zeiss Meditec AG: Net Revenues, 2017-2017 ($Million)
Figure 17.Carl Zeiss Meditec AG: Net Revenue Share, By Segment, 2017
Figure 18.Carl Zeiss Meditec AG: Net Revenue Share, By Geography, 2017
Figure 19.Johnson & Johnson Services, Inc.: Net Revenues, 2017-2017 ($Million)
Figure 20.Johnson & Johnson Services, Inc.: Net Revenue Share, By Segment, 2017
Figure 21.Johnson & Johnson Services, Inc.: Net Revenue Share, By Geography, 2017
Figure 22.Actavis plc: Net Revenues, 2017-2017 ($Million)
Figure 23.Actavis plc: Net Revenue Share, By Segment, 2017
Figure 24.Actavis plc: Net Revenue Share, By Geography, 2017
Figure 25.IRIDEX Corporation: Net Revenues, 2017-2017 ($Million)
Figure 26.IRIDEX Corporation: Net Revenue Share, By Segment, 2017
Figure 27.IRIDEX Corporation: Net Revenue Share, By Geography, 2017
Figure 28.Valeant Pharmaceuticals International Inc.: Net Revenues, 2017-2017 ($Million)
Figure 29.Valeant Pharmaceuticals International Inc.: Net Revenue Share, By Segment, 2017
Figure 30.Valeant Pharmaceuticals International Inc.: Net Revenue Share, By Geography, 2017
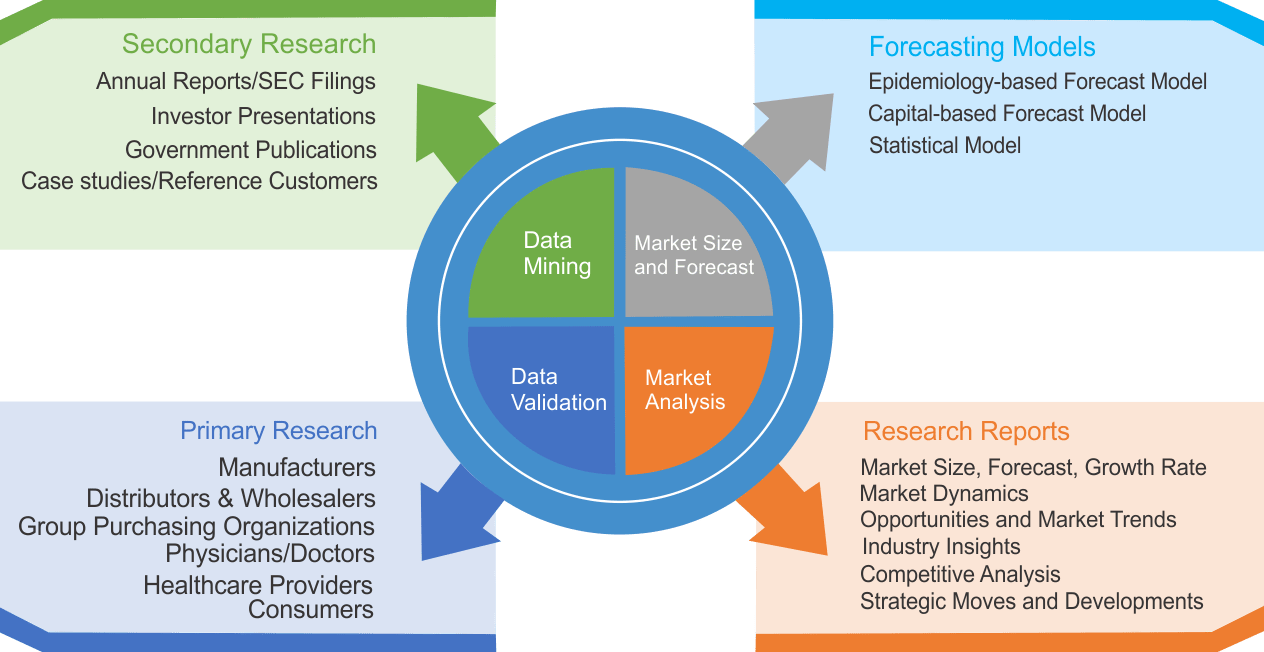
Research Methodology
We use both primary as well as secondary research for our market surveys, estimates and for developing forecast. Our research process commence by analyzing the problem which enable us to design the scope for our research study. Our research process is uniquely designed with enough flexibility to adjust according to changing nature of products and markets, while retaining core element to ensure reliability and accuracy in research findings. We understand both macro and micro-economic factors to evaluate and forecast different market segments.
Data Mining
Data is extensively collected through various secondary sources such as annual reports, investor presentations, SEC filings, and other corporate publications. We also refer trade magazines, technical journals, paid databases such as Factiva and Bloomberg, industry trade journals, scientific journals, and social media data to understand market dynamics and industry trends. Further, we also conduct primary research to understand market drivers, restraints, opportunities, challenges, and competitive scenario to build our analysis.
Data Collection Matrix
|
Data Collection Matrix |
Supply Side |
Demand Side |
|
Primary Data Sources |
|
|
|
Secondary Data Sources |
|
|
Market Modeling and Forecasting
We use epidemiology and capital equipment-based models to forecast market size of different segments at country and regional level.
- Epidemiology-based Forecasting Model: This method uses epidemiology data gathered through various publications and from physicians to estimate population of patients, flow of treatment of individual disease and therapies. The data collected through this method includes statics on incidence of disease, population suffering from disease, and treatment population. This method is used to understand:
- Number of patients for particular device or medical procedure and
- Repeated use of particular device depending on health and condition of patient
- Capital-based Forecasting Model: This method of forecasting is based on number of replacements, installed-based and new sales of capital equipment used in various healthcare and diagnostic centers. These three parameters are calculated and forecast is developed. Installation base is calculated as average number of units per facility; while sales for particular year is calculated from number of new and replace units. Secondary data is collected through various supply chain intermediaries and opinion leaders to arrive at installation and sales rate. These techniques help our analysts in validating market and developed market estimates and forecast.
We do forecast on basis of several parameters such as market drivers, market opportunities, industry trends government regulations, raw materials supply and trade dynamics to ensure relevance of forecast with market scenario. With increasing need to granulized information, we used bottom-up methodology for forecasting where we evaluate each regional segment differently and combined all forecast to develop final market forecast.
Data Validation
We believe primary research is a very important tool in analyzing and forecasting different markets. In order to make sure accuracy of our findings, our team conducts primary interviews at every stage of research to gain deep insights into current business environment and future trends and key developments in market. This includes use of various methods such as telephonic interviews, focus groups, face to face interviews and questionnaires to validate our research from all aspects. We validate our data through primary research from key industry leaders such as CEO, product managers, marketing managers, suppliers, distributors, and consumers are frequently interviewed. These interviews provide valuable insights which help us to have better market understanding besides validating our estimates and forecast.
Data Triangulation
Industry Analysis
|
Qualitative Data |
Quantitative Data (2017-2025) |
|
|