Nutraceuticals Ingredients Market By Type, Application, Form and Health Benefits- Global Industry Analysis and Forecast to 2027
Published On : September 2017 Pages : 120 Category: Nutraceuticals & Functional Foods Report Code : HC09238
Industry Trend Analysis
Nutraceutical Ingredients market is expected to experience significant growth in coming years between 2022 and 2027. The market is expected to become $55.41 billion by 2027 at a growing CAGR of 7.32%. The market is primarily driven by increased incidences of chronic diseases, need for extended life span and wide application of nutraceutical ingredients in various functional areas across the globe. Nutraceutical ingredients are highly beneficial in the cases of chronic diseases. The chronic diseases mainly occur due to nutrient deficiency in the body and it has become a common phenomenon across the globe. For instance, as per CDC, chronic diseases are one of the leading causes of death and disability in US. Even, CDC reported, that about half of all the adults had one or more chronic health conditions. This indicates the rising demand of nutraceuticals ingredients in future years as nutraceutical helps in curing the diseases rapidly. In addition, the rising geriatric population has led to the increase of various health issues which will also fuel the growth of this market over the forecast years. Even, the changing lifestyles and food habits of people will also impact the market growth. Food products consisting of nutraceutical ingredients, helps to combat nutrient deficiency and prevents various disorders in the body. As per survey, people are now getting more inclined towards these kinds of food products to reduce the risk of getting affected by chronic diseases. Thus, all these driving factors ensure steady growth of nutraceutical ingredients market over the forecast period.
Product Type Outlook and Trend Analysis
Nutraceuticals ingredients covers wide range of therapeutic areas from small infections such as cold, cough, sleeping disorders to prevention of life threatening diseases including cancer and cardiovascular diseases. It may range from dietary supplements to genetically modified food products to enhance nutritional value. Probiotics are food products which are used to improve gastrointestinal flora through live microbial feed supplement. Probiotics are used to treat or improve number of gastro intestinal conditions such as lactose intolerance, acute diarrhea and antibiotic associated complications. Another major class of nutraceutical is amino acid. Amino acids are building block of proteins made up of basic amino group and carboxyl group. Amino acids are primarily used for improving muscle growth, reduce fatigue, fasten fat burning process and improve mental wellbeing.
Regional Outlook and Trend Analysis
North America held a significant share of the nutraceutical ingredients market in 2017 due to the rapid changing lifestyle of people and increase in cases of chronic diseases. For instance, as per CDC, in US, seven of the top ten causes of death in 2017 were chronic diseases. The Asia-Pacific market is expected to experience considerable growth of the market due to the rising geriatric population in this region in the upcoming years.
Competitive Outlook and Trend Analysis
The key players operating in the nutraceutical ingredients market emphasize on product development in order to introduce more variants and flavors to capture a larger share of the market. Some of the major players in this market are, Archer Daniels Midland Company (U.S), Cargill, DuPont, Associated British Foods plc (U.K), BASF SE (Germany), Tate & Lyle PLC (U.K) Dean Foods, Ingredion Incorporated (U.S), Ajinomoto Co., Inc. (Japan), Koninklijke DSM N.V. (Netherlands), Arla Foods (Denmark), Nestle S.A., and PepsiCo Inc..
Market Opportunities
The key opportunity for the players operating in nutraceutical ingredients market lies in the development of food and supplements using nutraceutical ingredients. Since people are getting more inclined towards healthy foods and changing lifestyles, the consumption of such foods are likely to increase in the upcoming years. Moreover, increasing awareness towards chronic diseases will also encourage people to consume these supplements, as nutraceutical reduces the risk of chronic diseases. However, daily consumption of such foods may cause some side-effects, thereby imposing negative effect in the market growth.
Nutraceutical Ingredients Market Segmentation:
By Type
- Prebiotics
- Probiotics
- Proteins and amino acids
- Vitamins
- Minerals
- Omega-3 fatty acids
- Carotenoids
- Fibers and Specialty Carbohydrate
- Phytochemical and Plant Extracts
- Others
By Application
- Functional Food
- Functional Beverages
- Dietary Supplements
- Animal Nutrition
- Personal Care
By Form
- Dry
- Liquid
By Health Benefit
- Gut Health
- Bone Health
- Immunity
- Nutrition
- Weight Management
- Other Health Benefits
By Region
- North America
- U.S
- Canada
- Mexico
- Europe
- Germany
- France
- UK
- Italy
- Spain
- Rest of Europe
- Asia-Pacific
- Japan
- China
- Australia
- India
- South Korea
- Rest of Asia Pacific
- Rest of the World
- Brazil
- South Africa
- Saudi Arabia
- United Arab Emirates
- Others
Some of the key questions answered by the report are:
- What was the market size in 2017 and forecast from 2022 to 2027?
- What will be the industry market growth from 2022 to 2027?
- What are the major drivers, restraints, opportunities, challenges, and industry trends and their impact on the market forecast?
- What are the major segments leading the market growth and why?
- Which are the leading players in the market and what are the major strategies adopted by them to sustain the market competition?
Market Classification
- Nutraceutical Ingredients Market, By Type, Estimates and Forecast, 2017-2027 ($Million)
- Prebiotics
- Probiotics
- Proteins and Amino Acids
- Vitamins
- Minerals
- Omega-3 Fatty acids
- Carotenoids
- Fibers and Specialty Carbohydrates
- Phytochemical and Plant Extracts
- Others
- Nutraceutical Ingredients Market, By Application, Estimates and Forecast, 2017-2027 ($Million)
- Functional Food
- Functional Beverages
- Dietary Supplements
- Animal Nutrition
- Personal Care
- Nutraceutical Ingredients Market, By Form, Estimates and Forecast, 2017-2027 ($Million)
- Dry
- Liquid
- Nutraceutical Ingredients Market, By Health Benefits, Estimates and Forecast, 2017-2027 ($Million)
- Gut Health
- Health Benefit
- Bone Health
- Immunity
- Nutrition
- Weight Management
- Others
- Nutraceutical Ingredients Market, By Region, Estimates and Forecast, 2017-2027 ($Million)
- North America
- North America Nutraceutical Ingredients Market, By Country
- North America Nutraceutical Ingredients Market, By Type
- North America Nutraceutical Ingredients Market, By Application
- North America Nutraceutical Ingredients Market, By Form
- North America Nutraceutical Ingredients Market, By Health Benefits
- U.S. Nutraceutical Ingredients Market, By Type
- U.S. Nutraceutical Ingredients Market, By Application
- U.S. Nutraceutical Ingredients Market, By Form
- U.S. Nutraceutical Ingredients Market, By Health Benefits
- Canada Nutraceutical Ingredients Market, By Type
- Canada Nutraceutical Ingredients Market, By Application
- Canada Nutraceutical Ingredients Market, By Form
- Canada Nutraceutical Ingredients Market, By Health Benefits
- Mexico Nutraceutical Ingredients Market, By Type
- Mexico Nutraceutical Ingredients Market, By Application
- Mexico Nutraceutical Ingredients Market, By Form
- Mexico Nutraceutical Ingredients Market, By Health Benefits
-
- Europe
- Europe Nutraceutical Ingredients Market, By Country
- Europe Nutraceutical Ingredients Market, By Type
- Europe Nutraceutical Ingredients Market, By Application
- Europe Nutraceutical Ingredients Market, By Form
- Europe Nutraceutical Ingredients Market, By Health Benefits
- Germany Nutraceutical Ingredients Market, By Type
- Germany Nutraceutical Ingredients Market, By Application
- Germany Nutraceutical Ingredients Market, By Form
- Germany Nutraceutical Ingredients Market, By Health Benefits
- France Nutraceutical Ingredients Market, By Type
- France Nutraceutical Ingredients Market, By Application
- France Nutraceutical Ingredients Market, By Form
- France Nutraceutical Ingredients Market, By Health Benefits
- UK Nutraceutical Ingredients Market, By Type
- UK Nutraceutical Ingredients Market, By Application
- UK Nutraceutical Ingredients Market, By Form
- UK Nutraceutical Ingredients Market, By Health Benefits
- Italy Nutraceutical Ingredients Market, By Type
- Italy Nutraceutical Ingredients Market, By Application
- Italy Nutraceutical Ingredients Market, By Form
- Italy Nutraceutical Ingredients Market, By Health Benefits
- Spain Nutraceutical Ingredients Market, By Type
- Spain Nutraceutical Ingredients Market, By Application
- Spain Nutraceutical Ingredients Market, By Form
- Spain Nutraceutical Ingredients Market, By Health Benefits
- Rest of Europe Nutraceutical Ingredients Market, By Type
- Rest of Europe Nutraceutical Ingredients Market, By Application
- Rest of Europe Nutraceutical Ingredients Market, By Form
- Rest of Europe Nutraceutical Ingredients Market, By Health Benefits
-
- Asia-Pacific
- Asia-Pacific Nutraceutical Ingredients Market, By Country
- Asia-Pacific Nutraceutical Ingredients Market, By Type
- Asia-Pacific Nutraceutical Ingredients Market, By Application
- Asia-Pacific Nutraceutical Ingredients Market, By Form
- Asia-Pacific Nutraceutical Ingredients Market, By Health Benefits
- Japan Nutraceutical Ingredients Market, By Type
- Japan Nutraceutical Ingredients Market, By Application
- Japan Nutraceutical Ingredients Market, By Form
- Japan Nutraceutical Ingredients Market, By Health Benefits
- Australia Nutraceutical Ingredients Market, By Type
- Australia Nutraceutical Ingredients Market, By Application
- Australia Nutraceutical Ingredients Market, By Form
- Australia Nutraceutical Ingredients Market, By Health Benefits
- India Nutraceutical Ingredients Market, By Type
- India Nutraceutical Ingredients Market, By Application
- India Nutraceutical Ingredients Market, By Form
- India Nutraceutical Ingredients Market, By Health Benefits
- South Korea Nutraceutical Ingredients Market, By Type
- South Korea Nutraceutical Ingredients Market, By Application
- South Korea Nutraceutical Ingredients Market, By Form
- South Korea Nutraceutical Ingredients Market, By Health Benefits
- Rest of Asia-Pacific Nutraceutical Ingredients Market, By Type
- Rest of Asia-Pacific Nutraceutical Ingredients Market, By Application
- Rest of Asia-Pacific Nutraceutical Ingredients Market, By Form
- Rest of Asia-Pacific Nutraceutical Ingredients Market, By Health Benefits
- Asia-Pacific
-
- Rest of the World
- Rest of the World Nutraceutical Ingredients Market, By Country
- Rest of the World Nutraceutical Ingredients Market, By Type
- Rest of the World Nutraceutical Ingredients Market, By Application
- Rest of the World Nutraceutical Ingredients Market, By Form
- Rest of the World Nutraceutical Ingredients Market, By Health Benefits
- Brazil Nutraceutical Ingredients Market, By Type
- Brazil Nutraceutical Ingredients Market, By Application
- Brazil Nutraceutical Ingredients Market, By Form
- Brazil Nutraceutical Ingredients Market, By Health Benefits
- South Africa Nutraceutical Ingredients Market, By Type
- South Africa Nutraceutical Ingredients Market, By Application
- South Africa Nutraceutical Ingredients Market, By Form
- South Africa Nutraceutical Ingredients Market, By Health Benefits
- Saudi Arabia Nutraceutical Ingredients Market, By Type
- Saudi Arabia Nutraceutical Ingredients Market, By Application
- Saudi Arabia Nutraceutical Ingredients Market, By Form
- Saudi Arabia Nutraceutical Ingredients Market, By Health Benefits
- Turkey Nutraceutical Ingredients Market, By Type
- Turkey Nutraceutical Ingredients Market, By Application
- Turkey Nutraceutical Ingredients Market, By Form
- Turkey Nutraceutical Ingredients Market, By Health Benefits
- United Arab Emirates Nutraceutical Ingredients Market, By Type
- United Arab Emirates Nutraceutical Ingredients Market, By Application
- United Arab Emirates Nutraceutical Ingredients Market, By Form
- United Arab Emirates Nutraceutical Ingredients Market, By Health Benefits
- Others Nutraceutical Ingredients Market, By Type
- Others Nutraceutical Ingredients Market, By Application
- Others Nutraceutical Ingredients Market, By Form
- Others Nutraceutical Ingredients Market, By Health Benefits
- Rest of the World
Table of Contents
1.Introduction
1.1.Report Description
1.2.Research Methodology
1.2.1. Secondary Research
1.2.2. Primary Research
2.Executive Summary
2.1.Key Highlights
3.Market Overview
3.1.Introduction
3.1.1. Market Definition
3.1.2. Market Segmentation
3.2.Market Share Analysis
3.3.Market Dynamics
3.3.1. Drivers
3.3.1.1.Rapidly Changing Lifestyles and awareness towards chronic diseases
3.3.1.2.Increasing geriatric population across the globe
3.3.1.3.Increasing incidence of chronic diseases
3.3.2. Restraints
3.3.2.1.Risk of getting side-effects due to daily consumption of nutraceuticals added foods
3.3.3. Opportunities
3.3.3.1.Emerging Countries to Offer Lucrative Growth Opportunities
3.4.Industry Trends
4.Nutraceutical Ingredients Market, By Type
4.1.Introduction
4.2.Nutraceutical Ingredients Market Assessment and Forecast, By Type, 2017-2027
4.3.Prebiotics
4.3.1. Market Assessment and Forecast, By Region, 2017-2027 ($Million)
4.4.Probiotics
4.4.1. Market Assessment and Forecast, By Region, 2017-2027 ($Million)
4.5.Proteins and Amino acids
4.5.1. Market Assessment and Forecast, By Region, 2017-2027 ($Million)
4.6.Vitamins
4.6.1. Market Assessment and Forecast, By Region, 2017-2027 ($Million)
4.7.Minerals
4.7.1. Market Assessment and Forecast, By Region, 2017-2027 ($Million)
4.8.Omega-3 Fatty Acids
4.8.1. Market Assessment and Forecast, By Region, 2017-2027 ($Million)
4.9.Carotenoids
4.9.1. Market Assessment and Forecast, By Region, 2017-2027 ($Million)
4.10.Fibers and Specialty Carbohydrates
4.10.1.Market Assessment and Forecast, By Region, 2017-2027 ($Million)
4.11.Phytochemicaland Plant Extracts
4.11.1.Market Assessment and Forecast, By Region, 2017-2027 ($Million)
4.12.Others
4.12.1.Market Assessment and Forecast, By Region, 2017-2027 ($Million)
5.Nutraceutical Ingredients Market, By Application
5.1.Introduction
5.2.Nutraceutical Ingredients MarketAssessment and Forecast, By Application 2017-2027
5.3.Functional Food
5.3.1. Market Assessment and Forecast, By Region, 2017-2027 ($Million)
5.4.Functional Beverages
5.4.1. Market Assessment and Forecast, By Region, 2017-2027 ($Million)
5.5.Dietary Supplements
5.5.1. Market Assessment and Forecast, By Region, 2017-2027 ($Million)
5.6.Animal Nutrition
5.6.1. Market Assessment and Forecast, By Region, 2017-2027 ($Million)
5.7.Personal Care
5.7.1. Market Assessment and Forecast, By Region, 2017-2027 ($Million)
6.Nutraceutical Ingredients Market, By Form
6.1.Introduction
6.2.Nutraceutical Ingredients MarketAssessment and Forecast, By Form 2017-2027 ($Million)
6.3.Dry
6.3.1. Market Assessment and Forecast, By Region, 2017-2027 ($Million)
6.4.Liquid
6.4.1. Market Assessment and Forecast, By Region, 2017-2027 ($Million)
7.Nutraceutical Ingredients Market, By Health Benefits
7.1.Introduction
7.2.Nutraceutical Ingredients MarketAssessment and Forecast, By Health Benefits, 2017-2027 ($Million)
7.3.Gut Health
7.3.1. Market Assessment and Forecast, By Region, 2017-2027 ($Million)
7.4.Health Benefit
7.4.1. Market Assessment and Forecast, By Region, 2017-2027 ($Million)
7.5.Bone Health
7.5.1. Market Assessment and Forecast, By Region, 2017-2027 ($Million)
7.6.Immunity
7.6.1. Market Assessment and Forecast, By Region, 2017-2027 ($Million)
7.7.Nutrition
7.7.1. Market Assessment and Forecast, By Region, 2017-2027 ($Million)
7.8.Weight management
7.8.1. Market Assessment and Forecast, By Region, 2017-2027 ($Million)
7.9.Others
7.9.1. Market Assessment and Forecast, By Region, 2017-2027 ($Million)
8.Nutraceutical Ingredients Market, By Region
8.1.Introduction
8.2.Nutraceutical Ingredients Market Assessment and Forecast, By Region, 2017-2027 ($Million)
8.3.North America
8.3.1. Market Assessment and Forecast, By Country, 2017-2027 ($Million)
8.3.2. Market Assessment and Forecast, By Type, 2017-2027 ($Million)
8.3.3. Market Assessment and Forecast, By Application, 2017-2027 ($Million)
8.3.4. Market Assessment and Forecast, By Form, 2017-2027 ($Million)
8.3.5. Market Assessment and Forecast, By Health Benefits, 2017-2027 ($Million)
8.3.5.1.U.S.
8.3.5.1.1.Market Assessment and Forecast, By Type, 2017-2027 ($Million)
8.3.5.1.2.Market Assessment and Forecast, By Application, 2017-2027 ($Million)
8.3.5.1.3.Market Assessment and Forecast, By Form, 2017-2027 ($Million)
8.3.5.1.4.Market Assessment and Forecast, By Health Benefits, 2017-2027 ($Million)
8.3.5.2.Canada
8.3.5.2.1.Market Assessment and Forecast, By Type, 2017-2027 ($Million)
8.3.5.2.2.Market Assessment and Forecast, By Application, 2017-2027 ($Million)
8.3.5.2.3.Market Assessment and Forecast, By Form, 2017-2027 ($Million)
8.3.5.2.4.Market Assessment and Forecast, By Health Benefits, 2017-2027 ($Million)
8.3.5.3.Mexico
8.3.5.3.1.Market Assessment and Forecast, By Type, 2017-2027 ($Million)
8.3.5.3.2.Market Assessment and Forecast, By Application, 2017-2027 ($Million)
8.3.5.3.3.Market Assessment and Forecast, By Form, 2017-2027 ($Million)
8.3.5.3.4.Market Assessment and Forecast, By Health Benefits, 2017-2027 ($Million)
8.4.Europe
8.4.1. Market Assessment and Forecast, By Country, 2017-2027 ($Million)
8.4.2. Market Assessment and Forecast, By Type, 2017-2027 ($Million)
8.4.3. Market Assessment and Forecast, By Application, 2017-2027 ($Million)
8.4.4. Market Assessment and Forecast, By Form, 2017-2027 ($Million)
8.4.5. Market Assessment and Forecast, By Health Benefits, 2017-2027 ($Million)
8.4.5.1.Germany
8.4.5.1.1.Market Assessment and Forecast, By Type, 2017-2027 ($Million)
8.4.5.1.2.Market Assessment and Forecast, By Application, 2017-2027 ($Million)
8.4.5.1.3.Market Assessment and Forecast, By Form, 2017-2027 ($Million)
8.4.5.1.4.Market Assessment and Forecast, By Health Benefits, 2017-2027 ($Million)
8.4.5.2.France
8.4.5.2.1.Market Assessment and Forecast, By Type, 2017-2027 ($Million)
8.4.5.2.2.Market Assessment and Forecast, By Application, 2017-2027 ($Million)
8.4.5.2.3.Market Assessment and Forecast, By Form, 2017-2027 ($Million)
8.4.5.2.4.Market Assessment and Forecast, By Health Benefits, 2017-2027 ($Million)
8.4.5.3.UK
8.4.5.3.1.Market Assessment and Forecast, By Type, 2017-2027 ($Million)
8.4.5.3.2.Market Assessment and Forecast, By Application, 2017-2027 ($Million)
8.4.5.3.3.Market Assessment and Forecast, By Form, 2017-2027 ($Million)
8.4.5.3.4.Market Assessment and Forecast, By Health Benefits, 2017-2027 ($Million)
8.4.5.4.Italy
8.4.5.4.1.Market Assessment and Forecast, By Type, 2017-2027 ($Million)
8.4.5.4.2.Market Assessment and Forecast, By Application, 2017-2027 ($Million)
8.4.5.4.3.Market Assessment and Forecast, By Form, 2017-2027 ($Million)
8.4.5.4.4.Market Assessment and Forecast, By Health Benefits, 2017-2027 ($Million)
8.4.5.5.Spain
8.4.5.5.1.Market Assessment and Forecast, By Type, 2017-2027 ($Million)
8.4.5.5.2.Market Assessment and Forecast, By Application, 2017-2027 ($Million)
8.4.5.5.3.Market Assessment and Forecast, By Form, 2017-2027 ($Million)
8.4.5.5.4.Market Assessment and Forecast, By Health Benefits, 2017-2027 ($Million)
8.4.5.6.Russia
8.4.5.6.1.Market Assessment and Forecast, By Type, 2017-2027 ($Million)
8.4.5.6.2.Market Assessment and Forecast, By Application, 2017-2027 ($Million)
8.4.5.6.3.Market Assessment and Forecast, By Form, 2017-2027 ($Million)
8.4.5.6.4.Market Assessment and Forecast, By Health Benefits, 2017-2027 ($Million)
8.4.5.7.Rest of Europe
8.4.5.7.1.Market Assessment and Forecast, By Type, 2017-2027 ($Million)
8.4.5.7.2.Market Assessment and Forecast, By Application, 2017-2027 ($Million)
8.4.5.7.3.Market Assessment and Forecast, By Form, 2017-2027 ($Million)
8.4.5.7.4.Market Assessment and Forecast, By Health Benefits, 2017-2027 ($Million)
8.5.Asia-Pacific
8.5.1. Market Assessment and Forecast, By Country, 2017-2027 ($Million)
8.5.2. Market Assessment and Forecast, By Type, 2017-2027 ($Million)
8.5.3. Market Assessment and Forecast, By Application, 2017-2027 ($Million)
8.5.4. Market Assessment and Forecast, By Form, 2017-2027 ($Million)
8.5.5. Market Assessment and Forecast, By Health Benefits, 2017-2027 ($Million)
8.5.5.1.Japan
8.5.5.1.1.Market Assessment and Forecast, By Type, 2017-2027 ($Million)
8.5.5.1.2.Market Assessment and Forecast, By Application, 2017-2027 ($Million)
8.5.5.1.3.Market Assessment and Forecast, By Form, 2017-2027 ($Million)
8.5.5.1.4.Market Assessment and Forecast, By Health Benefits, 2017-2027 ($Million)
8.5.5.2.China
8.5.5.2.1.Market Assessment and Forecast, By Type, 2017-2027 ($Million)
8.5.5.2.2.Market Assessment and Forecast, By Application, 2017-2027 ($Million)
8.5.5.2.3.Market Assessment and Forecast, By Form, 2017-2027 ($Million)
8.5.5.2.4.Market Assessment and Forecast, By Health Benefits, 2017-2027 ($Million)
8.5.5.3.Australia
8.5.5.3.1.Market Assessment and Forecast, By Type, 2017-2027 ($Million)
8.5.5.3.2.Market Assessment and Forecast, By Application, 2017-2027 ($Million)
8.5.5.3.3.Market Assessment and Forecast, By Form, 2017-2027 ($Million)
8.5.5.3.4.Market Assessment and Forecast, By Health Benefits, 2017-2027 ($Million)
8.5.5.4.India
8.5.5.4.1.Market Assessment and Forecast, By Type, 2017-2027 ($Million)
8.5.5.4.2.Market Assessment and Forecast, By Application, 2017-2027 ($Million)
8.5.5.4.3.Market Assessment and Forecast, By Form, 2017-2027 ($Million)
8.5.5.4.4.Market Assessment and Forecast, By Health Benefits, 2017-2027 ($Million)
8.5.5.5.South Korea
8.5.5.5.1.Market Assessment and Forecast, By Type, 2017-2027 ($Million)
8.5.5.5.2.Market Assessment and Forecast, By Application, 2017-2027 ($Million)
8.5.5.5.3.Market Assessment and Forecast, By Form, 2017-2027 ($Million)
8.5.5.5.4.Market Assessment and Forecast, By Health Benefits, 2017-2027 ($Million)
8.5.5.6.Taiwan
8.5.5.6.1.Market Assessment and Forecast, By Type, 2017-2027 ($Million)
8.5.5.6.2.Market Assessment and Forecast, By Application, 2017-2027 ($Million)
8.5.5.6.3.Market Assessment and Forecast, By Form, 2017-2027 ($Million)
8.5.5.6.4.Market Assessment and Forecast, By Health Benefits, 2017-2027 ($Million)
8.5.5.7.Rest of Asia-Pacific
8.5.5.7.1.Market Assessment and Forecast, By Type, 2017-2027 ($Million)
8.5.5.7.2.Market Assessment and Forecast, By Application, 2017-2027 ($Million)
8.5.5.7.3.Market Assessment and Forecast, By Form, 2017-2027 ($Million)
8.5.5.7.4.Market Assessment and Forecast, By Health Benefits, 2017-2027 ($Million)
8.6.Rest of the World
8.6.1. Market Assessment and Forecast, By Country, 2017-2027 ($Million)
8.6.2. Market Assessment and Forecast, By Type, 2017-2027 ($Million)
8.6.3. Market Assessment and Forecast, By Application, 2017-2027 ($Million)
8.6.4. Market Assessment and Forecast, By Form, 2017-2027 ($Million)
8.6.5. Market Assessment and Forecast, By Health Benefits, 2017-2027 ($Million)
8.6.5.1.Brazil
8.6.5.1.1.Market Assessment and Forecast, By Type, 2017-2027 ($Million)
8.6.5.1.2.Market Assessment and Forecast, By Application, 2017-2027 ($Million)
8.6.5.1.3.Market Assessment and Forecast, By Form, 2017-2027 ($Million)
8.6.5.1.4.Market Assessment and Forecast, By Health Benefits, 2017-2027 ($Million)
8.6.5.2.Turkey
8.6.5.2.1.Market Assessment and Forecast, By Type, 2017-2027 ($Million)
8.6.5.2.2.Market Assessment and Forecast, By Application, 2017-2027 ($Million)
8.6.5.2.3.Market Assessment and Forecast, By Form, 2017-2027 ($Million)
8.6.5.2.4.Market Assessment and Forecast, By Health Benefits, 2017-2027 ($Million)
8.6.5.3.Saudi Arabia
8.6.5.3.1.Market Assessment and Forecast, By Type, 2017-2027 ($Million)
8.6.5.3.2.Market Assessment and Forecast, By Application, 2017-2027 ($Million)
8.6.5.3.3.Market Assessment and Forecast, By Form, 2017-2027 ($Million)
8.6.5.3.4.Market Assessment and Forecast, By Health Benefits, 2017-2027 ($Million)
8.6.5.4.South Africa
8.6.5.4.1.Market Assessment and Forecast, By Type, 2017-2027 ($Million)
8.6.5.4.2.Market Assessment and Forecast, By Application, 2017-2027 ($Million)
8.6.5.4.3.Market Assessment and Forecast, By Form, 2017-2027 ($Million)
8.6.5.4.4.Market Assessment and Forecast, By Health Benefits, 2017-2027 ($Million)
8.6.5.5.United Arab Emirates
8.6.5.5.1.Market Assessment and Forecast, By Type, 2017-2027 ($Million)
8.6.5.5.2.Market Assessment and Forecast, By Application, 2017-2027 ($Million)
8.6.5.5.3.Market Assessment and Forecast, By Form, 2017-2027 ($Million)
8.6.5.5.4.Market Assessment and Forecast, By Health Benefits, 2017-2027 ($Million)
8.6.5.6.Others
8.6.5.6.1.Market Assessment and Forecast, By Type, 2017-2027 ($Million)
8.6.5.6.2.Market Assessment and Forecast, By Application, 2017-2027 ($Million)
8.6.5.6.3.Market Assessment and Forecast, By Form, 2017-2027 ($Million)
8.6.5.6.4.Market Assessment and Forecast, By Health Benefits, 2017-2027 ($Million)
9.Company Profiles
9.1.Cargill
9.1.1. Business Overview
9.1.2. Type Portfolio
9.1.3. Strategic Developments
9.2.DuPont
9.2.1. Business Overview
9.2.2. Type Portfolio
9.2.3. Key Financials
9.2.4. Strategic Developments
9.3.BASF SE (Germany),
9.3.1. Business Overview
9.3.2. Type Portfolio
9.3.3. Key Financials
9.3.4. Strategic Developments
9.4.Archer Daniels Midland Company
9.4.1. Business Overview
9.4.2. Type Portfolio
9.4.3. Strategic Developments
9.5.Associated British Foods plc
9.5.1. Business Overview
9.5.2. Type Portfolio
9.5.3. Key Financials
9.5.4. Strategic Developments
9.6.Koninklijke DSM N.V.
9.6.1. Business Overview
9.6.2. Type Portfolio
9.6.3. Key Financials
9.6.4. Strategic Developments
9.7.Ingredion Incorporated
9.7.1. Business Overview
9.7.2. Type Portfolio
9.7.3. Key Financials
9.7.4. Strategic Developments
9.8.Ajinomoto Co., Inc.
9.8.1. Business Overview
9.8.2. Type Portfolio
9.8.3. Key Financials
9.8.4. Strategic Developments
9.9.Arla Foods
9.9.1. Business Overview
9.9.2. Type Portfolio
9.9.3. Key Financials
9.9.4. Strategic Developments
9.10.Tate & Lyle PLC
9.10.1.9.10.1. Business Overview
9.10.2.Type Portfolio
9.10.3.Key Financials
9.10.4.Strategic Developments
9.11.Dean Foods
9.11.1.Business Overview
9.11.2.Type Portfolio
9.11.3.Key Financials
9.11.4.Strategic Developments
9.12.Nestle S.A.,
9.12.1.Business Overview
9.12.2.Type Portfolio
9.12.3.Key Financials
9.12.4.Strategic Developments
9.13.PepsiCo Inc
9.13.1.Business Overview
9.13.2.Type Portfolio
9.13.3.Key Financials
9.13.4.Strategic Developments
List of Tables
Table 1.Global Nutraceutical Ingredients Market, By Type, 2017-2025 ($Million)
Table 2.Nutraceutical Ingredients Market, By Region, 2017-2025 ($Million)
Table 3.Prebiotics Market, By Region, 2017-2025 ($Million)
Table 4.Probiotics Market, By Region, 2017-2025 ($Million)
Table 5.Proteins and Amino Acids Market, By Region, 2017-2025 ($Million)
Table 6.Vitamins Market, By Region, 2017-2025 ($Million)
Table 7.Minerals Market, By Region, 2017-2025 ($Million)
Table 8.Omega-3 Fatty Acids Market, By Region, 2017-2025 ($Million)
Table 9.Carotenoids Market, By Region, 2017-2025 ($Million)
Table 10.Fibers and Specialty Market, By Region, 2017-2025 ($Million)
Table 11.Phytochemical and Plant Extracts Market, By Region, 2017-2025 ($Million)
Table 12.Other types Market, By Region, 2017-2025 ($Million)
Table 13.Nutraceutical Ingredients Market, By Application, 2017-2025 ($Million)
Table 14.Nutraceutical Ingredients Market, By Region, 2017-2025 ($Million)
Table 15.Funtional Food Market, By Region, 2017-2025 ($Million)
Table 16.Functional Beverages Market, By Region, 2017-2025 ($Million)
Table 17.Dietary Supplements Market, By Region, 2017-2025 ($Million)
Table 18.Animal Nutrition Market, By Region, 2017-2025 ($Million)
Table 19.Personal Care Market, By Region, 2017-2025 ($Million)
Table 20.Nutraceutical Ingredients Market, By Form, 2017-2025 ($Million)
Table 21.Dry Form Market, By Region, 2017-2025 ($Million)
Table 22.Liquid Form Market, By Region, 2017-2025 ($Million)
Table 23.Nutraceutical Ingredients Market, By Health Benefits, 2017-2025 ($Million)
Table 24.Gut Health Market, By Region, 2017-2025 ($Million)
Table 25.Health Benefit Market, By Region, 2017-2025 ($Million)
Table 26.Bone Health Market, By Region, 2017-2025 ($Million)
Table 27.Immunity Market, By Region, 2017-2025 ($Million)
Table 28.Nutrition Market, By Region, 2017-2025 ($Million)
Table 29.Weight Management, By Region, 2017-2025 ($Million)
Table 30.Other Health Benefit Market, By Region, 2017-2025 ($Million)
Table 31.North America Nutraceutical Ingredients Market, By Country, 2017-2025 ($Million)
Table 32.North America Nutraceutical Ingredients Market, By Type, 2017-2025 ($Million)
Table 33.North America Nutraceutical Ingredients Market, By Application, 2017-2025 ($Million)
Table 34.North America Nutraceutical Ingredients Market, By Form, 2017-2025 ($Million)
Table 35.North America Nutraceutical Ingredients Market, By Health Benefits, 2017-2025 ($Million)
Table 36.U.S. Nutraceutical Ingredients Market, By Type, 2017-2025 ($Million)
Table 37.U.S. Nutraceutical Ingredients Market, By Application, 2017-2025 ($Million)
Table 38.U.S. Nutraceutical Ingredients Market, By Form, 2017-2025 ($Million)
Table 39.U.S. Nutraceutical Ingredients Market, By Health Benefits, 2017-2025 ($Million)
Table 40.Canada Nutraceutical Ingredients Market, By Type, 2017-2025 ($Million)
Table 41.Canada Nutraceutical Ingredients Market, By Application, 2017-2025 ($Million)
Table 42.Canada Nutraceutical Ingredients Market, By Form, 2017-2025 ($Million)
Table 43.Canada Nutraceutical Ingredients Market, By Health Benefits, 2017-2025 ($Million)
Table 44.Mexico Nutraceutical Ingredients Market, By Type, 2017-2025 ($Million)
Table 45.Mexico Nutraceutical Ingredients Market, By Application, 2017-2025 ($Million)
Table 46.Mexico Nutraceutical Ingredients Market, By Form, 2017-2025 ($Million)
Table 47.Mexico Nutraceutical Ingredients Market, By Health Benefits, 2017-2025 ($Million)
Table 48.Europe Nutraceutical Ingredients Market, By Country, 2017-2025 ($Million)
Table 49.Europe Nutraceutical Ingredients Market, By Type, 2017-2025 ($Million)
Table 50.Europe Nutraceutical Ingredients Market, By Application, 2017-2025 ($Million)
Table 51.Europe Nutraceutical Ingredients Market, By Form, 2017-2025 ($Million)
Table 52.Europe Nutraceutical Ingredients Market, By Health Benefits, 2017-2025 ($Million)
Table 53.Germany Nutraceutical Ingredients Market, By Type, 2017-2025 ($Million)
Table 54.Germany Nutraceutical Ingredients Market, By Application, 2017-2025 ($Million)
Table 55.Germany Nutraceutical Ingredients Market, By Form, 2017-2025 ($Million)
Table 56.Germany Nutraceutical Ingredients Market, By Health Benefits, 2017-2025 ($Million)
Table 57.France Nutraceutical Ingredients Market, By Type, 2017-2025 ($Million)
Table 58.France Nutraceutical Ingredients Market, By Application, 2017-2025 ($Million)
Table 59.France Nutraceutical Ingredients Market, By Form, 2017-2025 ($Million)
Table 60.France Nutraceutical Ingredients Market, By Health Benefits, 2017-2025 ($Million)
Table 61.UK Nutraceutical Ingredients Market, By Type, 2017-2025 ($Million)
Table 62.UK Nutraceutical Ingredients Market, By Application, 2017-2025 ($Million)
Table 63.UK Nutraceutical Ingredients Market, By Form, 2017-2025 ($Million)
Table 64.UK Nutraceutical Ingredients Market, By Health Benefits, 2017-2025 ($Million)
Table 65.Italy Nutraceutical Ingredients Market, By Type, 2017-2025 ($Million)
Table 66.Italy Nutraceutical Ingredients Market, By Application, 2017-2025 ($Million)
Table 67.Italy Nutraceutical Ingredients Market, By Form, 2017-2025 ($Million)
Table 68.Italy Nutraceutical Ingredients Market, By Health Benefits, 2017-2025 ($Million)
Table 69.Spain Nutraceutical Ingredients Market, By Type, 2017-2025 ($Million)
Table 70.Spain Nutraceutical Ingredients Market, By Application, 2017-2025 ($Million)
Table 71.Spain Nutraceutical Ingredients Market, By Form, 2017-2025 ($Million)
Table 72.Spain Nutraceutical Ingredients Market, By Health Benefits, 2017-2025 ($Million)
Table 73.Russia Nutraceutical Ingredients Market, By Type, 2017-2025 ($Million)
Table 74.Russia Nutraceutical Ingredients Market, By Application, 2017-2025 ($Million)
Table 75.Russia Nutraceutical Ingredients Market, By Form, 2017-2025 ($Million)
Table 76.Russia Nutraceutical Ingredients Market, By Health Benefits, 2017-2025 ($Million)
Table 77.Rest of Europe Nutraceutical Ingredients Market, By Type, 2017-2025 ($Million)
Table 78.Rest of Europe Nutraceutical Ingredients Market, By Application, 2017-2025 ($Million)
Table 79.Rest of Europe Nutraceutical Ingredients Market, By Form, 2017-2025 ($Million)
Table 80.Rest of Europe Nutraceutical Ingredients Market, By Health Benefits, 2017-2025 ($Million)
Table 81.Asia-Pacific Nutraceutical Ingredients Market, By Country, 2017-2025 ($Million)
Table 82.Asia-Pacific Nutraceutical Ingredients Market, By Type, 2017-2025 ($Million)
Table 83.Asia-Pacific Nutraceutical Ingredients Market, By Application, 2017-2025 ($Million)
Table 84.Asia-Pacific Nutraceutical Ingredients Market, By Form, 2017-2025 ($Million)
Table 85.Asia-Pacific Nutraceutical Ingredients Market, By Health Benefits, 2017-2025 ($Million)
Table 86.Japan Nutraceutical Ingredients Market, By Type, 2017-2025 ($Million)
Table 87.Japan Nutraceutical Ingredients Market, By Application, 2017-2025 ($Million)
Table 88.Japan Nutraceutical Ingredients Market, By Form, 2017-2025 ($Million)
Table 89.Japan Nutraceutical Ingredients Market, By Health Benefits, 2017-2025 ($Million)
Table 90.China Nutraceutical Ingredients Market, By Type, 2017-2025 ($Million)
Table 91.China Nutraceutical Ingredients Market, By Application, 2017-2025 ($Million)
Table 92.China Nutraceutical Ingredients Market, By Form, 2017-2025 ($Million)
Table 93.China Nutraceutical Ingredients Market, By Health Benefits, 2017-2025 ($Million)
Table 94.Australia Nutraceutical Ingredients Market, By Type, 2017-2025 ($Million)
Table 95.Australia Nutraceutical Ingredients Market, By Application, 2017-2025 ($Million)
Table 96.Australia Nutraceutical Ingredients Market, By Form, 2017-2025 ($Million)
Table 97.Australia Nutraceutical Ingredients Market, By Health Benefits, 2017-2025 ($Million)
Table 98.India Nutraceutical Ingredients Market, By Type, 2017-2025 ($Million)
Table 99.India Nutraceutical Ingredients Market, By Application, 2017-2025 ($Million)
Table 100.India Nutraceutical Ingredients Market, By Form, 2017-2025 ($Million)
Table 101.India Nutraceutical Ingredients Market, By Health Benefits, 2017-2025 ($Million)
Table 102.South Korea Nutraceutical Ingredients Market, By Type, 2017-2025 ($Million)
Table 103.South Korea Nutraceutical Ingredients Market, By Application, 2017-2025 ($Million)
Table 104.South Korea Nutraceutical Ingredients Market, By Form, 2017-2025 ($Million)
Table 105.South Korea Nutraceutical Ingredients Market, By Health Benefits, 2017-2025 ($Million)
Table 106.Rest of Asia-Pacific Nutraceutical Ingredients Market, By Type, 2017-2025 ($Million)
Table 107.Rest of Asia-Pacific Nutraceutical Ingredients Market, By Application, 2017-2025 ($Million)
Table 108.Rest of Asia-Pacific Nutraceutical Ingredients Market, By Form, 2017-2025 ($Million)
Table 109.Rest of Asia-Pacific Nutraceutical Ingredients Market, By Health Benefits, 2017-2025 ($Million)
Table 110.Rest of the World Nutraceutical Ingredients Market, By Country, 2017-2025 ($Million)
Table 111.Rest of the World Nutraceutical Ingredients Market, By Type, 2017-2025 ($Million)
Table 112.Rest of the World Nutraceutical Ingredients Market, By Application, 2017-2025 ($Million)
Table 113.Rest of the World Nutraceutical Ingredients Market, By Form, 2017-2025 ($Million)
Table 114.Rest of the World Nutraceutical Ingredients Market, By Health Benefits, 2017-2025 ($Million)
Table 115.Brazil Nutraceutical Ingredients Market, By Type, 2017-2025 ($Million)
Table 116.Brazil Nutraceutical Ingredients Market, By Application, 2017-2025 ($Million)
Table 117.Brazil Nutraceutical Ingredients Market, By Form, 2017-2025 ($Million)
Table 118.Brazil Nutraceutical Ingredients Market, By Health Benefits, 2017-2025 ($Million)
Table 119.Turkey Nutraceutical Ingredients Market, By Type, 2017-2025 ($Million)
Table 120.Turkey Nutraceutical Ingredients Market, By Application, 2017-2025 ($Million)
Table 121.Turkey Nutraceutical Ingredients Market, By Form, 2017-2025 ($Million)
Table 122.Turkey Nutraceutical Ingredients Market, By Health Benefits, 2017-2025 ($Million)
Table 123.Saudi Arabia Nutraceutical Ingredients Market, By Type, 2017-2025 ($Million)
Table 124.Saudi Arabia Nutraceutical Ingredients Market, By Application, 2017-2025 ($Million)
Table 125.Saudi Arabia Nutraceutical Ingredients Market, By Form, 2017-2025 ($Million)
Table 126.Saudi Arabia Nutraceutical Ingredients Market, By Health Benefits, 2017-2025 ($Million)
Table 127.South Africa Nutraceutical Ingredients Market, By Type, 2017-2025 ($Million)
Table 128.South Africa Nutraceutical Ingredients Market, By Application, 2017-2025 ($Million)
Table 129.South Africa Nutraceutical Ingredients Market, By Form, 2017-2025 ($Million)
Table 130.South Africa Nutraceutical Ingredients Market, By Health Benefits, 2017-2025 ($Million)
Table 131.United Arab Emirates Nutraceutical Ingredients Market, By Type, 2017-2025 ($Million)
Table 132.United Arab Emirates Nutraceutical Ingredients Market, By Application, 2017-2025 ($Million)
Table 133.United Arab Emirates Nutraceutical Ingredients Market, By Form, 2017-2025 ($Million)
Table 134.United Arab Emirates Nutraceutical Ingredients Market, By Health Benefits, 2017-2025 ($Million)
Table 135.Others Nutraceutical Ingredients Market, By Type, 2017-2025 ($Million)
Table 136.Others Nutraceutical Ingredients Market, By Application, 2017-2025 ($Million)
Table 137.Others Nutraceutical Ingredients Market, By Form, 2017-2025 ($Million)
Table 138.Others Nutraceutical Ingredients Market, By Health Benefits, 2017-2025 ($Million)
Table 139.Cargill: Key Strategic Developments, 2017-2017
Table 140.DuPont: Key Strategic Developments, 2017-2017
Table 141.BASF SE: Key Strategic Developments, 2017-2017
Table 142.Archer Daniels Midland Company: Key Strategic Developments, 2017-2017
Table 143.Associated British Foods plc: Key Strategic Developments, 2017-2017
Table 144.Koninklijke DSM N.V.: Key Strategic Developments, 2017-2017
Table 145.Ingredion Incorporated: Key Strategic Developments, 2017-2017
Table 146.Ajinomoto Co., Inc.: Key Strategic Developments, 2017-2017
Table 147.Arla Foods: Key Strategic Developments, 2017-2017
Table 148.Tate & Lyle PLC: Key Strategic Developments, 2017-2017
Table 149.Dean Foods: Key Strategic Developments, 2017-2017
Table 150.Nestle S.A: Key Strategic Developments, 2017-2017
Table 151.Pepsico Inc: Key Strategic Developments, 2017-2017
List of Figures
Figure 1.Nutraceutical Ingredients Market Share, By Type, 2017 & 2025 ($Million)
Figure 2.Nutraceutical Ingredients Market Share, By Application, 2017 & 2025 ($Million)
Figure 3.Nutraceutical Ingredients Market Share, By Form, 2017 & 2025 ($Million)
Figure 4.Nutraceutical Ingredients Market Share, By Health Benefits, 2017 & 2025 ($Million)
Figure 5.Nutraceutical Ingredients Market, By Region, 2017, ($Million)
Figure 6.DuPont: Net Revenues, 2017-2017 ($Million)
Figure 7.DuPont: Net Revenue Share, By Segment, 2017
Figure 8.DuPont: Net Revenue Share, By Geography, 2017
Figure 9.BASF SE: Net Revenue, 2017-2017 ($Million)
Figure 10.BASF SE: Net Revenue Share, By Segment, 2017
Figure 11.BASF SE: Net Revenue Share, By Geography, 2017
Figure 12.Associated British Foods plc: Net Revenues, 2017-2017 ($Million)
Figure 13.Associated British Foods plc: Net Revenue Share, By Segment, 2017
Figure 14.Associated British Foods plc: Net Revenue Share, By Geography, 2017
Figure 15.Koninklijke DSM N.V.: Net Revenues, 2017-2017 ($Million)
Figure 16.Koninklijke DSM N.V.: Net Revenue Share, By Segment, 2017
Figure 17.Koninklijke DSM N.V.: Net Revenue Share, By Geography, 2017
Figure 18.Ingredion Incorporated Net Revenues, 2017-2017 ($Million)
Figure 19.Ingredion Incorporated: Net Revenue Share, By Segment, 2017
Figure 20.Ingredion Incorporated: Net Revenue Share, By Geography, 2017
Figure 21.Ajinomoto Co., Inc.: Net Revenues, 2017-2017 ($Million)
Figure 22.Ajinomoto Co., Inc.: Net Revenue Share, By Segment, 2017
Figure 23.Ajinomoto Co., Inc.: Net Revenue Share, By Geography, 2017
Figure 24.Arla Foods: Net Revenues, 2017-2017 ($Million)
Figure 25.Arla Foods: Net Revenue Share, By Segment, 2017
Figure 26.Arla Foods: Net Revenue Share, By Geography, 2017
Figure 27.Tate & Lyle PLC: Net Revenues, 2017-2017 ($Million)
Figure 28.Tate & Lyle PLC: Net Revenue Share, By Segment, 2017
Figure 29.Tate & Lyle PLC: Net Revenue Share, By Geography, 2017
Figure 30.Dean Foods: Net Revenues, 2017-2017 ($Million)
Figure 31.Dean Foods: Net Revenue Share, By Segment, 2017
Figure 32.Dean Foods: Net Revenue Share, By Geography, 2017
Figure 33.Nestle S.A.: Net Revenues, 2017-2017 ($Million)
Figure 34.Nestle S.A.: Net Revenue Share, By Segment, 2017
Figure 35.Nestle S.A.: Net Revenue Share, By Geography, 2017
Figure 36.Pepsico Inc: Net Revenues, 2017-2017 ($Million)
Figure 37.Pepsico Inc: Net Revenue Share, By Segment, 2017
Figure 38.Pepsico Inc: Net Revenue Share, By Geography, 2017
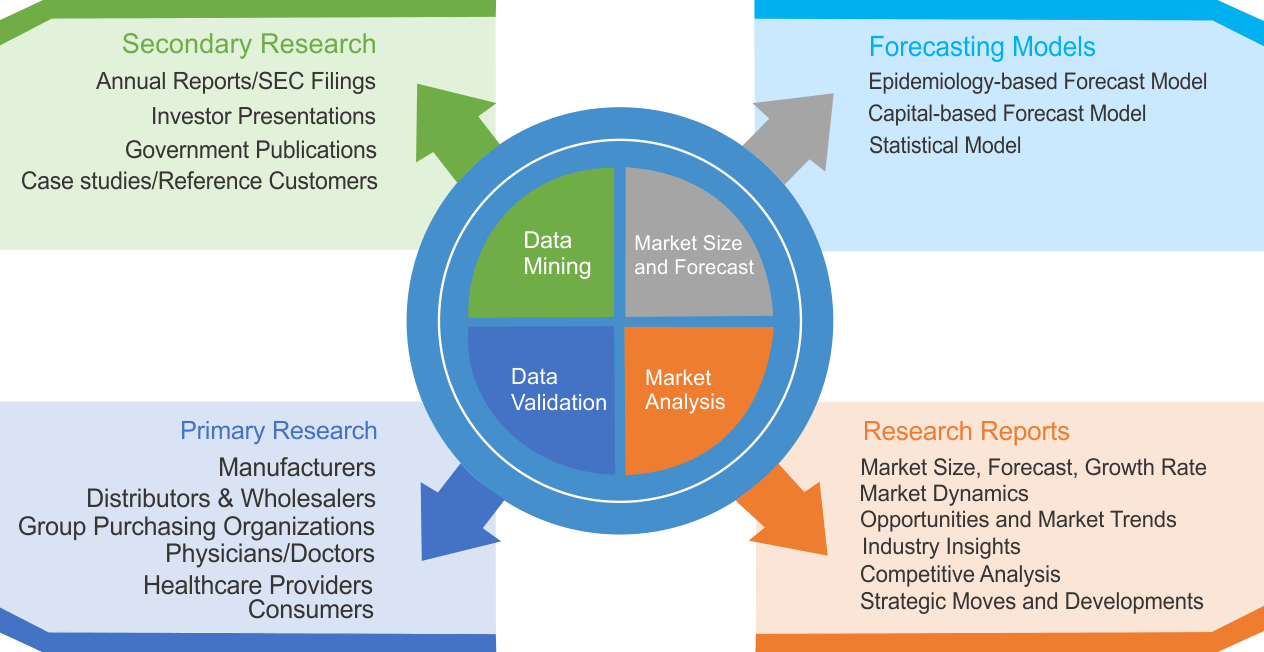
Research Methodology
We use both primary as well as secondary research for our market surveys, estimates and for developing forecast. Our research process commence by analyzing the problem which enable us to design the scope for our research study. Our research process is uniquely designed with enough flexibility to adjust according to changing nature of products and markets, while retaining core element to ensure reliability and accuracy in research findings. We understand both macro and micro-economic factors to evaluate and forecast different market segments.
Data Mining
Data is extensively collected through various secondary sources such as annual reports, investor presentations, SEC filings, and other corporate publications. We also refer trade magazines, technical journals, paid databases such as Factiva and Bloomberg, industry trade journals, scientific journals, and social media data to understand market dynamics and industry trends. Further, we also conduct primary research to understand market drivers, restraints, opportunities, challenges, and competitive scenario to build our analysis.
Data Collection Matrix
|
Data Collection Matrix |
Supply Side |
Demand Side |
|
Primary Data Sources |
|
|
|
Secondary Data Sources |
|
|
Market Modeling and Forecasting
We use epidemiology and capital equipment-based models to forecast market size of different segments at country and regional level.
- Epidemiology-based Forecasting Model: This method uses epidemiology data gathered through various publications and from physicians to estimate population of patients, flow of treatment of individual disease and therapies. The data collected through this method includes statics on incidence of disease, population suffering from disease, and treatment population. This method is used to understand:
- Number of patients for particular device or medical procedure and
- Repeated use of particular device depending on health and condition of patient
- Capital-based Forecasting Model: This method of forecasting is based on number of replacements, installed-based and new sales of capital equipment used in various healthcare and diagnostic centers. These three parameters are calculated and forecast is developed. Installation base is calculated as average number of units per facility; while sales for particular year is calculated from number of new and replace units. Secondary data is collected through various supply chain intermediaries and opinion leaders to arrive at installation and sales rate. These techniques help our analysts in validating market and developed market estimates and forecast.
We do forecast on basis of several parameters such as market drivers, market opportunities, industry trends government regulations, raw materials supply and trade dynamics to ensure relevance of forecast with market scenario. With increasing need to granulized information, we used bottom-up methodology for forecasting where we evaluate each regional segment differently and combined all forecast to develop final market forecast.
Data Validation
We believe primary research is a very important tool in analyzing and forecasting different markets. In order to make sure accuracy of our findings, our team conducts primary interviews at every stage of research to gain deep insights into current business environment and future trends and key developments in market. This includes use of various methods such as telephonic interviews, focus groups, face to face interviews and questionnaires to validate our research from all aspects. We validate our data through primary research from key industry leaders such as CEO, product managers, marketing managers, suppliers, distributors, and consumers are frequently interviewed. These interviews provide valuable insights which help us to have better market understanding besides validating our estimates and forecast.
Data Triangulation
Industry Analysis
|
Qualitative Data |
Quantitative Data (2017-2025) |
|
|