Medical Robotic Systems Market by Product and Application - Global Industry Analysis and Forecast to 2022
Published On : November 2017 Pages : 100 Category: Medical Devices Report Code : HC11347
Industry Trend Analysis
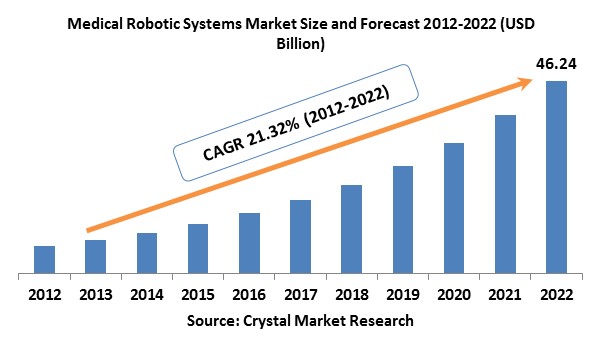
In 2017, the global medical robotic systems market was evaluated around USD 6.69 billion and is expected to reach approximately USD 46.24 billion by 2022 while registering itself at a compound annual growth rate (CAGR) of 21.32% over the forecast period. Major factors fueling the medical robots market growth are; rapidly emerging demand for efficient, precise and least invasive surgical procedures, expansion in the number of these surgical procedures owing to rising disease occurrence levels, is also expected to boost the market expansion. Development of medical infrastructure and the advent of sophisticated healthcare equipment are anticipated to make easy further adoption of robotic systems in urbanized nations. The global market is experiencing a paradigm transformation over the period owing to technological innovations in the fields of High definition microscopic cameras, 3D-Imaging, data recorders data analytic, remote navigation, robotically controlled catheters, and motion sensors. The extent of technology advancement is to build up novel applications for present platforms and also generate troublesome technologies that boost the demand. The market is experiencing an increasing trend of organizations joining forces on technology platforms with intermediary vendors to formulate novel applications.
Product Outlook and Trend Analysis
In 2017, surgical robots reported for the leading market share at around 60% due to, the growing demand for least invasive surgical procedure and rising rate of adoption in hospitals. Also, technological innovations concerning to counteract the drawbacks of laparoscopic surgical procedures that involve Da Vinci Surgery with better accuracy and sleight rendering favorable results are anticipated to positively strengthen growth during the forecast years. Also, rising number of medical applications are anticipated to boost the potential growth of this market.
Application Outlook and Trend Analysis
In 2017, laparoscopy was the leading application owing to the growing geriatric population, rising demand for modestly invasive therapeutic and diagnostic procedures, and growing younger population with unhealthy lifestyles for example, fatty foods and alcohol consumption and absence of physical exercises is also prone to assign to the expansion of target illnesses over the next few years. Moreover, expansion of new systems with superior maneuverability and magnification, improved micro motions, and easier manipulation of the tools in patient’s body ensued as the advancement of surgical procedures. On account of such abovementioned factors, laparoscopy is anticipated to experience profitable growth during the forecast years. On the other hand, growing occurrence of neurological diseases such as strokes, brain tumors, epilepsy & Parkinson’s illnesses, and increasing awareness levels concerning to robot-assisted surgical procedures are the major factors assigning to the beneficial expansion of the neurological application section during the forecast years.
Regional Outlook and Trend Analysis
In 2017, the North American regional market ruled the global market at around 40% due to the existence of advanced medical infrastructure and rising demand for robot-assisted surgical operations along with elevated healthcare spending levels in this region. Rising adoption of robot-assisted surgical operations in a series of surgical applications is balanced to achieve massive importance in surgeons’ armamentarium. The Asia Pacific regional medical robotic systems market is anticipated to expand at the top rate over the forecast years owing to the presence of unexplored market opportunities, continuously improving medical infrastructure, and elevated awareness levels among patients are a few of the major factors assigning to market growth.
Competitive Outlook and Trend Analysis
Market players that rule the global market are; Renishaw Plc., Varian, MAKO Surgical Corp., Health robotics S.R.L, Accuracy and Intuitive Surgical, Inc. The global industry is vastly split with organizations concentrating widely on R&D approaches in order to exploit the accessible opportunities through developing technologically advanced and cost-effective products.
The global medical robotic systems market is segmented as follows –
By Product
- Surgical Robots
- Orthopedic Surgical Robots
-
-
- Robodoc surgical system
- iBlock surgical system
- Stanmore Sculptor surgical system
- Navio PFS surgical system
- MAKO RIO surgical system
-
-
- Neurosurgical Robotic Systems
- Pathfinder surgical system
- NeuroMate surgical system
- Renaissance surgical system
- Laparoscopy Robotic Systems
- FreeHand endoscope holder system
- Da Vinci robotic surgery system
- Telelap ALF-X surgical system
- Steerable Robotic Catheters
- Rehabilitation Robots
-
- Assistive Robots
- Prosthetics
- Orthotics
- Therapeutic Robots
- Exoskeleton Robotic Systems
- Noninvasive Radiosurgery Robots
- TrueBeam STx radiosurgery system
- CyberKnife robotic radiosurgery system
- Gamma Knife Perfexion radiosurgery system
- Hospital and Pharmacy Robots
- Telemedicine Robots
- I.V. Robots
- Pharmacy Robots
- Cart transportation robots
- Emergency response robotic systems
- LS-1 robotic system
- AutoPulse Plus robotic system
-
By Region
- North America
- U.S
- Canada
- Mexico
- Europe
- Germany
- France
- UK
- Italy
- Spain
- Rest of Europe
- Asia-Pacific
- Japan
- China
- Australia
- India
- South Korea
- Rest of Asia Pacific
- Rest of the World
- Brazil
- South Africa
- Saudi Arabia
- United Arab Emirates
- Others
Some of the key questions answered by the report are:
· What was the market size in 2017 and forecast from 2017 to 2022?
· What will be the industry market growth from 2017 to 2022?
· What are the major drivers, restraints, opportunities, challenges, and industry trends and their impact on the market forecast?
· What are the major segments leading the market growth and why?
· What are the major segments leading the market growth and why?
· Which are the leading players in the market and what are the major strategies adopted by them to sustain the market competition
Market Classification
- Medical Robotic Systems Market, By Product, Estimates and Forecast, 2012-2022 ($Million)
- Surgical Robots
- Orthopedic Surgical Robots
- iBlock surgical system
- Robodoc surgical system
- Navio PFS surgical system
- MAKO RIO surgical system
- Neurosurgical Robotic Systems
- Pathfinder surgical system
- NeuroMate surgical system
- Renaissance surgical system
- Laparoscopy Robotic Systems
- FreeHand endoscope holder system
- Da Vinci robotic surgery system
- Telelap ALF-X surgical system
- Steerable Robotic Catheters
- Rehabilitation Robots
- Assistive Robots
- Prosthetics
- Orthotics
- Therapeutic Robots
- Exoskeleton Robotic Systems
- Noninvasive Radiosurgery Robots
- TrueBeam STx radiosurgery system
- CyberKnife robotic radiosurgery system
- Gamma Knife Perfexion radiosurgery system
- Hospital and Pharmacy Robots
- Telemedicine Robots
- I.V. Robots
- Pharmacy Robots
- Cart transportation robots
- Emergency response robotic systems
- Rehabilitation Robots
- LS-1 robotic system
- Auto Pulse Plus robotic system
- Medical Robotic Systems Market, By Application, Estimates and Forecast, 2012-2022 ($Million)
- Neurology
- Orthopedics robotic systems
- Laparoscopy
- Special Education
- Medical Robotic Systems Market, By Region, Estimates and Forecast, 2012-2022 ($Million)
- North America
- North America Medical Robotic Systems Market, By Country
- North America Medical Robotic Systems Market, By Product
- North America Medical Robotic Systems Market, By Application
- U.S. Medical Robotic Systems Market, By Product
- U.S. Medical Robotic Systems Market, By Application
- Canada Medical Robotic Systems Market, By Product
- Canada Medical Robotic Systems Market, By Application
- Mexico Medical Robotic Systems Market, By Product
- Mexico Medical Robotic Systems Market, By Application
-
- Europe
- Europe Medical Robotic Systems Market, By Country
- Europe Medical Robotic Systems Market, By Product
- Europe Medical Robotic Systems Market, By Application
- Germany Medical Robotic Systems Market, By Product
- Germany Medical Robotic Systems Market, By Application
- France Medical Robotic Systems Market, By Product
- France Medical Robotic Systems Market, By Application
- UK Medical Robotic Systems Market, By Product
- UK Medical Robotic Systems Market, By Application
- Italy Medical Robotic Systems Market, By Product
- Italy Medical Robotic Systems Market, By Application
- Spain Medical Robotic Systems Market, By Product
- Spain Medical Robotic Systems Market, By Application
- Rest of Europe Medical Robotic Systems Market, By Product
- Rest of Europe Medical Robotic Systems Market, By Application
-
- Asia-Pacific
- Asia-Pacific Medical Robotic Systems Market, By Country
- Asia-Pacific Medical Robotic Systems Market, By Product
- Asia-Pacific Medical Robotic Systems Market, By Application
- Japan Medical Robotic Systems Market, By Product
- Japan Medical Robotic Systems Market, By Application
- Australia Medical Robotic Systems Market, By Product
- Australia Medical Robotic Systems Market, By Application
- India Medical Robotic Systems Market, By Product
- India Medical Robotic Systems Market, By Application
- South Korea Medical Robotic Systems Market, By Product
- South Korea Medical Robotic Systems Market, By Application
- Rest of Asia-Pacific Medical Robotic Systems Market, By Product
- Rest of Asia-Pacific Medical Robotic Systems Market, By Application
- Asia-Pacific
-
- Rest of the World
- Rest of the World Medical Robotic Systems Market, By Country
- Rest of the World Medical Robotic Systems Market, By Product
- Rest of the World Medical Robotic Systems Market, By Application
- Brazil Medical Robotic Systems Market, By Product
- Brazil Medical Robotic Systems Market, By Application
- South Africa Medical Robotic Systems Market, By Product
- South Africa Medical Robotic Systems Market, By Application
- Saudi Arabia Medical Robotic Systems Market, By Product
- Saudi Arabia Medical Robotic Systems Market, By Application
- Turkey Medical Robotic Systems Market, By Product
- Turkey Medical Robotic Systems Market, By Application
- United Arab Emirates Medical Robotic Systems Market, By Product
- United Arab Emirates Medical Robotic Systems Market, By Application
- Others Medical Robotic Systems Market, By Product
- Others Medical Robotic Systems Market, By Application
- Rest of the World
Table of Contents
1. Introduction
1.1. Report Description
1.2. Research Methodology
2. Executive Summary
2.1. Key Highlights
3. Market Overview
3.1. Introduction
3.1.1. Market Definition
3.1.2. Market Segmentation
3.2. Market Dynamics
3.2.1. Drivers
3.2.1.1. Rising Prevalence of Diseases Like Cancer Neurological Disorders and Cardiovascular Diseases
3.2.1.2. Increasing MIS Surgeries
3.2.1.3. Increasing Geriatric Population Across the Globe
3.2.2. Restraints
3.2.2.1. Presence of Stringent Regulatory Framework
3.2.2.2. Lack of Reimbursement Policy
3.2.3. Opportunities
3.2.3.1. Emerging Markets to Offer Lucrative Growth Opportunities
4. Medical Robotic Systems Market, By Product
4.1. Introduction
4.2. Medical Robotic Systems Market Assessment and Forecast, By Product, 2012-2022
4.3. Surgical Robots
4.3.1. Market Assessment and Forecast, By Type, 2012-2022 ($Million)
4.3.2. Market Assessment and Forecast, By Region, 2012-2022 ($Million)
4.3.3. Orthopedic Surgical Robots
4.3.3.1. Market Assessment and Forecast, By Type, 2012-2022 ($Million)
4.3.3.2. Market Assessment and Forecast, By Region, 2012-2022 ($Million)
4.3.3.3. iBlock Surgical System
4.3.3.3.1. Market Assessment and Forecast, By Region, 2012-2022 ($Million)
4.3.3.4. Robodoc Surgical System
4.3.3.4.1. Market Assessment and Forecast, By Region, 2012-2022 ($Million)
4.3.3.5. Navio PFS Surgical System
4.3.3.5.1. Market Assessment and Forecast, By Region, 2012-2022 ($Million)
4.3.3.6. MAKO RIO Surgical System
4.3.3.6.1. Market Assessment and Forecast, By Region, 2012-2022 ($Million)
4.3.3.7. Stanmore Sculptor Surgical System
4.3.3.7.1. Market Assessment and Forecast, By Region, 2012-2022 ($Million)
4.3.4. Neurosurgical Robotic Systems
4.3.4.1. Market Assessment and Forecast, By Type, 2012-2022 ($Million)
4.3.4.2. Market Assessment and Forecast, By Region, 2012-2022 ($Million)
4.3.4.3. Pathfinder Surgical System
4.3.4.3.1. Market Assessment and Forecast, By Region, 2012-2022 ($Million)
4.3.4.4. NeuroMate Surgical System
4.3.4.4.1. Market Assessment and Forecast, By Region, 2012-2022 ($Million)
4.3.4.5. Renaissance Surgical System
4.3.4.5.1. Market Assessment and Forecast, By Region, 2012-2022 ($Million)
4.3.5. Laparoscopy Robotic Systems
4.3.5.1. Market Assessment and Forecast, By Type, 2012-2022 ($Million)
4.3.5.2. Market Assessment and Forecast, By Region, 2012-2022 ($Million)
4.3.5.3. FreeHand endoscope holder system
4.3.5.3.1. Market Assessment and Forecast, By Region, 2012-2022 ($Million)
4.3.5.4. Da Vinci Robotic Surgery System
4.3.5.4.1. Market Assessment and Forecast, By Region, 2012-2022 ($Million)
4.3.5.5. Telelap ALF-X Surgical System
4.3.5.5.1. Market Assessment and Forecast, By Region, 2012-2022 ($Million)
4.3.6. Steerable Robotic Catheters
4.3.6.1. Market Assessment and Forecast, By Region, 2012-2022 ($Million)
4.4. Rehabilitation Robots
4.4.1. Market Assessment and Forecast, By Type, 2012-2022 ($Million)
4.4.2. Market Assessment and Forecast, By Region, 2012-2022 ($Million)
4.4.3. Assistive Robots
4.4.3.1. Market Assessment and Forecast, By Region, 2012-2022 ($Million)
4.4.4. Prosthetics
4.4.4.1. Market Assessment and Forecast, By Region, 2012-2022 ($Million)
4.4.5. Orthotics
4.4.5.1. Market Assessment and Forecast, By Region, 2012-2022 ($Million)
4.4.6. Therapeutic Robots
4.4.6.1. Market Assessment and Forecast, By Region, 2012-2022 ($Million)
4.4.7. Exoskeleton Robotic Systems
4.4.7.1. Market Assessment and Forecast, By Region, 2012-2022 ($Million)
4.5. Noninvasive Radiosurgery Robots
4.5.1. Market Assessment and Forecast, By Type, 2012-2022 ($Million)
4.5.2. Market Assessment and Forecast, By Region, 2012-2022 ($Million)
4.5.3. TrueBeam STx Radiosurgery System
4.5.3.1. Market Assessment and Forecast, By Region, 2012-2022 ($Million)
4.5.4. CyberKnife Robotic Radiosurgery System
4.5.4.1. Market Assessment and Forecast, By Region, 2012-2022 ($Million)
4.5.5. Gamma Knife Perfexion Radiosurgery System
4.5.5.1. Market Assessment and Forecast, By Region, 2012-2022 ($Million)
4.6. Hospital and Pharmacy Robots
4.6.1. Market Assessment and Forecast, By Type, 2012-2022 ($Million)
4.6.2. Market Assessment and Forecast, By Region, 2012-2022 ($Million)
4.6.3. Telemedicine Robots
4.6.3.1. Market Assessment and Forecast, By Region, 2012-2022 ($Million)
4.6.4. I.V. Robots
4.6.4.1. Market Assessment and Forecast, By Region, 2012-2022 ($Million)
4.6.5. Pharmacy Robots
4.6.5.1. Market Assessment and Forecast, By Region, 2012-2022 ($Million)
4.6.6. Cart transportation Robots
4.6.6.1. Market Assessment and Forecast, By Region, 2012-2022 ($Million)
4.7. Emergency Response Robotic Systems
4.7.1. Market Assessment and Forecast, By Type, 2012-2022 ($Million)
4.7.2. Market Assessment and Forecast, By Region, 2012-2022 ($Million)
4.7.3. LS-1 Robotic System
4.7.3.1. Market Assessment and Forecast, By Region, 2012-2022 ($Million)
4.7.4. Auto Pulse Plus Robotic System
4.7.4.1. Market Assessment and Forecast, By Region, 2012-2022 ($Million)
5. Medical Robotic Systems Market, By Application
5.1. Introduction
5.2. The Medical Robotic Systems Market Assessment and Forecast, By Application, 2012-2022
5.3. Neurology
5.3.1. Market Assessment and Forecast, By Region, 2012-2022 ($Million)
5.4. Orthopedics Robotic Systems
5.4.1. Market Assessment and Forecast, By Region, 2012-2022 ($Million)
5.5. Laparoscopy
5.5.1. Market Assessment and Forecast, By Region, 2012-2022 ($Million)
5.6. Special Education
5.6.1. Market Assessment and Forecast, By Region, 2012-2022 ($Million)
6. Medical Robotic Systems Market, By Region
6.1. Introduction
6.2. Medical Robotic Systems Market Assessment and Forecast, By Product, 2012-2022 ($Million)
6.3. Medical Robotic Systems Market Assessment and Forecast, By Application , 2012-2022 ($Million)
6.4. North America
6.4.1. Market Assessment and Forecast, By Country, 2012-2022 ($Million)
6.4.2. Market Assessment and Forecast, By Product, 2012-2022 ($Million)
6.4.3. Market Assessment and Forecast, By Application, 2012-2022 ($Million)
6.4.4. U.S.
6.4.4.1. Market Assessment and Forecast, By Product, 2012-2022 ($Million)
6.4.4.2. Market Assessment and Forecast, By Application, 2012-2022 ($Million)
6.4.5. Canada
6.4.5.1. Market Assessment and Forecast, By Product, 2012-2022 ($Million)
6.4.5.2. Market Assessment and Forecast, By Application, 2012-2022 ($Million)
6.4.6. Mexico
6.4.6.1. Market Assessment and Forecast, By Product, 2012-2022 ($Million)
6.4.6.2. Market Assessment and Forecast, By Application, 2012-2022 ($Million)
6.5. Europe
6.5.1. Market Assessment and Forecast, By Country, 2012-2022 ($Million)
6.5.2. Market Assessment and Forecast, By Product, 2012-2022 ($Million)
6.5.3. Market Assessment and Forecast, By Application, 2012-2022 ($Million)
6.5.4. Germany
6.5.4.1. Market Assessment and Forecast, By Product, 2012-2022 ($Million)
6.5.4.2. Market Assessment and Forecast, By Application, 2012-2022 ($Million)
6.5.5. France
6.5.5.1. Market Assessment and Forecast, By Product, 2012-2022 ($Million)
6.5.5.2. Market Assessment and Forecast, By Application, 2012-2022 ($Million)
6.5.6. UK
6.5.6.1. Market Assessment and Forecast, By Product, 2012-2022 ($Million)
6.5.6.2. Market Assessment and Forecast, By Application, 2012-2022 ($Million)
6.5.7. Italy
6.5.7.1. Market Assessment and Forecast, By Product, 2012-2022 ($Million)
6.5.7.2. Market Assessment and Forecast, By Application, 2012-2022 ($Million)
6.5.8. Spain
6.5.8.1. Market Assessment and Forecast, By Product, 2012-2022 ($Million)
6.5.8.2. Market Assessment and Forecast, By Application, 2012-2022 ($Million)
6.5.9. Rest of Europe
6.5.9.1. Market Assessment and Forecast, By Product, 2012-2022 ($Million)
6.5.9.2. Market Assessment and Forecast, By Application, 2012-2022 ($Million)
6.6. Asia-Pacific
6.6.1. Market Assessment and Forecast, By Country, 2012-2022 ($Million)
6.6.2. Market Assessment and Forecast, By Product, 2012-2022 ($Million)
6.6.3. Market Assessment and Forecast, By Application, 2012-2022 ($Million)
6.6.4. Japan
6.6.4.1. Market Assessment and Forecast, By Product, 2012-2022 ($Million)
6.6.4.2. Market Assessment and Forecast, By Application, 2012-2022 ($Million)
6.6.5. China
6.6.5.1. Market Assessment and Forecast, By Product, 2012-2022 ($Million)
6.6.5.2. Market Assessment and Forecast, By Application, 2012-2022 ($Million)
6.6.6. Australia
6.6.6.1. Market Assessment and Forecast, By Product, 2012-2022 ($Million)
6.6.6.2. Market Assessment and Forecast, By Application, 2012-2022 ($Million)
6.6.7. India
6.6.7.1. Market Assessment and Forecast, By Product, 2012-2022 ($Million)
6.6.7.2. Market Assessment and Forecast, By Application, 2012-2022 ($Million)
6.6.8. South Korea
6.6.8.1. Market Assessment and Forecast, By Product, 2012-2022 ($Million)
6.6.8.2. Market Assessment and Forecast, By Application, 2012-2022 ($Million)
6.6.9. Rest of Asia-Pacific
6.6.9.1. Market Assessment and Forecast, By Product, 2012-2022 ($Million)
6.6.9.2. Market Assessment and Forecast, By Application, 2012-2022 ($Million)
6.7. Rest of the World
6.7.1. Market Assessment and Forecast, By Country, 2012-2022 ($Million)
6.7.2. Market Assessment and Forecast, By Product, 2012-2022 ($Million)
6.7.3. Market Assessment and Forecast, By Application, 2012-2022 ($Million)
6.7.4. Brazil
6.7.4.1. Market Assessment and Forecast, By Product, 2012-2022 ($Million)
6.7.4.2. Market Assessment and Forecast, By Application, 2012-2022 ($Million)
6.7.5. Turkey
6.7.5.1. Market Assessment and Forecast, By Product, 2012-2022 ($Million)
6.7.5.2. Market Assessment and Forecast, By Application, 2012-2022 ($Million)
6.7.6. Saudi Arabia
6.7.6.1. Market Assessment and Forecast, By Product, 2012-2022 ($Million)
6.7.6.2. Market Assessment and Forecast, By Application, 2012-2022 ($Million)
6.7.7. South Africa
6.7.7.1. Market Assessment and Forecast, By Product, 2012-2022 ($Million)
6.7.7.2. Market Assessment and Forecast, By Application, 2012-2022 ($Million)
6.7.8. United Arab Emirates
6.7.8.1. Market Assessment and Forecast, By Product, 2012-2022 ($Million)
6.7.8.2. Market Assessment and Forecast, By Application, 2012-2022 ($Million)
6.7.9. Others
6.7.9.1. Market Assessment and Forecast, By Product, 2012-2022 ($Million)
6.7.9.2. Market Assessment and Forecast, By Application, 2012-2022 ($Million)
List of Tables
List of Tables
Table 1.Global Medical Robotic Systems Market, By Product, 2012-2022 ($Million)
Table 2.Surgical Robots Market, By Type, 2012-2022 ($Million)
Table 3.Surgical Robots Market, By Region, 2012-2022 ($Million)
Table 4.Orthopedic Surgical Robots Market, By Type, 2012-2022 ($Million)
Table 5.Orthopedic Surgical Robots Market, By Region, 2012-2022 ($Million)
Table 6.iBlock Surgical System Market, By Region, 2012-2022 ($Million)
Table 7.Robodoc Surgical System Market, By Region, 2012-2022 ($Million)
Table 8.Navio PFS Surgical System Market, By Region, 2012-2022 ($Million)
Table 9.MAKO RIO Surgical System Market, By Region, 2012-2022 ($Million)
Table 10.Stanmore Sculptor Surgical system Market, By Region, 2012-2022 ($Million)
Table 11.Neurosurgical Robotic Systems Market, By Type, 2012-2022 ($Million)
Table 12.Neurosurgical Robotic Systems Market, By Region, 2012-2022 ($Million)
Table 13.Pathfinder Surgical System Market, By Region, 2012-2022 ($Million)
Table 14.NeuroMate Surgical System Market, By Region, 2012-2022 ($Million)
Table 15.Renaissance Surgical System Market, By Region, 2012-2022 ($Million)
Table 16.Laparoscopy Robotic Systems Market, By Type, 2012-2022 ($Million)
Table 17.Laparoscopy Robotic Systems Market, By Region, 2012-2022 ($Million)
Table 18.FreeHand Endoscope Holder System Market, By Region, 2012-2022 ($Million)
Table 19.Da Vinci Robotic Surgery System Market, By Region, 2012-2022 ($Million)
Table 20.Telelap ALF-X Surgical System Market, By Region, 2012-2022 ($Million)
Table 21.Steerable Robotic Catheters Market, By Region, 2012-2022 ($Million)
Table 22.Rehabilitation Robots Market, By Type, 2012-2022 ($Million)
Table 23.Rehabilitation Robots Market, By Region, 2012-2022 ($Million)
Table 24.Assistive Robots Market, By Region, 2012-2022 ($Million)
Table 25.Prosthetics Market, By Region, 2012-2022 ($Million)
Table 26.Orthotics Market, By Region, 2012-2022 ($Million)
Table 27.Therapeutic Robots Market, By Region, 2012-2022 ($Million)
Table 28.Exoskeleton Robotic Systems Market, By Region, 2012-2022 ($Million)
Table 29.Noninvasive Radiosurgery Robots Market, By Type, 2012-2022 ($Million)
Table 30.Noninvasive Radiosurgery Robots Market, By Region, 2012-2022 ($Million)
Table 31.TrueBeam STx Radiosurgery System Market, By Region, 2012-2022 ($Million)
Table 32.CyberKnife Robotic Radiosurgery System Market, By Region, 2012-2022 ($Million)
Table 33.Gamma Knife Perfexion Radiosurgery System Market, By Region, 2012-2022 ($Million)
Table 34.Hospital and Pharmacy Robots Market, By Type, 2012-2022 ($Million)
Table 35.Hospital and Pharmacy Robots Market, By Region, 2012-2022 ($Million)
Table 36.Telemedicine Robots Market, By Region, 2012-2022 ($Million)
Table 37.I.V. Robots Market, By Region, 2012-2022 ($Million)
Table 38.Pharmacy Robots Market, By Region, 2012-2022 ($Million)
Table 39.Cart transportation Robots Market, By Region, 2012-2022 ($Million)
Table 40.Emergency Response Robotic Systems Market, By Type, 2012-2022 ($Million)
Table 41.Emergency Response Robotic Systems Market, By Region, 2012-2022 ($Million)
Table 42.LS-1 Robotic System Market, By Region, 2012-2022 ($Million)
Table 43.Auto Pulse Plus Robotic System Market, By Region, 2012-2022 ($Million)
Table 44.Global Medical Robotic Systems Market, By Application, 2012-2022 ($Million)
Table 45.Neurology Market, By Region, 2012-2022 ($Million)
Table 46.Orthopedics Robotic Systems Market, By Region, 2012-2022 ($Million)
Table 47.Laparoscopy Market, By Region, 2012-2022 ($Million)
Table 48.Special Education Market, By Region, 2012-2022 ($Million)
Table 49.North America Medical Robotic Systems Market, By Country, 2012-2022 ($Million)
Table 50.North America Medical Robotic Systems Market, By Product, 2012-2022 ($Million)
Table 51.North America Medical Robotic Systems Market, By Application, 2012-2022 ($Million)
Table 52.U.S. Medical Robotic Systems Market, By Product, 2012-2022 ($Million)
Table 53.U.S. Medical Robotic Systems Market, By Application, 2012-2022 ($Million)
Table 54.Canada Medical Robotic Systems Market, By Product, 2012-2022 ($Million)
Table 55.Canada Medical Robotic Systems Market, By Application, 2012-2022 ($Million)
Table 56.Mexico Medical Robotic Systems Market, By Product, 2012-2022 ($Million)
Table 57.Mexico Medical Robotic Systems Market, By Application, 2012-2022 ($Million)
Table 58.Europe Medical Robotic Systems Market, By Country, 2012-2022 ($Million)
Table 59.Europe Medical Robotic Systems Market, By Product, 2012-2022 ($Million)
Table 60.Europe Medical Robotic Systems Market, By Application, 2012-2022 ($Million)
Table 61.Germany Medical Robotic Systems Market, By Product, 2012-2022 ($Million)
Table 62.Germany Medical Robotic Systems Market, By Application, 2012-2022 ($Million)
Table 63.France Medical Robotic Systems Market, By Product, 2012-2022 ($Million)
Table 64.France Medical Robotic Systems Market, By Application, 2012-2022 ($Million)
Table 65.UK Medical Robotic Systems Market, By Product, 2012-2022 ($Million)
Table 66.UK Medical Robotic Systems Market, By Application, 2012-2022 ($Million)
Table 67.Italy Medical Robotic Systems Market, By Product, 2012-2022 ($Million)
Table 68.Italy Medical Robotic Systems Market, By Application, 2012-2022 ($Million)
Table 69.Spain Medical Robotic Systems Market, By Product, 2012-2022 ($Million)
Table 70.Spain Medical Robotic Systems Market, By Application, 2012-2022 ($Million)
Table 71.Rest of Europe Medical Robotic Systems Market, By Product, 2012-2022 ($Million)
Table 72.Rest of Europe Medical Robotic Systems Market, By Application, 2012-2022 ($Million)
Table 73.Asia-Pacific Medical Robotic Systems Market, By Country, 2012-2022 ($Million)
Table 74.Asia-Pacific Medical Robotic Systems Market, By Product, 2012-2022 ($Million)
Table 75.Asia-Pacific Medical Robotic Systems Market, By Application, 2012-2022 ($Million)
Table 76.Japan Medical Robotic Systems Market, By Product, 2012-2022 ($Million)
Table 77.Japan Medical Robotic Systems Market, By Application, 2012-2022 ($Million)
Table 78.China Medical Robotic Systems Market, By Product, 2012-2022 ($Million)
Table 79.China Medical Robotic Systems Market, By Application, 2012-2022 ($Million)
Table 80.Australia Medical Robotic Systems Market, By Product, 2012-2022 ($Million)
Table 81.Australia Medical Robotic Systems Market, By Application, 2012-2022 ($Million)
Table 82.India Medical Robotic Systems Market, By Product, 2012-2022 ($Million)
Table 83.India Medical Robotic Systems Market, By Application, 2012-2022 ($Million)
Table 84.South Korea Medical Robotic Systems Market, By Product, 2012-2022 ($Million)
Table 85.South Korea Medical Robotic Systems Market, By Application, 2012-2022 ($Million)
Table 86.Rest of Asia-Pacific Medical Robotic Systems Market, By Product, 2012-2022 ($Million)
Table 87.Rest of Asia-Pacific Medical Robotic Systems Market, By Application, 2012-2022 ($Million)
Table 88.Rest of the World Medical Robotic Systems Market, By Country, 2012-2022 ($Million)
Table 89.Rest of the World Medical Robotic Systems Market, By Product, 2012-2022 ($Million)
Table 90.Rest of the World Medical Robotic Systems Market, By Application, 2012-2022 ($Million)
Table 91.Brazil Medical Robotic Systems Market, By Product, 2012-2022 ($Million)
Table 92.Brazil Medical Robotic Systems Market, By Application, 2012-2022 ($Million)
Table 93.Turkey Medical Robotic Systems Market, By Product, 2012-2022 ($Million)
Table 94.Turkey Medical Robotic Systems Market, By Application, 2012-2022 ($Million)
Table 95.Saudi Arabia Medical Robotic Systems Market, By Product, 2012-2022 ($Million)
Table 96.Saudi Arabia Medical Robotic Systems Market, By Application, 2012-2022 ($Million)
Table 97.South Africa Medical Robotic Systems Market, By Product, 2012-2022 ($Million)
Table 98.South Africa Medical Robotic Systems Market, By Application, 2012-2022 ($Million)
Table 99.United Arab Emirates Medical Robotic Systems Market, By Product, 2012-2022 ($Million)
Table 100.United Arab Emirates Medical Robotic Systems Market, By Application, 2012-2022 ($Million)
Table 101.Others Medical Robotic Systems Market, By Product, 2012-2022 ($Million)
Table 102.Others Medical Robotic Systems Market, By Application, 2012-2022 ($Million)
Table 103.iRobot Corporation: Key Strategic Developments, 2017-2017
Table 104.Medrobotics Corporation: Key Strategic Developments, 2017-2017
Table 105.Titan Medical Inc.: Key Strategic Developments, 2017-2017
Table 106.Hansen: Key Strategic Developments, 2017-2017
Table 107.Renishaw Plc.: Key Strategic Developments, 2017-2017
Table 108.Health Robotics SLR: Key Strategic Developments, 2017-2017
Table 109.OR Productivity plc.: Key Strategic Developments, 2017-2017
Table 110.Intuitive Surgical: Key Strategic Developments, 2017-2017
Table 111.Mazor Robotics: Key Strategic Developments, 2017-2017
Table 112.Accuray: Key Strategic Developments, 2017-2017
Table 113.Mako Surgical Corp.: Key Strategic Developments, 2017-2017
List of Figures
List of Figures
Figure 1.Global Medical Robotic Systems Market Share, By Product, 2017 & 2025
Figure 2.Global Medical Robotic Systems Market, By Application, 2017, ($Million)
Figure 3.Global Medical Robotic Systems Market, By Region, 2017, ($Million)
Figure 4.iRobot Corporation: Net Revenues, 2017-2017 ($Million)
Figure 5.iRobot Corporation: Net Revenue Share, By Segment, 2017
Figure 6.iRobot Corporation: Net Revenue Share, By Geography, 2017
Figure 7.Medrobotics Corporation: Net Revenues, 2017-2017 ($Million)
Figure 8.Medrobotics Corporation: Net Revenue Share, By Segment, 2017
Figure 9.Medrobotics Corporation: Net Revenue Share, By Geography, 2017
Figure 10.Titan Medical Inc.: Net Revenues, 2017-2017 ($Million)
Figure 11.Titan Medical Inc.: Net Revenue Share, By Segment, 2017
Figure 12.Titan Medical Inc.: Net Revenue Share, By Geography, 2017
Figure 13.Hansen: Net Revenues, 2017-2017 ($Million)
Figure 14.Hansen: Net Revenue Share, By Segment, 2017
Figure 15.Hansen: Net Revenue Share, By Geography, 2017
Figure 16.Mako Surgical Corp.: Net Revenues, 2017-2017 ($Million)
Figure 17.Mako Surgical Corp.: Net Revenue Share, By Segment, 2017
Figure 18.Mako Surgical Corp.: Net Revenue Share, By Geography, 2017
Research Methodology
We use both primary as well as secondary research for our market surveys, estimates and for developing forecast. Our research process commence by analyzing the problem which enable us to design the scope for our research study. Our research process is uniquely designed with enough flexibility to adjust according to changing nature of products and markets, while retaining core element to ensure reliability and accuracy in research findings. We understand both macro and micro-economic factors to evaluate and forecast different market segments.
Data Mining
Data is extensively collected through various secondary sources such as annual reports, investor presentations, SEC filings, and other corporate publications. We also refer trade magazines, technical journals, paid databases such as Factiva and Bloomberg, industry trade journals, scientific journals, and social media data to understand market dynamics and industry trends. Further, we also conduct primary research to understand market drivers, restraints, opportunities, challenges, and competitive scenario to build our analysis.
Data Collection Matrix
|
Data Collection Matrix |
Supply Side |
Demand Side |
|
Primary Data Sources |
|
|
|
Secondary Data Sources |
|
|
Market Modeling and Forecasting
We use epidemiology and capital equipment-based models to forecast market size of different segments at country and regional level.
- Epidemiology-based Forecasting Model: This method uses epidemiology data gathered through various publications and from physicians to estimate population of patients, flow of treatment of individual disease and therapies. The data collected through this method includes statics on incidence of disease, population suffering from disease, and treatment population. This method is used to understand:
- Number of patients for particular device or medical procedure and
- Repeated use of particular device depending on health and condition of patient
- Capital-based Forecasting Model: This method of forecasting is based on number of replacements, installed-based and new sales of capital equipment used in various healthcare and diagnostic centers. These three parameters are calculated and forecast is developed. Installation base is calculated as average number of units per facility; while sales for particular year is calculated from number of new and replace units. Secondary data is collected through various supply chain intermediaries and opinion leaders to arrive at installation and sales rate. These techniques help our analysts in validating market and developed market estimates and forecast.
We do forecast on basis of several parameters such as market drivers, market opportunities, industry trends government regulations, raw materials supply and trade dynamics to ensure relevance of forecast with market scenario. With increasing need to granulized information, we used bottom-up methodology for forecasting where we evaluate each regional segment differently and combined all forecast to develop final market forecast.
Data Validation
We believe primary research is a very important tool in analyzing and forecasting different markets. In order to make sure accuracy of our findings, our team conducts primary interviews at every stage of research to gain deep insights into current business environment and future trends and key developments in market. This includes use of various methods such as telephonic interviews, focus groups, face to face interviews and questionnaires to validate our research from all aspects. We validate our data through primary research from key industry leaders such as CEO, product managers, marketing managers, suppliers, distributors, and consumers are frequently interviewed. These interviews provide valuable insights which help us to have better market understanding besides validating our estimates and forecast.
Data Triangulation

Industry Analysis
|
Qualitative Data |
Quantitative Data (2017-2025) |
|
|