Levulinic Acid Market By Potential Downstream Platform And Application - Global Industry Analysis And Forecast To 2022
Published On : September 2017 Pages : 77 Category: Advanced Materials Report Code : CM09237
Industry Trend Analysis
The levulinic acid market was valued approximately USD 16.07 million in 2017 and is expected to reach around USD 45.36 million by 2022 with a compound annual growth rate (CAGR) of 12.02% over the forecast period, owing to levulinic acid’s potential of replacing phthalate plasticizers that are used for the production of PVC. Levulinic acid is also referred as 4-oxopentanoic acid. It is a natural compound that sorted as a keto acid. It is soluble in ethanol, diethyl ether, and water, however insoluble in aliphatic hydrocarbons and has a material form of crystalline white solid. In recent times, the requirement for sustainability has continuously impelled the chemical industry in the direction of exploring renewable biotechnology and chemistry to produce goods from bio-based reservoirs. These produced are acquired with an aim of employing them as platforms for producing a host of specialty and industrial chemicals to substitute their artificial equivalents. Levulinic acid has been recognized as platform chemical since long. Consequently, despite its comparatively small market volume, it is the major topic of research and development to play a role of a predecessor to special chemicals involving pesticides like D-amino levulinic acid (DALA), fuel additives like Methyltetrahydrofuran (MTHF), and Diphenolic Acid (DPA) along with others. The production technology of bio-based levulinic acid is not much complex, with the extensively used perspective being the dehydrating treatment of carbohydrates or biomass with acid. Some other major technologies are by oxidation of ketones with ozone, acid hydrolysis of furfuryl alcohol and hydrolysis of acetyl succinate esters. Currently, levulinic acid has major applications in pesticides, food additives, cosmetics, pharmaceuticals and minor application in plastics, nylons, and synthetic rubbers. The major raw materials for the production of bio-based levulinic acid are bagasse, biomass, brewery waste and manure, and to supply it at a reasonable price has been a dispute for market players. Furthermore, as with any of the bio-based substitute chemical, the cost has been a crucial issue in the global market for levulinic acid. At present, prices are varying between $5 and $8 for a kilo; producers are challenged with an intimidating task of coordinating objective prices of near to $1 a kilo to get through the downstream platform usage. With an amount of research and development initiatives anticipated to shift for commercialization during the next few years, it is predicted that the cost of levulinic acid shall turn out to be more aggressive in the near future. Encouraging regulatory scenario and expansion in application industry are anticipated to influence levulinic acid demand positively during the next few years.
Application Outlook and Trend Analysis
Major application sections studied and described in this study involve food additives, pharmaceuticals, agriculture, and cosmetics applications. Agriculture applications are such as 2--Methylindole-3-acetic acid and Organic potassium fertilizer DALA. Currently, levulinic acid is used in niche markets, due to its elevated cost. The demand of Levulinic acid for agricultural applications and other chemicals is anticipated to rise at a compound annual growth rate of 6% during forecast period. Key levulinic acid applications in pharmaceuticals involve indomethacin and calcium levulinate, which is an anti-inflammatory and non-steroidal drug, assigned for fever. Demand for Levulinic acid for pharma applications is likely to rise at a compound annual growth rate of 5.4% during forecast period. Furthermore, levulinic acid is also cautiously utilized in cigarettes to enhance nicotine release in smoke and bond of neural receptors to nicotine.
Downstream Potential Outlook and Trend Analysis
Major downstream potential applications of levulinic acid studied and described involves delta-aminolevulinic acid (DALA), methyltetrahydrofuran (MTHF), diphenolic acid (DPA), ethyl levulinate, and others. Marketable scale application of levulinic acid has lately been allied to vehicle fuel extenders, mainly MTHF, which is mixable with petrol in all extent and exhibits prosperous vapor pressure and oxygenating properties. Mediators during modification of the levulinic acid into MTHF involve lactone (GVL), 1, 4 pentanediol and γ -Valero, which are also striking products in their claim. It is expected that levulinic acid producers could experience a latent demand of around 20,000-kilo tons for MTHF usage by 2021.
Regional Outlook and Trend Analysis
In 2017, North America region was the major levulinic acid user, subsequently Europe region and the speedily rising Asia Pacific regional market. The United States and European based downstream market players generally supply levulinic acid from China’s producers at low costs for their particular application. For instance, Segetis is accounted to be supplying levulinic acid for its L-ketals product portfolio from China. In 2017, Europe region was the subsequent largest customer for levulinic acid reported for around 31% of the global sizes. North America regional levulinic acid market income is likely to rise at a compound annual growth rate of 4.6% during the forecast period.
Competitive Outlook and Trend Analysis
Major market players for levulinic acid involve Shanghai Apple Flavor & Fragrance Co., Ltd., Biofine Technology LLC, Hebei Langfang Triple Well Chemicals Co., Ltd., DuPont, Hebei Shijiazhuang Worldwide Furfural & Furfuryl Alcohol Funan Resin Co., Ltd., Shijiazhuang Pharmaceutical Group Co., Ltd., Yancheng China Flavor Chemicals Co., Ltd., CSPC Ouyi Pharmaceutical Co., Ltd. and Segetis. Biofine Technology LLC has been among the leading players in the levulinic acid industry, concentrating on DALA and MTHF downstream applications. A Minnesota-based company, Segetis, lately formulated a particle on esters of levulinic acid prepared from bio based hydroxyl compounds and corn cobs. Levulinic acid is to be utilized as a staple for the producing of solvents, polyols, and plasticizers for polyurethane foams. Levulinic acid plays the role of a potential substitute to phthalate plasticizer used to produce PVC, the majorly used commodity plastic.
The global levulinic acid market is segmented as follows :
By Application
- Pharmaceuticals
- Food Additives
- Agriculture (Organic potassium fertilizer DALA, 2--Methylindole-3-acetic acid)
- Cosmetics
By Potential Downstream
- Delta aminolevulinic acid (DALA)
- Diphenolic Acid
- Methyltetrahydrofuran (MTHF)
- Others
By Regions
- North America
- Canada
- U.S
- Mexico
- Europe
- Spain
- Germany
- UK
- France
- Italy
- Rest of Europe
- Asia-Pacific
- Japan
- India
- China
- Australia
- South Korea
- Rest of Asia Pacific
- Rest of the World
- Brazil
- United Arab Emirates
- South Africa
- Saudi Arabia
- Others
Some of the key questions answered by the report are:
- What was the market size in 2017 and forecast from 2017 to 2022?
- What will be the industry market growth from 2017 to 2022?
- What are the major drivers, restraints, opportunities, challenges, and industry trends and their impact on the market forecast?
- What are the major segments leading the market growth and why?
- Which are the leading players in the market and what are the major strategies adopted by them to sustain the market competition?
Market Classification
- Levulinic Acid Market, By Potential Downstream Platform, Estimates and Forecast, 2014-2022 ($Million)
- Methyltetrahydrofuran (MTHF)
- Delta aminolevulinic acid (DALA)
- Diphenolic Acid
- Other Levulinic Acids
- Levulinic Acid Market, By Application, Estimates and Forecast, 2014-2022 ($Million)
- Pharmaceuticals
- Agriculture (Organic potassium fertililizer DALA, 2--Methylindole-3-acetic acid)
- Food Additives
- Cosmetics
- Levulinic Acid Market, By Region, Estimates and Forecast, 2014-2022 ($Million)
- North America
- North America Levulinic Acid Market, By Country
- North America Levulinic Acid Market, By Potential Downstream Platform
- North America Levulinic Acid Market, By Application
- U.S. Levulinic Acid Market, By Potential Downstream Platform
- U.S. Levulinic Acid Market, By Application
- Canada Levulinic Acid Market, By Potential Downstream Platform
- Canada Levulinic Acid Market, By Application
- Mexico Levulinic Acid Market, By Potential Downstream Platform
- Mexico Levulinic Acid Market, By Application
-
- Europe
- Europe Levulinic Acid Market, By Country
- Europe Levulinic Acid Market, By Potential Downstream Platform
- Europe Levulinic Acid Market, By Application
- Germany Levulinic Acid Market, By Potential Downstream Platform
- Germany Levulinic Acid Market, By Application
- France Levulinic Acid Market, By Potential Downstream Platform
- France Levulinic Acid Market, By Application
- UK Levulinic Acid Market, By Potential Downstream Platform
- UK Levulinic Acid Market, By Application
- Italy Levulinic Acid Market, By Potential Downstream Platform
- Italy Levulinic Acid Market, By Application
- Spain Levulinic Acid Market, By Potential Downstream Platform
- Spain Levulinic Acid Market, By Application
- Rest of Europe Levulinic Acid Market, By Potential Downstream Platform
- Rest of Europe Levulinic Acid Market, By Application
-
- Asia-Pacific
- Asia-Pacific Levulinic Acid Market, By Country
- Asia-Pacific Levulinic Acid Market, By Potential Downstream Platform
- Asia-Pacific Levulinic Acid Market, By Application
- Japan Levulinic Acid Market, By Potential Downstream Platform
- Japan Levulinic Acid Market, By Application
- Australia Levulinic Acid Market, By Potential Downstream Platform
- Australia Levulinic Acid Market, By Application
- India Levulinic Acid Market, By Potential Downstream Platform
- India Levulinic Acid Market, By Application
- South Korea Levulinic Acid Market, By Potential Downstream Platform
- South Korea Levulinic Acid Market, By Application
- Rest of Asia-Pacific Levulinic Acid Market, By Potential Downstream Platform
- Rest of Asia-Pacific Levulinic Acid Market, By Application
- Asia-Pacific
-
- Rest of the World
- Rest of the World Levulinic Acid Market, By Country
- Rest of the World Levulinic Acid Market, By Potential Downstream Platform
- Rest of the World Levulinic Acid Market, By Application
- Brazil Levulinic Acid Market, By Potential Downstream Platform
- Brazil Levulinic Acid Market, By Application
- South Africa Levulinic Acid Market, By Potential Downstream Platform
- South Africa Levulinic Acid Market, By Application
- Saudi Arabia Levulinic Acid Market, By Potential Downstream Platform
- Saudi Arabia Levulinic Acid Market, By Application
- Turkey Levulinic Acid Market, By Potential Downstream Platform
- Turkey Levulinic Acid Market, By Application
- United Arab Emirates Levulinic Acid Market, By Potential Downstream Platform
- United Arab Emirates Levulinic Acid Market, By Application
- Others Levulinic Acid Market, By Potential Downstream Platform
- Others Levulinic Acid Market, By Application
- Rest of the World
Table of Contents
1.Introduction
1.1.Report Description
1.2.Research Methodology
1.2.1. Secondary Research
1.2.2. Primary Research
2.Executive Summary
2.1.Key Highlights
3.Market Overview
3.1.Introduction
3.1.1. Market Definition
3.1.2. Market Segmentation
3.2.Market Share Analysis
3.3.Market Dynamics
3.3.1. Drivers
3.3.1.1.Rising demand for levulinic acid from plasticizers
3.3.1.2.Utilization of Levulinic acid in anti–inflammatory medication
3.3.2. Restraints
3.3.2.1.High Price of Levulinic Acid
3.3.3. Opportunities
3.3.3.1.Technological Advancement in manufacture of polyols which combines with iscoyanates to produce polyurethane.
4.Levulinic Acid Market, By Potential Downstream Platform
4.1.Introduction
4.2.Levulinic Acid Market Assessment and Forecast, By Potential Downstream Platform, 2017-2022
4.3.Methyltetrahydrofuran (MTHF)
4.3.1. Market Assessment and Forecast, By Region, 2017-2022 ($Million)
4.4.Delta aminolevulinic acid (DALA)
4.4.1. Market Assessment and Forecast, By Region, 2017-2022 ($Million)
4.5.Diphenolic Acid
4.5.1. Market Assessment and Forecast, By Region, 2017-2022 ($Million)
4.6.Other Levulinic Acids
4.6.1. Market Assessment and Forecast, By Region, 2017-2022 ($Million)
5.Levulinic Acid Market, By Application
5.1.Introduction
5.2.Levulinic Acid Market Assessment and Forecast, By Application, 2017-2022
5.3.Pharmaceuticals
5.3.1.1.Market Assessment and Forecast, By Region, 2017-2022 ($Million)
5.4.Agriculture (Organic potassium fertililizer DALA, 2--Methylindole-3-acetic acid)
5.4.1.1.Market Assessment and Forecast, By Region, 2017-2022 ($Million)
5.5.Food Additives
5.5.1.1.Market Assessment and Forecast, By Region, 2017-2022 ($Million)
5.6.Cosmetics
5.6.1.1.Market Assessment and Forecast, By Region, 2017-2022 ($Million)
6.Levulinic Acid Market, By Region
6.1.Introduction
6.2.Levulinic Acid Market Assessment and Forecast, By Region, 2017-2022 ($Million)
6.3.North America
6.3.1. Market Assessment and Forecast, By Country, 2017-2022 ($Million)
6.3.2. Market Assessment and Forecast, By Potential Downstream Platform, 2017-2022 ($Million)
6.3.3. Market Assessment and Forecast, By Application, 2017-2022 ($Million)
6.3.3.1.U.S.
6.3.3.1.1.Market Assessment and Forecast, By Potential Downstream Platform, 2017-2022 ($Million)
6.3.3.1.2.Market Assessment and Forecast, By Application, 2017-2022 ($Million)
6.3.3.2.Canada
6.3.3.2.1.Market Assessment and Forecast, By Potential Downstream Platform, 2017-2022 ($Million)
6.3.3.2.2.Market Assessment and Forecast, By Application, 2017-2022 ($Million)
6.3.3.3.Mexico
6.3.3.3.1.Market Assessment and Forecast, By Potential Downstream Platform, 2017-2022 ($Million)
6.3.3.3.2.Market Assessment and Forecast, By Application, 2017-2022 ($Million)
6.4.Europe
6.4.1. Market Assessment and Forecast, By Country, 2017-2022 ($Million)
6.4.2. Market Assessment and Forecast, By Potential Downstream Platform, 2017-2022 ($Million)
6.4.3. Market Assessment and Forecast, By Application, 2017-2022 ($Million)
6.4.3.1.Germany
6.4.3.1.1.Market Assessment and Forecast, By Potential Downstream Platform, 2017-2022 ($Million)
6.4.3.1.2.Market Assessment and Forecast, By Application, 2017-2022 ($Million)
6.4.3.2.France
6.4.3.2.1.Market Assessment and Forecast, By Potential Downstream Platform, 2017-2022 ($Million)
6.4.3.2.2.Market Assessment and Forecast, By Potential Downstream Platform, 2017-2022 ($Million)
6.4.3.3.UK
6.4.3.3.1.Market Assessment and Forecast, By Potential Downstream Platform, 2017-2022 ($Million)
6.4.3.3.2.Market Assessment and Forecast, By Application, 2017-2022 ($Million)
6.4.3.4.Italy
6.4.3.4.1.Market Assessment and Forecast, By Potential Downstream Platform, 2017-2022 ($Million)
6.4.3.4.2.Market Assessment and Forecast, By Application, 2017-2022 ($Million)
6.4.3.5.Spain
6.4.3.5.1.Market Assessment and Forecast, By Potential Downstream Platform, 2017-2022 ($Million)
6.4.3.5.2.Market Assessment and Forecast, By Application, 2017-2022 ($Million)
6.4.3.6.Russia
6.4.3.6.1.Market Assessment and Forecast, By Potential Downstream Platform, 2017-2022 ($Million)
6.4.3.6.2.Market Assessment and Forecast, By Application, 2017-2022 ($Million)
6.4.3.7.Rest of Europe
6.4.3.7.1.Market Assessment and Forecast, By Potential Downstream Platform, 2017-2022 ($Million)
6.4.3.7.2.Market Assessment and Forecast, By Application, 2017-2022 ($Million)
6.5.Asia-Pacific
6.5.1. Market Assessment and Forecast, By Country, 2017-2022 ($Million)
6.5.2. Market Assessment and Forecast, By Potential Downstream Platform, 2017-2022 ($Million)
6.5.3. Market Assessment and Forecast, By Application, 2017-2022 ($Million)
6.5.3.1.Japan
6.5.3.1.1.Market Assessment and Forecast, By Potential Downstream Platform, 2017-2022 ($Million)
6.5.3.1.2.Market Assessment and Forecast, By Application, 2017-2022 ($Million)
6.5.3.2.China
6.5.3.2.1.Market Assessment and Forecast, By Potential Downstream Platform, 2017-2022 ($Million)
6.5.3.2.2.Market Assessment and Forecast, By Application, 2017-2022 ($Million)
6.5.3.3.Australia
6.5.3.3.1.Market Assessment and Forecast, By Potential Downstream Platform, 2017-2022 ($Million)
6.5.3.3.2.Market Assessment and Forecast, By Application, 2017-2022 ($Million)
6.5.3.4.India
6.5.3.4.1.Market Assessment and Forecast, By Potential Downstream Platform, 2017-2022 ($Million)
6.5.3.4.2.Market Assessment and Forecast, By Application, 2017-2022 ($Million)
6.5.3.5.South Korea
6.5.3.5.1.Market Assessment and Forecast, By Potential Downstream Platform, 2017-2022 ($Million)
6.5.3.5.2.Market Assessment and Forecast, By Application, 2017-2022 ($Million)
6.5.3.6.Taiwan
6.5.3.6.1.Market Assessment and Forecast, By Potential Downstream Platform, 2017-2022 ($Million)
6.5.3.6.2.Market Assessment and Forecast, By Application, 2017-2022 ($Million)
6.5.3.7.Rest of Asia-Pacific
6.5.3.7.1.Market Assessment and Forecast, By Potential Downstream Platform, 2017-2022 ($Million)
6.5.3.7.2.Market Assessment and Forecast, By Application, 2017-2022 ($Million)
6.6.Rest of the World
6.6.1. Market Assessment and Forecast, By Country, 2017-2022 ($Million)
6.6.2. Market Assessment and Forecast, By Potential Downstream Platform, 2017-2022 ($Million)
6.6.3. Market Assessment and Forecast, By Application, 2017-2022 ($Million)
6.6.3.1.Brazil
6.6.3.1.1.Market Assessment and Forecast, By Potential Downstream Platform, 2017-2022 ($Million)
6.6.3.1.2.Market Assessment and Forecast, By Application, 2017-2022 ($Million)
6.6.3.2.Turkey
6.6.3.2.1.Market Assessment and Forecast, By Potential Downstream Platform, 2017-2022 ($Million)
6.6.3.2.2.Market Assessment and Forecast, By Application, 2017-2022 ($Million)
6.6.3.3.Saudi Arabia
6.6.3.3.1.Market Assessment and Forecast, By Potential Downstream Platform, 2017-2022 ($Million)
6.6.3.3.2.Market Assessment and Forecast, By Application, 2017-2022 ($Million)
6.6.3.4.South Africa
6.6.3.4.1.Market Assessment and Forecast, By Potential Downstream Platform, 2017-2022 ($Million)
6.6.3.4.2.Market Assessment and Forecast, By Application, 2017-2022 ($Million)
6.6.3.5.United Arab Emirates
6.6.3.5.1.Market Assessment and Forecast, By Potential Downstream Platform, 2017-2022 ($Million)
6.6.3.5.2.Market Assessment and Forecast, By Application, 2017-2022 ($Million)
6.6.3.6.Others
6.6.3.6.1.Market Assessment and Forecast, By Potential Downstream Platform, 2017-2022 ($Million)
6.6.3.6.2.Market Assessment and Forecast, By Application, 2017-2022 ($Million)
7.Company Profiles
7.1.Biofine Technology LLC
7.1.1. Business Overview
7.1.2. Product Portfolio
7.1.3. Strategic Developments
7.2.Segetis
7.2.1. Business Overview
7.2.2. Product Portfolio
7.2.3. Strategic Developments
7.3.DuPont
7.3.1. Business Overview
7.3.2. Product Portfolio
7.3.3. Key Financials
7.3.4. Strategic Developments
7.4.Jiangsu Yancheng China Flavor Chemicals Co. Ltd
7.4.1. Business Overview
7.4.2. Product Portfolio
7.4.3. Strategic Developments
7.5.Hebei Shijiazhuang Worldwide Furfural & Furfuryl Alcohol Furan Resin Co. Ltd.
7.5.1. Business Overview
7.5.2. Product Portfolio
7.5.3. Strategic Developments
7.6.Jiangsu Yancheng China Flavor Chemicals Co. Ltd
7.6.1. Business Overview
7.6.2. Product Portfolio
7.6.3. Strategic Developments
7.7.Shijiazhuang Pharmaceutical Group Ouyi Pharmaceutical Co. Ltd
7.7.1. Business Overview
7.7.2. Product Portfolio
7.7.3. Strategic Developments
List of Tables
Table 1.Levulinic Acid Market, By Potential Downstream Platform ($Million), 2017-2022
Table 2.Methyltetrahydrofuran (MTHF), By Region ($Million), 2017-2022
Table 3.Delta aminolevulinic acid (DALA) Market, By Region ($Million), 2017-2022
Table 4.Diphenolic Acid Market, By Region ($Million), 2017-2022
Table 5.Other Levulinic Acids Market, By Region ($Million), 2017-2022
Table 6.Levulinic Acid Market, By Application ($Million), 2017-2022
Table 7.Pharmaceuticals Market, By Region ($Million), 2017-2022
Table 8.Agriculture (Organic potassium fertililizer DALA, 2--Methylindole-3-acetic acid) Market, By Region ($Million), 2017-2022
Table 9.Food Additives Market, By Region ($Million), 2017-2022
Table 10.Cosmetics Market, By Region ($Million), 2017-2022
Table 11.Levulinic Acid Market, By Region ($Million), 2017-2022
Table 12.North America Levulinic Acid Market, By Country, 2017-2022 ($Million)
Table 13.North America Levulinic Acid Market, By Potential Downstream Platform, 2017-2022 ($Million)
Table 14.North America Levulinic Acid Market, By Application, 2017-2022 ($Million)
Table 15.U.S. Levulinic Acid Market, By Potential Downstream Platform, 2017-2022 ($Million)
Table 16.U.S. Levulinic Acid Market, By Application, 2017-2022 ($Million)
Table 17.Canada Levulinic Acid Market, By Potential Downstream Platform, 2017-2022 ($Million)
Table 18.Canada Levulinic Acid Market, By Application, 2017-2022 ($Million)
Table 19.Mexico Levulinic Acid Market, By Potential Downstream Platform, 2017-2022 ($Million)
Table 20.Mexico Levulinic Acid Market, By Application, 2017-2022 ($Million)
Table 21.Europe Levulinic Acid Market, By Country, 2017-2022 ($Million)
Table 22.Europe Levulinic Acid Market, By Potential Downstream Platform, 2017-2022 ($Million)
Table 23.Europe Levulinic Acid Market, By Application, 2017-2022 ($Million)
Table 24.Germany Levulinic Acid Market, By Potential Downstream Platform, 2017-2022 ($Million)
Table 25.Germany Levulinic Acid Market, By Application, 2017-2022 ($Million)
Table 26.France Levulinic Acid Market, By Potential Downstream Platform, 2017-2022 ($Million)
Table 27.France Levulinic Acid Market, By Application, 2017-2022 ($Million)
Table 28.UK Levulinic Acid Market, By Potential Downstream Platform, 2017-2022 ($Million)
Table 29.UK Levulinic Acid Market, By Application, 2017-2022 ($Million)
Table 30.Italy Levulinic Acid Market, By Potential Downstream Platform, 2017-2022 ($Million)
Table 31.Italy Levulinic Acid Market, By Application, 2017-2022 ($Million)
Table 32.Spain Levulinic Acid Market, By Potential Downstream Platform, 2017-2022 ($Million)
Table 33.Spain Levulinic Acid Market, By Application, 2017-2022 ($Million)
Table 34.Russia Levulinic Acid Market, By Potential Downstream Platform, 2017-2022 ($Million)
Table 35.Russia Levulinic Acid Market, By Application, 2017-2022 ($Million)
Table 36.Rest of Europe Levulinic Acid Market, By Potential Downstream Platform, 2017-2022 ($Million)
Table 37.Rest of Europe Levulinic Acid Market, By Application, 2017-2022 ($Million)
Table 38.Asia-Pacific Levulinic Acid Market, By Country, 2017-2022 ($Million)
Table 39.Asia-Pacific Levulinic Acid Market, By Potential Downstream Platform, 2017-2022 ($Million)
Table 40.Asia-Pacific Levulinic Acid Market, By Application, 2017-2022 ($Million)
Table 41.Japan Levulinic Acid Market, By Potential Downstream Platform, 2017-2022 ($Million)
Table 42.Japan Levulinic Acid Market, By Application, 2017-2022 ($Million)
Table 43.China Levulinic Acid Market, By Potential Downstream Platform, 2017-2022 ($Million)
Table 44.China Levulinic Acid Market, By Application, 2017-2022 ($Million)
Table 45.Australia Levulinic Acid Market, By Potential Downstream Platform, 2017-2022 ($Million)
Table 46.Australia Levulinic Acid Market, By Application, 2017-2022 ($Million)
Table 47.India Levulinic Acid Market, By Potential Downstream Platform, 2017-2022 ($Million)
Table 48.India Levulinic Acid Market, By Application, 2017-2022 ($Million)
Table 49.South Korea Levulinic Acid Market, By Potential Downstream Platform, 2017-2022 ($Million)
Table 50.South Korea Levulinic Acid Market, By Application, 2017-2022 ($Million)
Table 51.Taiwan Levulinic Acid Market, By Potential Downstream Platform, 2017-2022 ($Million)
Table 52.Taiwan Levulinic Acid Market, By Application, 2017-2022 ($Million)
Table 53.Rest of Asia-Pacific Levulinic Acid Market, By Potential Downstream Platform, 2017-2022 ($Million)
Table 54.Rest of Asia-Pacific Levulinic Acid Market, By Application, 2017-2022 ($Million)
Table 55.Rest of the World Levulinic Acid Market, By Country, 2017-2022 ($Million)
Table 56.Rest of the World Levulinic Acid Market, By Potential Downstream Platform, 2017-2022 ($Million)
Table 57.Rest of the World Levulinic Acid Market, By Application, 2017-2022 ($Million)
Table 58.Brazil Levulinic Acid Market, By Potential Downstream Platform, 2017-2022 ($Million)
Table 59.Brazil Levulinic Acid Market, By Application, 2017-2022 ($Million)
Table 60.Turkey Levulinic Acid Market, By Potential Downstream Platform, 2017-2022 ($Million)
Table 61.Turkey Levulinic Acid Market, By Application, 2017-2022 ($Million)
Table 62.Saudi Arabia Levulinic Acid Market, By Potential Downstream Platform, 2017-2022 ($Million)
Table 63.Saudi Arabia Levulinic Acid Market, By Application, 2017-2022 ($Million)
Table 64.South Africa Levulinic Acid Market, By Potential Downstream Platform, 2017-2022 ($Million)
Table 65.South Africa Levulinic Acid Market, By Application, 2017-2022 ($Million)
Table 66.United Arab Emirates Levulinic Acid Market, By Potential Downstream Platform, 2017-2022 ($Million)
Table 67.United Arab Emirates Levulinic Acid Market, By Application, 2017-2022 ($Million)
Table 68.Others Levulinic Acid Market, By Potential Downstream Platform, 2017-2022 ($Million)
Table 69.Others Levulinic Acid Market, By Application, 2017-2022 ($Million)
Table 70.Biofine Technology LLC: Key Strategic Developments, 2017-2017
Table 71.Segetis: Key Strategic Developments, 2017-2017
Table 72.DuPont: Key Strategic Developments, 2017-2017
Table 73.Jiangsu Yancheng China Flavor Chemicals Co. Ltd: Key Strategic Developments, 2017-2017
Table 74.Hebei Shijiazhuang Worldwide Furfural & Furfuryl Alcohol Furan Resin Co. Ltd.: Key Strategic Developments, 2017-2017
Table 75.Jiangsu Yancheng China Flavor Chemicals Co. Ltd: Key Strategic Developments, 2017-2017
Table 76.Shijiazhuang Pharmaceutical Group Ouyi Pharmaceutical Co. Ltd: Key Strategic Developments, 2017-2017
List of Figures
Figure 1.Levulinic Acid Market Share, By Potential Downstream Platform, 2017 & 2022 ($Million)
Figure 2.Levulinic Acid Market, By Application, 2017 & 2022 ($Million)
Figure 3.Levulinic Acid Market, By Region, 2017, ($Million)
Figure 4.DuPont: Net Revenues, 2017-2017 ($Million)
Figure 5.DuPont: Net Revenue Share, By Segment, 2017
Figure 6.DuPont: Net Revenue Share, By Geography, 2017
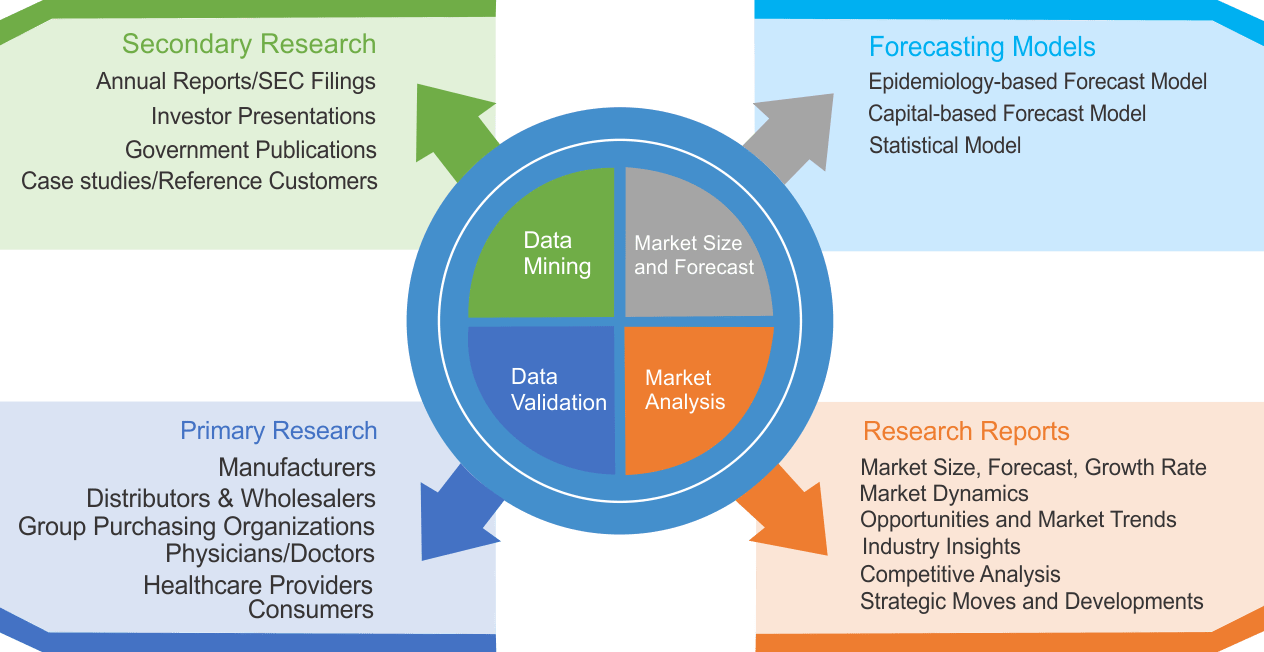
Research Methodology
We use both primary as well as secondary research for our market surveys, estimates and for developing forecast. Our research process commence by analyzing the problem which enable us to design the scope for our research study. Our research process is uniquely designed with enough flexibility to adjust according to changing nature of products and markets, while retaining core element to ensure reliability and accuracy in research findings. We understand both macro and micro-economic factors to evaluate and forecast different market segments.
Data Mining
Data is extensively collected through various secondary sources such as annual reports, investor presentations, SEC filings, and other corporate publications. We also refer trade magazines, technical journals, paid databases such as Factiva and Bloomberg, industry trade journals, scientific journals, and social media data to understand market dynamics and industry trends. Further, we also conduct primary research to understand market drivers, restraints, opportunities, challenges, and competitive scenario to build our analysis.
Data Collection Matrix
|
Data Collection Matrix |
Supply Side |
Demand Side |
|
Primary Data Sources |
|
|
|
Secondary Data Sources |
|
|
Market Modeling and Forecasting
We use epidemiology and capital equipment-based models to forecast market size of different segments at country and regional level.
- Epidemiology-based Forecasting Model: This method uses epidemiology data gathered through various publications and from physicians to estimate population of patients, flow of treatment of individual disease and therapies. The data collected through this method includes statics on incidence of disease, population suffering from disease, and treatment population. This method is used to understand:
- Number of patients for particular device or medical procedure and
- Repeated use of particular device depending on health and condition of patient
- Capital-based Forecasting Model: This method of forecasting is based on number of replacements, installed-based and new sales of capital equipment used in various healthcare and diagnostic centers. These three parameters are calculated and forecast is developed. Installation base is calculated as average number of units per facility; while sales for particular year is calculated from number of new and replace units. Secondary data is collected through various supply chain intermediaries and opinion leaders to arrive at installation and sales rate. These techniques help our analysts in validating market and developed market estimates and forecast.
We do forecast on basis of several parameters such as market drivers, market opportunities, industry trends government regulations, raw materials supply and trade dynamics to ensure relevance of forecast with market scenario. With increasing need to granulized information, we used bottom-up methodology for forecasting where we evaluate each regional segment differently and combined all forecast to develop final market forecast.
Data Validation
We believe primary research is a very important tool in analyzing and forecasting different markets. In order to make sure accuracy of our findings, our team conducts primary interviews at every stage of research to gain deep insights into current business environment and future trends and key developments in market. This includes use of various methods such as telephonic interviews, focus groups, face to face interviews and questionnaires to validate our research from all aspects. We validate our data through primary research from key industry leaders such as CEO, product managers, marketing managers, suppliers, distributors, and consumers are frequently interviewed. These interviews provide valuable insights which help us to have better market understanding besides validating our estimates and forecast.
Data Triangulation
Industry Analysis
|
Qualitative Data |
Quantitative Data (2017-2025) |
|
|