Insulation Market by Product Type and Application - Global Industry Analysis and Forecast to 2022
Published On : September 2017 Pages : 102 Category: Advanced Materials Report Code : CM09232
Industry Trend Analysis
The insulation market was valued around USD 40.06 billion in 2017 and is expected to reach roughly USD 74.75 billion by the end of 2022 while registering itself at a compound annual growth rate (CAGR) of 7.06% during the forecast years, owing to rising consumer awareness about energy conservation. The encouraging regulatory circumstances in the majority parts of the globe, like novel building codes in the EU which necessitate amplified insulation utilization to trim down energy consumption and it is also anticipated to influence demand growth positively. Rising infrastructure expenditure in developing markets of Asia Pacific region such as China, India, Thailand, Indonesia, etc. is also anticipated to encourage growth over the next few years. Unstable prices of major raw materials are projected to pose a major challenge for market players. Raw materials like styrene that are utilized to produce plastic foams are experiencing volatility because of uncertain prices of crude oil. Such problems are projected to challenge major industry players concerning production costs and profitability. Though, in the present scenario, lesser crude oil cost is anticipated to promote the demand growth for plastic foam. Eminent level of desegregation subsists in the foamed plastic industry as the staple suppliers are incorporated ahead to produce insulation products. Key players in the global market are expected to aim for initial mover benefit in order to attain a bigger share and also enlarge the portfolio of the product. Rising expenditure on R&D by key manufacturers is predicted to have a positive impact on the global market. Top players have been concentrating on acquisitions mergers and to develop their existence in the developing regions. Huntsman acquired around 20% shares in Nippon Aqua Co. Ltd. in accordance strengthen grip in the East Asian market during 2017.
Product Outlook and Trend Analysis
In 2017, the largest product used was Foamed plastic and was reported for around 45% of the overall revenue. Foamed plastic is extensively employed for acoustic as well as thermal insulations in non-residential and residential applications owing to its elevated insulation rate. Plastic foam material demand is also likely to initiate from freezers and refrigerators. Fiberglass is also a type of insulation material that will find a rise in demand from the recoiling construction segment in Canada and U.S. The product is extensively utilized in North America owing to its beneficial properties such as ease of installation and low cost and is hence favored by DIYers. Increasing demand, particularly for thermal insulations mainly used for energy proficient applications, is projected to fuel the total growth of product sector.
Application Outlook and Trend Analysis
The residential application section is expected to rule the market and is estimated to reach a substantial amount by the end of forecast period. Rising need for thermal insulation for households in North America and Europe is predicted to fuel the growth of the applications. The United States Dept. of Energy initiative through Weatherization Assistance Program (WAP) to amend the energy competence of low-income houses by federal financial support is anticipated to impact the insulation demand in residential construction positively. Increasing residential infrastructure segment around developing region is likely to further balance the market growth during the forecast years. Rising urbanization in developing countries of Asia Pacific region has amplified the need for improved public and commercial infrastructure. This trend together with encouraging regulations concerning the energy competence of these buildings is anticipated to fuel insulation requirement in non-residential building application during the forecast years.
Regional Outlook and Trend Analysis
Asia Pacific regional insulation market directed the global market and reported for around 40% of overall revenue in 2017 globally. The local market is distinguished by elevated insulation requirement in commercial and residential buildings. Eminent industrialization rates together with amplified construction expenditure in developing countries like India and China along with Thailand, Indonesia, Philippines, and Malaysia have impelled the need for improved infrastructure. Increasing thermal insulation demand in commercial and residential buildings is anticipated to be a key driving factor for the demand from North American region. Rising awareness amongst customers about regulatory policies and energy conservation to cut down greenhouse gas discharges is anticipated to impact the regional market growth positively. North America’s regional insulation market growth will be prejudiced by initiatives taken by the government like Weatherization Assistance Program that encourages thermal insulation, particularly in low-income households. The regional market growth for thermal insulation can also be assigned to the demand of insulation material for construction restoration.
Competitive Outlook and Trend Analysis
The global insulation industry is distinguished by the existence of international conglomerates. Manufacturing of these materials is extremely capital-centric and thus, the hurdles to access are high. Accomplishing economies of level remains the key focal point for market participants to survive the rivalry. The market is dominated by 4 key companies by means of a very little difference in their product presentation. Due to infrastructure expansion in developing regions, key players are concentrating on attaining a first mover benefit in this profitable industry. Competition in the market is greatly impacted by ecological regulations. Major players working in the market include Huntsman Corporation, Rockwool, Knauf, Johns Manville Corporation, and Saint-Gobain S.A.
The global insulation market is segmented as follows –
By Product type
- Fiberglass
- Plastic Foam
- Mineral Wool
- Other Product Types
By Application
- Residential Construction
- Industrial, HVAC, and OEM
- Nonresidential Construction
By Region
- North America
- Canada
- U.S
- Mexico
- Europe
- Spain
- Germany
- UK
- France
- Italy
- Rest of Europe
- Asia-Pacific
- Japan
- India
- China
- Australia
- South Korea
- Rest of Asia Pacific
- Rest of the World
- Brazil
- United Arab Emirates
- South Africa
- Saudi Arabia
- Others
Some of the key questions answered by the report are:
- What was the market size in 2017 and forecast from 2017 to 2022?
- What will be the industry market growth from 2017 to 2022?
- What are the major drivers, restraints, opportunities, challenges, and industry trends and their impact on the market forecast?
- What are the major segments leading the market growth and why?
- Which are the leading players in the market and what are the major strategies adopted by them to sustain the market competition?
Market Classification
- Insulation Market, By Product Type, Estimates and Forecast, 2014-2022 ($Million)
- Fiberglass
- Plastic Foam
- Mineral Wool
- Other Product Types
- Insulation Market, By Application, Estimates and Forecast, 2014-2022 ($Million)
- Residential Construction
- Industrial, HVAC, and OEM
- Nonresidential Construction
- Insulation Market, By Region, Estimates and Forecast, 2014-2022 ($Million)
- North America
- North America Insulation Market, By Country
- North America Insulation Market, By Product Type
- North America Insulation Market, By Application
- U.S. Insulation Market, By Product Type
- U.S. Insulation Market, By Application
- Canada Insulation Market, By Product Type
- Canada Insulation Market, By Application
- Mexico Insulation Market, By Product Type
- Mexico Insulation Market, By Application
-
- Europe
- Europe Insulation Market, By Country
- Europe Insulation Market, By Product Type
- Europe Insulation Market, By Application
- Germany Insulation Market, By Product Type
- Germany Insulation Market, By Application
- France Insulation Market, By Product Type
- France Insulation Market, By Application
- UK Insulation Market, By Product Type
- UK Insulation Market, By Application
- Italy Insulation Market, By Product Type
- Italy Insulation Market, By Application
- Spain Insulation Market, By Product Type
- Spain Insulation Market, By Application
- Rest of Europe Insulation Market, By Product Type
- Rest of Europe Insulation Market, By Application
-
- Asia-Pacific
- Asia-Pacific Insulation Market, By Country
- Asia-Pacific Insulation Market, By Product Type
- Asia-Pacific Insulation Market, By Application
- Japan Insulation Market, By Product Type
- Japan Insulation Market, By Application
- Australia Insulation Market, By Product Type
- Australia Insulation Market, By Application
- India Insulation Market, By Product Type
- India Insulation Market, By Application
- South Korea Insulation Market, By Product Type
- South Korea Insulation Market, By Application
- Rest of Asia-Pacific Insulation Market, By Product Type
- Rest of Asia-Pacific Insulation Market, By Application
- Asia-Pacific
-
- Rest of the World
- Rest of the World Insulation Market, By Country
- Rest of the World Insulation Market, By Product Type
- Rest of the World Insulation Market, By Application
- Brazil Insulation Market, By Product Type
- Brazil Insulation Market, By Application
- South Africa Insulation Market, By Product Type
- South Africa Insulation Market, By Application
- Saudi Arabia Insulation Market, By Product Type
- Saudi Arabia Insulation Market, By Application
- Turkey Insulation Market, By Product Type
- Turkey Insulation Market, By Application
- United Arab Emirates Insulation Market, By Product Type
- United Arab Emirates Insulation Market, By Application
- Others Insulation Market, By Product Type
- Others Insulation Market, By Application
- Rest of the World
Table of Contents
1.Introduction
1.1.Report Description
1.2.Research Methodology
1.2.1. Secondary Research
1.2.2. Primary Research
2.Executive Summary
2.1.Key Highlights
3.Market Overview
3.1.Introduction
3.1.1. Market Definition
3.1.2. Market Segmentation
3.2.Market Share Analysis
3.3.Market Dynamics
3.3.1. Drivers
3.3.1.1.Expansion of Green Buildings
3.3.1.2.Strict Regulations to Diminish Greenhouse Gas Emission
3.3.1.3.Reduction in Energy Consumption and its related spending
3.3.2. Restraints
3.3.2.1.Availability of Green Insulation Material
3.3.3. Opportunities
3.3.3.1.Advancement in increased requirement of Energy
3.4.Industry Trends
4.Insulation Market, By Product Type
4.1.Introduction
4.2.Insulation Market Assessment and Forecast, By Product Type, 2017-2022
4.3.Fiberglass
4.3.1. Market Assessment and Forecast, By Region, 2017-2022 ($Million)
4.4.Plastic Foam
4.4.1. Market Assessment and Forecast, By Region, 2017-2022 ($Million)
4.5.Mineral Wool
4.5.1. Market Assessment and Forecast, By Region, 2017-2022 ($Million)
4.6.Other Product Type
4.6.1. Market Assessment and Forecast, By Region, 2017-2022 ($Million)
5.Insulation Market, By Application
5.1.Introduction
5.2.Insulation Market Assessment and Forecast, By Application, 2017-2022
5.3.Residential Construction
5.3.1.1.Market Assessment and Forecast, By Region, 2017-2022 ($Million)
5.4.Industrial, HVAC, and OEM
5.4.1.1.Market Assessment and Forecast, By Region, 2017-2022 ($Million)
5.5.Nonresidential Construction
5.5.1.1.Market Assessment and Forecast, By Region, 2017-2022 ($Million)
6.Insulation Market, By Region
6.1.Introduction
6.2.Insulation Market Assessment and Forecast, By Region, 2017-2022 ($Million)
6.3.North America
6.3.1. Market Assessment and Forecast, By Country, 2017-2022 ($Million)
6.3.2. Market Assessment and Forecast, By Product Type, 2017-2022 ($Million)
6.3.3. Market Assessment and Forecast, By Application, 2017-2022 ($Million)
6.3.3.1.U.S.
6.3.3.1.1.Market Assessment and Forecast, By Product Type, 2017-2022 ($Million)
6.3.3.1.2.Market Assessment and Forecast, By Application, 2017-2022 ($Million)
6.3.3.2.Canada
6.3.3.2.1.Market Assessment and Forecast, By Product Type, 2017-2022 ($Million)
6.3.3.2.2.Market Assessment and Forecast, By Application, 2017-2022 ($Million)
6.3.3.3.Mexico
6.3.3.3.1.Market Assessment and Forecast, By Product Type, 2017-2022 ($Million)
6.3.3.3.2.Market Assessment and Forecast, By Application, 2017-2022 ($Million)
6.4.Europe
6.4.1. Market Assessment and Forecast, By Country, 2017-2022 ($Million)
6.4.2. Market Assessment and Forecast, By Product Type, 2017-2022 ($Million)
6.4.3. Market Assessment and Forecast, By Application, 2017-2022 ($Million)
6.4.3.1.Germany
6.4.3.1.1.Market Assessment and Forecast, By Product Type, 2017-2022 ($Million)
6.4.3.1.2.Market Assessment and Forecast, By Application, 2017-2022 ($Million)
6.4.3.2.France
6.4.3.2.1.Market Assessment and Forecast, By Product Type, 2017-2022 ($Million)
6.4.3.2.2.Market Assessment and Forecast, By Product Type, 2017-2022 ($Million)
6.4.3.3.UK
6.4.3.3.1.Market Assessment and Forecast, By Product Type, 2017-2022 ($Million)
6.4.3.3.2.Market Assessment and Forecast, By Application, 2017-2022 ($Million)
6.4.3.4.Italy
6.4.3.4.1.Market Assessment and Forecast, By Product Type, 2017-2022 ($Million)
6.4.3.4.2.Market Assessment and Forecast, By Application, 2017-2022 ($Million)
6.4.3.5.Spain
6.4.3.5.1.Market Assessment and Forecast, By Product Type, 2017-2022 ($Million)
6.4.3.5.2.Market Assessment and Forecast, By Application, 2017-2022 ($Million)
6.4.3.6.Russia
6.4.3.6.1.Market Assessment and Forecast, By Product Type, 2017-2022 ($Million)
6.4.3.6.2.Market Assessment and Forecast, By Application, 2017-2022 ($Million)
6.4.3.7.Rest of Europe
6.4.3.7.1.Market Assessment and Forecast, By Product Type, 2017-2022 ($Million)
6.4.3.7.2.Market Assessment and Forecast, By Application, 2017-2022 ($Million)
6.5.Asia-Pacific
6.5.1. Market Assessment and Forecast, By Country, 2017-2022 ($Million)
6.5.2. Market Assessment and Forecast, By Product Type, 2017-2022 ($Million)
6.5.3. Market Assessment and Forecast, By Application, 2017-2022 ($Million)
6.5.3.1.Japan
6.5.3.1.1.Market Assessment and Forecast, By Product Type, 2017-2022 ($Million)
6.5.3.1.2.Market Assessment and Forecast, By Application, 2017-2022 ($Million)
6.5.3.2.China
6.5.3.2.1.Market Assessment and Forecast, By Product Type, 2017-2022 ($Million)
6.5.3.2.2.Market Assessment and Forecast, By Application, 2017-2022 ($Million)
6.5.3.3.Australia
6.5.3.3.1.Market Assessment and Forecast, By Product Type, 2017-2022 ($Million)
6.5.3.3.2.Market Assessment and Forecast, By Application, 2017-2022 ($Million)
6.5.3.4.India
6.5.3.4.1.Market Assessment and Forecast, By Product Type, 2017-2022 ($Million)
6.5.3.4.2.Market Assessment and Forecast, By Application, 2017-2022 ($Million)
6.5.3.5.South Korea
6.5.3.5.1.Market Assessment and Forecast, By Product Type, 2017-2022 ($Million)
6.5.3.5.2.Market Assessment and Forecast, By Application, 2017-2022 ($Million)
6.5.3.6.Taiwan
6.5.3.6.1.Market Assessment and Forecast, By Product Type, 2017-2022 ($Million)
6.5.3.6.2.Market Assessment and Forecast, By Application, 2017-2022 ($Million)
6.5.3.7.Rest of Asia-Pacific
6.5.3.7.1.Market Assessment and Forecast, By Product Type, 2017-2022 ($Million)
6.5.3.7.2.Market Assessment and Forecast, By Application, 2017-2022 ($Million)
6.6.Rest of the World
6.6.1. Market Assessment and Forecast, By Country, 2017-2022 ($Million)
6.6.2. Market Assessment and Forecast, By Product Type, 2017-2022 ($Million)
6.6.3. Market Assessment and Forecast, By Application, 2017-2022 ($Million)
6.6.3.1.Brazil
6.6.3.1.1.Market Assessment and Forecast, By Product Type, 2017-2022 ($Million)
6.6.3.1.2.Market Assessment and Forecast, By Application, 2017-2022 ($Million)
6.6.3.2.Turkey
6.6.3.2.1.Market Assessment and Forecast, By Product Type, 2017-2022 ($Million)
6.6.3.2.2.Market Assessment and Forecast, By Application, 2017-2022 ($Million)
6.6.3.3.Saudi Arabia
6.6.3.3.1.Market Assessment and Forecast, By Product Type, 2017-2022 ($Million)
6.6.3.3.2.Market Assessment and Forecast, By Application, 2017-2022 ($Million)
6.6.3.4.South Africa
6.6.3.4.1.Market Assessment and Forecast, By Product Type, 2017-2022 ($Million)
6.6.3.4.2.Market Assessment and Forecast, By Application, 2017-2022 ($Million)
6.6.3.5.United Arab Emirates
6.6.3.5.1.Market Assessment and Forecast, By Product Type, 2017-2022 ($Million)
6.6.3.5.2.Market Assessment and Forecast, By Application, 2017-2022 ($Million)
6.6.3.6.Others
6.6.3.6.1.Market Assessment and Forecast, By Product Type, 2017-2022 ($Million)
6.6.3.6.2.Market Assessment and Forecast, By Application, 2017-2022 ($Million)
7.Company Profiles
7.1.Guardian Building Products Inc.
7.1.1. Business Overview
7.1.2. Product Portfolio
7.1.3. Strategic Developments
7.2.GAF Materials Corporation
7.2.1. Business Overview
7.2.2. Product Portfolio
7.2.3. Strategic Developments
7.3.Johns Manville Corporation
7.3.1. Business Overview
7.3.2. Product Portfolio
7.3.3. Strategic Developments
7.4.Huntsman Corporation
7.4.1. Business Overview
7.4.2. Product Portfolio
7.4.3. Key Financials
7.4.4. Strategic Developments
7.5.NOVA Chemicals Corporation
7.5.1. Business Overview
7.5.2. Product Portfolio
7.5.3. Key Financials
7.5.4. Strategic Developments
7.6.Knauf Gips KG
7.6.1. Business Overview
7.6.2. Product Portfolio
7.6.3. Strategic Developments
7.7.Cellofoam North America Inc.
7.7.1. Business Overview
7.7.2. Product Portfolio
7.7.3. Strategic Developments
7.8.CertainTeed Corporation (Subsidiary of Saint-Gobain SA)
7.8.1. Business Overview
7.8.2. Product Portfolio
7.8.3. Key Financials
7.8.4. Strategic Developments
7.9.ROCKWOOL International A/S
7.9.1. Business Overview
7.9.2. Product Portfolio
7.9.3. Key Financials
7.9.4. Strategic Developments
7.10.Chongqing Polycomp International Corp
7.10.1.Business Overview
7.10.2.Product Portfolio
7.10.3.Strategic Developments
7.11.The Dow Chemical Company
7.11.1.Business Overview
7.11.2.Product Portfolio
7.11.3.Key Financials
7.11.4.Strategic Developments
7.12.Atlas Roofing Corporation
7.12.1.Business Overview
7.12.2.Product Portfolio
7.12.3.Strategic Developments
7.13.Owens Corning
7.13.1.Business Overview
7.13.2.Product Portfolio
7.13.3.Key Financials
7.13.4.Strategic Developments
7.14.Bayer AG
7.14.1.Business Overview
7.14.2.Product Portfolio
7.14.3.Key Financials
7.14.4.Strategic Developments
7.15.BASF Polyurethanes GmbH (Parent Organization: BASF SE)
7.15.1.Business Overview
7.15.2.Product Portfolio
7.15.3.Key Financials
7.15.4.Strategic Developments
List of Tables
Table 1.Insulation Market, By Product Type ($Million), 2017-2022
Table 2.Fiberglass Market, By Region ($Million), 2017-2022
Table 3.Plastic Foam Market, By Region ($Million), 2017-2022
Table 4.Mineral Wool Market, By Region ($Million), 2017-2022
Table 5.Other Product Types Market, By Region ($Million), 2017-2022
Table 6.Insulation Market, By Application ($Million), 2017-2022
Table 7.Residential Construction Market, By Region ($Million), 2017-2022
Table 8.Industrial, HVAC, and OEM Market, By Region ($Million), 2017-2022
Table 9.Nonresidential Construction Market, By Region ($Million), 2017-2022
Table 10.Insulation Market, By Region ($Million), 2017-2022
Table 11.North America Insulation Market, By Country, 2017-2022 ($Million)
Table 12.North America Insulation Market, By Product Type, 2017-2022 ($Million)
Table 13.North America Insulation Market, By Application, 2017-2022 ($Million)
Table 14.U.S. Insulation Market, By Product Type, 2017-2022 ($Million)
Table 15.U.S. Insulation Market, By Application, 2017-2022 ($Million)
Table 16.Canada Insulation Market, By Product Type, 2017-2022 ($Million)
Table 17.Canada Insulation Market, By Application, 2017-2022 ($Million)
Table 18.Mexico Insulation Market, By Product Type, 2017-2022 ($Million)
Table 19.Mexico Insulation Market, By Application, 2017-2022 ($Million)
Table 20.Europe Insulation Market, By Country, 2017-2022 ($Million)
Table 21.Europe Insulation Market, By Product Type, 2017-2022 ($Million)
Table 22.Europe Insulation Market, By Application, 2017-2022 ($Million)
Table 23.Germany Insulation Market, By Product Type, 2017-2022 ($Million)
Table 24.Germany Insulation Market, By Application, 2017-2022 ($Million)
Table 25.France Insulation Market, By Product Type, 2017-2022 ($Million)
Table 26.France Insulation Market, By Application, 2017-2022 ($Million)
Table 27.UK Insulation Market, By Product Type, 2017-2022 ($Million)
Table 28.UK Insulation Market, By Application, 2017-2022 ($Million)
Table 29.Italy Insulation Market, By Product Type, 2017-2022 ($Million)
Table 30.Italy Insulation Market, By Application, 2017-2022 ($Million)
Table 31.Spain Insulation Market, By Product Type, 2017-2022 ($Million)
Table 32.Spain Insulation Market, By Application, 2017-2022 ($Million)
Table 33.Russia Insulation Market, By Product Type, 2017-2022 ($Million)
Table 34.Russia Insulation Market, By Application, 2017-2022 ($Million)
Table 35.Rest of Europe Insulation Market, By Product Type, 2017-2022 ($Million)
Table 36.Rest of Europe Insulation Market, By Application, 2017-2022 ($Million)
Table 37.Asia-Pacific Insulation Market, By Country, 2017-2022 ($Million)
Table 38.Asia-Pacific Insulation Market, By Product Type, 2017-2022 ($Million)
Table 39.Asia-Pacific Insulation Market, By Application, 2017-2022 ($Million)
Table 40.Japan Insulation Market, By Product Type, 2017-2022 ($Million)
Table 41.Japan Insulation Market, By Application, 2017-2022 ($Million)
Table 42.China Insulation Market, By Product Type, 2017-2022 ($Million)
Table 43.China Insulation Market, By Application, 2017-2022 ($Million)
Table 44.Australia Insulation Market, By Product Type, 2017-2022 ($Million)
Table 45.Australia Insulation Market, By Application, 2017-2022 ($Million)
Table 46.India Insulation Market, By Product Type, 2017-2022 ($Million)
Table 47.India Insulation Market, By Application, 2017-2022 ($Million)
Table 48.South Korea Insulation Market, By Product Type, 2017-2022 ($Million)
Table 49.South Korea Insulation Market, By Application, 2017-2022 ($Million)
Table 50.Taiwan Insulation Market, By Product Type, 2017-2022 ($Million)
Table 51.Taiwan Insulation Market, By Application, 2017-2022 ($Million)
Table 52.Rest of Asia-Pacific Insulation Market, By Product Type, 2017-2022 ($Million)
Table 53.Rest of Asia-Pacific Insulation Market, By Application, 2017-2022 ($Million)
Table 54.Rest of the World Insulation Market, By Country, 2017-2022 ($Million)
Table 55.Rest of the World Insulation Market, By Product Type, 2017-2022 ($Million)
Table 56.Rest of the World Insulation Market, By Application, 2017-2022 ($Million)
Table 57.Brazil Insulation Market, By Product Type, 2017-2022 ($Million)
Table 58.Brazil Insulation Market, By Application, 2017-2022 ($Million)
Table 59.Turkey Insulation Market, By Product Type, 2017-2022 ($Million)
Table 60.Turkey Insulation Market, By Application, 2017-2022 ($Million)
Table 61.Saudi Arabia Insulation Market, By Product Type, 2017-2022 ($Million)
Table 62.Saudi Arabia Insulation Market, By Application, 2017-2022 ($Million)
Table 63.South Africa Insulation Market, By Product Type, 2017-2022 ($Million)
Table 64.South Africa Insulation Market, By Application, 2017-2022 ($Million)
Table 65.United Arab Emirates Insulation Market, By Product Type, 2017-2022 ($Million)
Table 66.United Arab Emirates Insulation Market, By Application, 2017-2022 ($Million)
Table 67.Others Insulation Market, By Product Type, 2017-2022 ($Million)
Table 68.Others Insulation Market, By Application, 2017-2022 ($Million)
Table 69.Guardian Building Products Inc.: Key Strategic Developments, 2017-2017
Table 70.GAF Materials Corporation: Key Strategic Developments, 2017-2017
Table 71.Johns Manville Corporation: Key Strategic Developments, 2017-2017
Table 72.Huntsman Corporation: Key Strategic Developments, 2017-2017
Table 73.NOVA Chemicals Corporation: Key Strategic Developments, 2017-2017
Table 74.Knauf Gips KG: Key Strategic Developments, 2017-2017
Table 75.Cellofoam North America Inc.: Key Strategic Developments, 2017-2017
Table 76.CertainTeed Corporation (Subsidiary of Saint-Gobain SA): Key Strategic Developments, 2017-2017
Table 77.ROCKWOOL International A/S: Key Strategic Developments, 2017-2017
Table 78.Chongqing Polycomp International Corp: Key Strategic Developments, 2017-2017
Table 79.The Dow Chemical Company: Key Strategic Developments, 2017-2017
Table 80.Atlas Roofing Corporation: Key Strategic Developments, 2017-2017
Table 81.Owens Corning: Key Strategic Developments, 2017-2017
Table 82.Bayer AG: Key Strategic Developments, 2017-2017
Table 83.BASF Polyurethanes GmbH (Parent Organization: BASF SE): Key Strategic Developments, 2017-2017
List of Figures
Figure 1.Insulation Market Share, By Product Type, 2017 & 2022 ($Million)
Figure 2.Insulation Market, By Application, 2017 & 2022 ($Million)
Figure 3.Insulation Market, By Region, 2017, ($Million)
Figure 4.Huntsman Corporation: Net Revenues, 2017-2017 ($Million)
Figure 5.Huntsman Corporation: Net Revenue Share, By Segment, 2017
Figure 6.Huntsman Corporation: Net Revenue Share, By Geography, 2017
Figure 7.NOVA Chemicals Corporation: Net Revenues, 2017-2017 ($Million)
Figure 8.NOVA Chemicals Corporation: Net Revenue Share, By Segment, 2017
Figure 9.NOVA Chemicals Corporation: Net Revenue Share, By Geography, 2017
Figure 10.CertainTeed Corporation (Subsidiary of Saint-Gobain SA): Net Revenues, 2017-2017 ($Million)
Figure 11.CertainTeed Corporation (Subsidiary of Saint-Gobain SA): Net Revenue Share, By Segment, 2017
Figure 12.CertainTeed Corporation (Subsidiary of Saint-Gobain SA): Net Revenue Share, By Geography, 2017
Figure 13.ROCKWOOL International A/S: Net Revenues, 2017-2017 ($Million)
Figure 14.ROCKWOOL International A/S: Net Revenue Share, By Segment, 2017
Figure 15.ROCKWOOL International A/S: Net Revenue Share, By Geography, 2017
Figure 16.The Dow Chemical Company: Net Revenues, 2017-2017 ($Million)
Figure 17.The Dow Chemical Company: Net Revenue Share, By Segment, 2017
Figure 18.The Dow Chemical Company: Net Revenue Share, By Geography, 2017
Figure 19.Owens Corning: Net Revenues, 2017-2017 ($Million)
Figure 20.Owens Corning: Net Revenue Share, By Segment, 2017
Figure 21.Owens Corning: Net Revenue Share, By Geography, 2017
Figure 22.Bayer AG: Net Revenues, 2017-2017 ($Million)
Figure 23.Bayer AG: Net Revenue Share, By Segment, 2017
Figure 24.Bayer AG: Net Revenue Share, By Geography, 2017
Figure 25.BASF Polyurethanes GmbH (Parent Organization: BASF SE): Net Revenues, 2017-2017 ($Million)
Figure 26.BASF Polyurethanes GmbH (Parent Organization: BASF SE): Net Revenue Share, By Segment, 2017
Figure 27.BASF Polyurethanes GmbH (Parent Organization: BASF SE): Net Revenue Share, By Geography, 2017
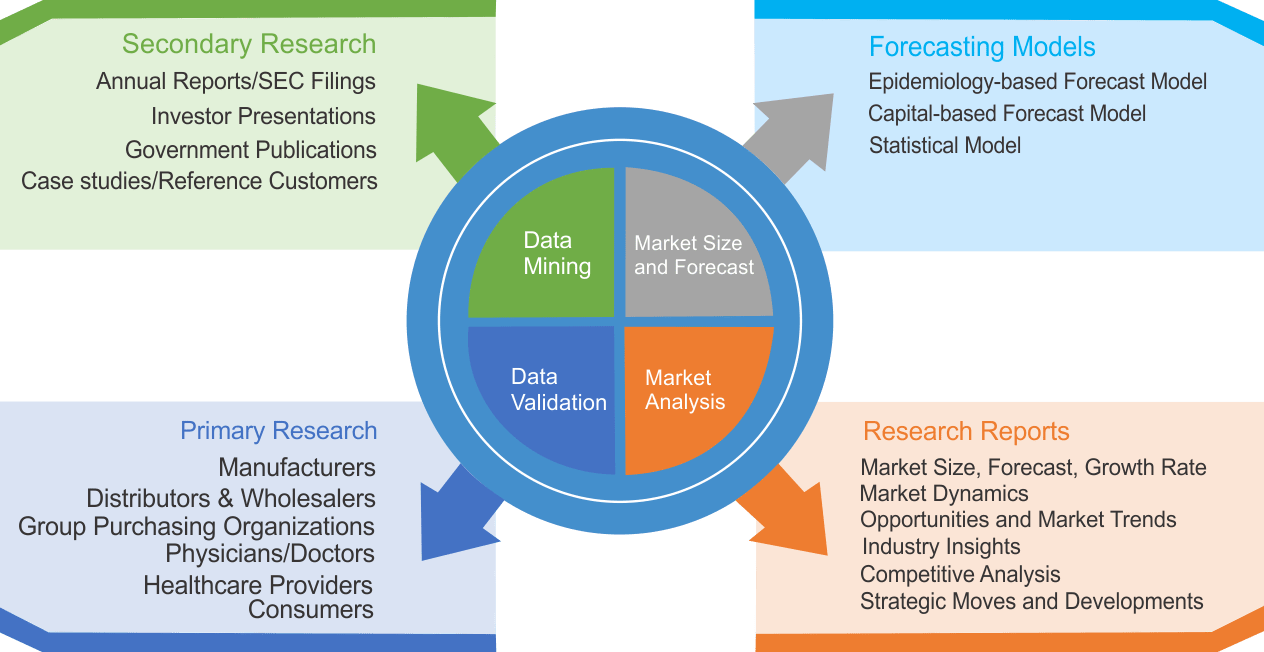
Research Methodology
We use both primary as well as secondary research for our market surveys, estimates and for developing forecast. Our research process commence by analyzing the problem which enable us to design the scope for our research study. Our research process is uniquely designed with enough flexibility to adjust according to changing nature of products and markets, while retaining core element to ensure reliability and accuracy in research findings. We understand both macro and micro-economic factors to evaluate and forecast different market segments.
Data Mining
Data is extensively collected through various secondary sources such as annual reports, investor presentations, SEC filings, and other corporate publications. We also refer trade magazines, technical journals, paid databases such as Factiva and Bloomberg, industry trade journals, scientific journals, and social media data to understand market dynamics and industry trends. Further, we also conduct primary research to understand market drivers, restraints, opportunities, challenges, and competitive scenario to build our analysis.
Data Collection Matrix
|
Data Collection Matrix |
Supply Side |
Demand Side |
|
Primary Data Sources |
|
|
|
Secondary Data Sources |
|
|
Market Modeling and Forecasting
We use epidemiology and capital equipment-based models to forecast market size of different segments at country and regional level.
- Epidemiology-based Forecasting Model: This method uses epidemiology data gathered through various publications and from physicians to estimate population of patients, flow of treatment of individual disease and therapies. The data collected through this method includes statics on incidence of disease, population suffering from disease, and treatment population. This method is used to understand:
- Number of patients for particular device or medical procedure and
- Repeated use of particular device depending on health and condition of patient
- Capital-based Forecasting Model: This method of forecasting is based on number of replacements, installed-based and new sales of capital equipment used in various healthcare and diagnostic centers. These three parameters are calculated and forecast is developed. Installation base is calculated as average number of units per facility; while sales for particular year is calculated from number of new and replace units. Secondary data is collected through various supply chain intermediaries and opinion leaders to arrive at installation and sales rate. These techniques help our analysts in validating market and developed market estimates and forecast.
We do forecast on basis of several parameters such as market drivers, market opportunities, industry trends government regulations, raw materials supply and trade dynamics to ensure relevance of forecast with market scenario. With increasing need to granulized information, we used bottom-up methodology for forecasting where we evaluate each regional segment differently and combined all forecast to develop final market forecast.
Data Validation
We believe primary research is a very important tool in analyzing and forecasting different markets. In order to make sure accuracy of our findings, our team conducts primary interviews at every stage of research to gain deep insights into current business environment and future trends and key developments in market. This includes use of various methods such as telephonic interviews, focus groups, face to face interviews and questionnaires to validate our research from all aspects. We validate our data through primary research from key industry leaders such as CEO, product managers, marketing managers, suppliers, distributors, and consumers are frequently interviewed. These interviews provide valuable insights which help us to have better market understanding besides validating our estimates and forecast.
Data Triangulation
Industry Analysis
|
Qualitative Data |
Quantitative Data (2017-2025) |
|
|