Infection Surveillance Solutions Market by Product and End User - Global Industry Analysis and Forecast to 2027
Published On : August 2017 Pages : 100 Category: Healthcare IT Report Code : HC08189
Industry Trend Analysis
The global infection surveillance solutions market is expected to be around $800 million by 2027. Increasing incidence of healthcare associated infections (HAIs) is a key driving factor for the growth of infection surveillance solutions market. Some of the common HAIs affecting patients in healthcare centers are surgical wound infections, respiratory tract infections, ventilator associated pneumonia and urinary tract infections. Increasing number of surgeries performed around the world and rising healthcare IT expenditure are some of the additional factors contributing to the growth of global infection surveillance solutions market. However, factors such as high cost of infection surveillance software and dearth of skilled professionals for operating such advanced systems can restrain the growth of infection surveillance solutions market during the forecast period.
Product Outlook and Trend Analysis
Software segment held a major share of the infection surveillance solutions market in 2017 as software solutions serve as effective mediums to efficiently manage patient data. Timely analysis and interpretation of such huge data is easily possible using software solutions. The services segment is expected to witness fastest growth during the forecast period as associated services for software solutions are gaining huge demand in order to ensure proper functioning of infection surveillance software solutions.
End User Outlook and Trend Analysis
In 2017, the large hospitals segment dominated the end user market for infection surveillance solutions owing to large scale adoption of infection surveillance systems by such hospitals. As these systems are priced on a higher end, large hospitals can easily afford these advanced systems. Moreover, with increase in the size of hospitals, the need for effective management of patient data also increases prompting the demand for adoption of complex infection surveillance solutions.
Regional Trend Analysis
North America held the largest share of the global infection surveillance solutions market in 2017. This dominance on a global level can be attributed to increasing healthcare expenditure in the region, rising incidence of HAIs and rapid advancements in information technology (IT). On the other hand, Asia-Pacific infection surveillance solutions market is expected to exhibit fastest growth during the forecast period owing to rising awareness related to HAIs, increasing availability of advanced healthcare facilities along with increasing medical tourism in emerging countries such as India and China.
Competitive Analysis
The major players operating in the global infection surveillance solutions market emphasize on product development in order to introduce advanced solutions in the market that are capable of processing large amount of complex data and deliver subsequent interpretations. Such product developments ensure sustainable presence for these players in the global market. For instance, in June 2022, RL Solutions, a Canada based Software Company involved in development of healthcare quality and safety software, announced updates to its RL6 infection surveillance software. These updates are designed to enable infection preventionists to proceed from reactive to proactive infection prevention. Some of the key players in the global infection surveillance solutions market are, Becton, Dickinson and Company, Wolters Kluwer N.V., Premier, Inc., Baxter International Inc., Atlas Development Corporation, GOJO Industries, Inc., HyGreen, Inc., Deb Group Limited (acquired by S.C. Johnson & Son, Inc.), Truven Health Analytics (Acquired by IBM), RL Solutions, Vigilanz Corporation, Quantros, Inc., bioMérieux, Inc., Cerner Corporation and PeraHealth.
Market Opportunities
The future growth opportunities for the global infection surveillance solutions market lie in development of next-generation solutions that are capable of integrating easily with other enterprise-wide systems such as Electronic Health Records (EHR) and other systems. With design and development of user friendly infection surveillance solutions, the market will witness robust growth over coming few years.
Infection Surveillance Solutions Market Segmentation:
By Product:
- Software
- Web-based Software
- On-premise Software
- Services
- Training & Consulting Services
- Product Support & Maintenance Services
- Implementation Services
By End User:
- Long-term Care Facilities
- Nursing Homes
- Homecare Agencies and Hospices
- Assisted Living Facilities
- Hospitals
- Small Hospitals
- Medium sized Hospitals
- Large Hospitals
By Region:
- North America
- U.S
- Canada
- Mexico
- Europe
- Germany
- France
- UK
- Italy
- Spain
- Rest of Europe
- Asia-Pacific
- Japan
- China
- Australia
- India
- South Korea
- Rest of Asia-Pacific
- Rest of the World
- Brazil
- South Africa
- Saudi Arabia
- Turkey
- United Arab Emirates
- Others
Some of the key questions answered by the report are:
- What was the market size in 2017 and forecast from 2022 to 2027?
- What will be the industry market growth from 2022 to 2027?
- What are the major drivers, restraints, opportunities, challenges, and industry trends and their impact on the market forecast?
- What are the major segments leading the market growth and why?
- Which are the leading players in the market and what are the major strategies adopted by them to sustain the market competition?
Market Classification
- Infection Surveillance Solutions Market, By Product, Estimates and Forecast, 2017-2027 ($Million)
- Software
- Web-based
- On-premise
- Services
- Training & Consulting Services
- Implementation Services
- Infection Surveillance Solutions Market, By End User, Estimates and Forecast, 2017-2027 ($Million)
- Long-term Care Facilities
- Nursing Homes
- Homecare Agencies and Hospices
- Assisted Living Facilities
- Hospitals
- Small Hospitals
- Medium sized Hospitals
- Large Hospitals
- Infection Surveillance Solutions Market, By Region, Estimates and Forecast, 2017-2027 ($Million)
- North America
- North America Infection Surveillance Solutions Market, By Country
- North America Infection Surveillance Solutions Market, By Product
- North America Infection Surveillance Solutions Market, By End User
- U.S. Infection Surveillance Solutions Market, By Product
- U.S. Infection Surveillance Solutions Market, By End User
- Canada Infection Surveillance Solutions Market, By Product
- Canada Infection Surveillance Solutions Market, By End User
- Mexico Infection Surveillance Solutions Market, By Product
- Mexico Infection Surveillance Solutions Market, By End User
-
- Europe
- Europe Infection Surveillance Solutions Market, By Country
- Europe Infection Surveillance Solutions Market, By Product
- Europe Infection Surveillance Solutions Market, By End User
- Germany Infection Surveillance Solutions Market, By Product
- Germany Infection Surveillance Solutions Market, By End User
- France Infection Surveillance Solutions Market, By Product
- France Infection Surveillance Solutions Market, By End User
- UK Infection Surveillance Solutions Market, By Product
- UK Infection Surveillance Solutions Market, By End User
- Italy Infection Surveillance Solutions Market, By Product
- Italy Infection Surveillance Solutions Market, By End User
- Spain Infection Surveillance Solutions Market, By Product
- Spain Infection Surveillance Solutions Market, By End User
- Rest of Europe Infection Surveillance Solutions Market, By Product
- Rest of Europe Infection Surveillance Solutions Market, By End User
-
- Asia-Pacific
- Asia-Pacific Infection Surveillance Solutions Market, By Country
- Asia-Pacific Infection Surveillance Solutions Market, By Product
- Asia-Pacific Infection Surveillance Solutions Market, By End User
- Japan Infection Surveillance Solutions Market, By Product
- Japan Infection Surveillance Solutions Market, By End User
- Australia Infection Surveillance Solutions Market, By Product
- Australia Infection Surveillance Solutions Market, By End User
- India Infection Surveillance Solutions Market, By Product
- India Infection Surveillance Solutions Market, By End User
- South Korea Infection Surveillance Solutions Market, By Product
- South Korea Infection Surveillance Solutions Market, By End User
- Rest of Asia-Pacific Infection Surveillance Solutions Market, By Product
- Rest of Asia-Pacific Infection Surveillance Solutions Market, By End User
- Asia-Pacific
-
- Rest of the World
- Rest of the World Infection Surveillance Solutions Market, By Country
- Rest of the World Infection Surveillance Solutions Market, By Product
- Rest of the World Infection Surveillance Solutions Market, By End User
- Brazil Infection Surveillance Solutions Market, By Product
- Brazil Infection Surveillance Solutions Market, By End User
- South Africa Infection Surveillance Solutions Market, By Product
- South Africa Infection Surveillance Solutions Market, By End User
- Saudi Arabia Infection Surveillance Solutions Market, By Product
- Saudi Arabia Infection Surveillance Solutions Market, By End User
- Turkey Infection Surveillance Solutions Market, By Product
- Turkey Infection Surveillance Solutions Market, By End User
- United Arab Emirates Infection Surveillance Solutions Market, By Product
- United Arab Emirates Infection Surveillance Solutions Market, By End User
- Others Infection Surveillance Solutions Market, By Product
- Others Infection Surveillance Solutions Market, By End User
- Rest of the World
Table of Contents
1. Introduction
1.1. Report Description
1.2. Research Methodology
1.2.1. Secondary Research
1.2.2. Primary Research
2. Executive Summary
2.1. Key Highlights
3. Market Overview
3.1. Introduction
3.1.1. Market Definition
3.1.2. Market Segmentation
3.2. Market Share Analysis
3.3. Market Dynamics
3.3.1. Drivers
3.3.1.1. Increasing Incidence of Healthcare-associated Infections (HAIs)
3.3.1.2. Increasing Healthcare Expenditure
3.3.1.3. Advancements in Healthcare IT
3.3.2. Restraints
3.3.2.1. High Cost of Infection Surveillance Solutions
3.3.2.2. Dearth of Skilled Professionals to Operate Infection Surveillance Software
3.3.3. Opportunities
3.3.3.1. Design and Development of Next-generation Infection Surveillance Software
4. Infection Surveillance Solutions Market, By Product
4.1. Introduction
4.2. Infection Surveillance Solutions market Assessment and Forecast, By Product, 2017-2027
4.3. Software
4.3.1. Market Assessment and Forecast, By Type, 2017-2027 ($Million)
4.3.2. Market Assessment and Forecast, By Region, 2017-2027 ($Million)
4.3.3. Web-based Software
4.3.3.1. Market Assessment and Forecast, By Region, 2017-2027 ($Million)
4.3.4. On-premise Software
4.3.4.1. Market Assessment and Forecast, By Region, 2017-2027 ($Million)
4.4. Services
4.4.1. Market Assessment and Forecast, By Type, 2017-2027 ($Million)
4.4.2. Market Assessment and Forecast, By Region, 2017-2027 ($Million)
4.4.2.1. Training & Consulting Services
4.4.2.1.1. Market Assessment and Forecast, By Region, 2017-2027 ($Million)
4.4.2.2. Product Support & Maintenance Services
4.4.2.2.1. Market Assessment and Forecast, By Region, 2017-2027 ($Million)
4.4.2.3. Implementation Services
4.4.2.4. Market Assessment and Forecast, By Region, 2017-2027 ($Million)
5. Infection Surveillance Solutions Market, By End User
5.1. Introduction
5.2. Infection Surveillance Solutions market Assessment and Forecast, By End User, 2017-2027
5.2.1. Long-term Care Facilities
5.2.1.1. Market Assessment and Forecast, By Type, 2017-2027 ($Million)
5.2.1.2. Market Assessment and Forecast, By Region, 2017-2027 ($Million)
5.2.1.3. Nursing Homes
5.2.1.3.1. Market Assessment and Forecast, By Region, 2017-2027 ($Million)
5.2.1.4. Homecare Agencies and Hospices
5.2.1.4.1. Market Assessment and Forecast, By Region, 2017-2027 ($Million)
5.2.1.5. Assisted Living Facilities
5.2.1.5.1. Market Assessment and Forecast, By Region, 2017-2027 ($Million)
5.2.2. Hospitals
5.2.2.1. Market Assessment and Forecast, By Type, 2017-2027 ($Million)
5.2.2.2. Market Assessment and Forecast, By Region, 2017-2027 ($Million)
5.2.2.3. Small Hospitals
5.2.2.3.1. Market Assessment and Forecast, By Region, 2017-2027 ($Million)
5.2.2.4. Medium sized Hospitals
5.2.2.4.1. Market Assessment and Forecast, By Region, 2017-2027 ($Million)
5.2.2.5. Large Hospitals
5.2.2.6. Market Assessment and Forecast, By Region, 2017-2027 ($Million)
6. Infection Surveillance Solutions Market, By Region
6.1. Introduction
6.2. Infection Surveillance Solutions Market Assessment and Forecast, By Product, 2017-2027 ($Million)
6.3. Infection Surveillance Solutions Market Assessment and Forecast, By End User, 2017-2027 ($Million)
6.4. North America
6.4.1. Market Assessment and Forecast, By Country, 2017-2027 ($Million)
6.4.2. Market Assessment and Forecast, By Product, 2017-2027 ($Million)
6.4.3. Market Assessment and Forecast, By End User, 2017-2027 ($Million)
6.4.3.1. U.S.
6.4.3.1.1. Market Assessment and Forecast, By Product, 2017-2027 ($Million)
6.4.3.1.2. Market Assessment and Forecast, By End User, 2017-2027 ($Million)
6.4.3.2. Canada
6.4.3.2.1. Market Assessment and Forecast, By Product, 2017-2027 ($Million)
6.4.3.2.2. Market Assessment and Forecast, By End User, 2017-2027 ($Million)
6.4.3.3. Mexico
6.4.3.3.1. Market Assessment and Forecast, By Product, 2017-2027 ($Million)
6.4.3.3.2. Market Assessment and Forecast, By End User, 2017-2027 ($Million)
6.5. Europe
6.5.1. Market Assessment and Forecast, By Country, 2017-2027 ($Million)
6.5.2. Market Assessment and Forecast, By Product, 2017-2027 ($Million)
6.5.3. Market Assessment and Forecast, By End User, 2017-2027 ($Million)
6.5.3.1. Germany
6.5.3.1.1. Market Assessment and Forecast, By Product, 2017-2027 ($Million)
6.5.3.1.2. Market Assessment and Forecast, By End User, 2017-2027 ($Million)
6.5.3.2. France
6.5.3.2.1. Market Assessment and Forecast, By Product, 2017-2027 ($Million)
6.5.3.2.2. Market Assessment and Forecast, By Product, 2017-2027 ($Million)
6.5.3.3. UK
6.5.3.3.1. Market Assessment and Forecast, By Product, 2017-2027 ($Million)
6.5.3.3.2. Market Assessment and Forecast, By End User, 2017-2027 ($Million)
6.5.3.4. Italy
6.5.3.4.1. Market Assessment and Forecast, By Product, 2017-2027 ($Million)
6.5.3.4.2. Market Assessment and Forecast, By End User, 2017-2027 ($Million)
6.5.3.5. Spain
6.5.3.5.1. Market Assessment and Forecast, By Product, 2017-2027 ($Million)
6.5.3.5.2. Market Assessment and Forecast, By End User, 2017-2027 ($Million)
6.5.3.6. Russia
6.5.3.6.1. Market Assessment and Forecast, By Product, 2017-2027 ($Million)
6.5.3.6.2. Market Assessment and Forecast, By End User, 2017-2027 ($Million)
6.5.3.7. Rest of Europe
6.5.3.7.1. Market Assessment and Forecast, By Product, 2017-2027 ($Million)
6.5.3.7.2. Market Assessment and Forecast, By End User, 2017-2027 ($Million)
6.6. Asia-Pacific
6.6.1. Market Assessment and Forecast, By Country, 2017-2027 ($Million)
6.6.2. Market Assessment and Forecast, By Product, 2017-2027 ($Million)
6.6.3. Market Assessment and Forecast, By End User, 2017-2027 ($Million)
6.6.3.1. Japan
6.6.3.1.1. Market Assessment and Forecast, By Product, 2017-2027 ($Million)
6.6.3.1.2. Market Assessment and Forecast, By End User, 2017-2027 ($Million)
6.6.3.2. China
6.6.3.2.1. Market Assessment and Forecast, By Product, 2017-2027 ($Million)
6.6.3.2.2. Market Assessment and Forecast, By End User, 2017-2027 ($Million)
6.6.3.3. Australia
6.6.3.3.1. Market Assessment and Forecast, By Product, 2017-2027 ($Million)
6.6.3.3.2. Market Assessment and Forecast, By End User, 2017-2027 ($Million)
6.6.3.4. India
6.6.3.4.1. Market Assessment and Forecast, By Product, 2017-2027 ($Million)
6.6.3.4.2. Market Assessment and Forecast, By End User, 2017-2027 ($Million)
6.6.3.5. South Korea
6.6.3.5.1. Market Assessment and Forecast, By Product, 2017-2027 ($Million)
6.6.3.5.2. Market Assessment and Forecast, By End User, 2017-2027 ($Million)
6.6.3.6. Taiwan
6.6.3.6.1. Market Assessment and Forecast, By Product, 2017-2027 ($Million)
6.6.3.6.2. Market Assessment and Forecast, By End User, 2017-2027 ($Million)
6.6.3.7. Rest of Asia-Pacific
6.6.3.7.1. Market Assessment and Forecast, By Product, 2017-2027 ($Million)
6.6.3.7.2. Market Assessment and Forecast, By End User, 2017-2027 ($Million)
6.7. Rest of the World
6.7.1. Market Assessment and Forecast, By Country, 2017-2027 ($Million)
6.7.2. Market Assessment and Forecast, By Product, 2017-2027 ($Million)
6.7.3. Market Assessment and Forecast, By End User, 2017-2027 ($Million)
6.7.3.1. Brazil
6.7.3.1.1. Market Assessment and Forecast, By Product, 2017-2027 ($Million)
6.7.3.1.2. Market Assessment and Forecast, By End User, 2017-2027 ($Million)
6.7.3.2. Turkey
6.7.3.2.1. Market Assessment and Forecast, By Product, 2017-2027 ($Million)
6.7.3.2.2. Market Assessment and Forecast, By End User, 2017-2027 ($Million)
6.7.3.3. Saudi Arabia
6.7.3.3.1. Market Assessment and Forecast, By Product, 2017-2027 ($Million)
6.7.3.3.2. Market Assessment and Forecast, By End User, 2017-2027 ($Million)
6.7.3.4. South Africa
6.7.3.4.1. Market Assessment and Forecast, By Product, 2017-2027 ($Million)
6.7.3.4.2. Market Assessment and Forecast, By End User, 2017-2027 ($Million)
6.7.3.5. United Arab Emirates
6.7.3.5.1. Market Assessment and Forecast, By Product, 2017-2027 ($Million)
6.7.3.5.2. Market Assessment and Forecast, By End User, 2017-2027 ($Million)
6.7.3.6. Others
6.7.3.6.1. Market Assessment and Forecast, By Product, 2017-2027 ($Million)
6.7.3.6.2. Market Assessment and Forecast, By End User, 2017-2027 ($Million)
7. Company Profiles
7.1. Becton, Dickinson and Company
7.1.1. Business Overview
7.1.2. Product Portfolio
7.1.3. Key Financials
7.1.4. Strategic Developments
7.2. Wolters Kluwer N.V.
7.2.1. Business Overview
7.2.2. Product Portfolio
7.2.3. Key Financials
7.2.4. Strategic Developments
7.3. Premier, Inc.
7.3.1. Business Overview
7.3.2. Product Portfolio
7.3.3. Key Financials
7.3.4. Strategic Developments
7.4. Baxter International Inc.
7.4.1. Business Overview
7.4.2. Product Portfolio
7.4.3. Key Financials
7.4.4. Strategic Developments
7.5. Atlas Development Corporation
7.5.1. Business Overview
7.5.2. Product Portfolio
7.5.3. Strategic Developments
7.6. GOJO Industries, Inc.
7.6.1. Business Overview
7.6.2. Product Portfolio
7.6.3. Strategic Developments
7.7. HyGreen, Inc.
7.7.1. Business Overview
7.7.2. Product Portfolio
7.7.3. Strategic Developments
7.8. Deb Group Limited (acquired by S.C. Johnson & Son, Inc.)
7.8.1. Business Overview
7.8.2. Product Portfolio
7.8.3. Strategic Developments
7.9. Truven Health Analytics (Acquired by IBM)
7.9.1. Business Overview
7.9.2. Product Portfolio
7.9.3. Key Financials
7.9.4. Strategic Developments
7.10. RL Solutions
7.10.1. Business Overview
7.10.2. Product Portfolio
7.10.3. Strategic Developments
7.11. Vigilanz Corporation
7.11.1. Business Overview
7.11.2. Product Portfolio
7.11.3. Strategic Developments
7.12. Quantros, Inc.
7.12.1. Business Overview
7.12.2. Product Portfolio
7.12.3. Strategic Developments
7.13. bioMérieux, Inc.
7.13.1. Business Overview
7.13.2. Product Portfolio
7.13.3. Key Financials
7.13.4. Strategic Developments
7.14. PeraHealth
7.14.1. Business Overview
7.14.2. Product Portfolio
7.14.3. Strategic Developments
7.15. Cerner Corporation
7.15.1. Business Overview
7.15.2. Product Portfolio
7.15.3. Strategic Developments
List of Tables
Table 1.Infection Surveillance Solutions Market, By Product ($Million), 2017-2025
Table 2.Software Market, By Type ($Million), 2017-2025
Table 3.Software Market, By Region ($Million), 2017-2025
Table 4.Web-based Software Market, By Region ($Million), 2017-2025
Table 5.On-premise Software Market, By Region ($Million), 2017-2025
Table 6.Services Market, By Type ($Million), 2017-2025
Table 7.Services Market, By Region ($Million), 2017-2025
Table 8.Training & Consulting Services Market, By Region ($Million), 2017-2025
Table 9.Product Support & Maintenance Services Market, By Region ($Million), 2017-2025
Table10.Implementation Services Market, By Region ($Million), 2017-2025
Table 11.Infection Surveillance Solutions Market, By End User ($Million), 2017-2025
Table 12.Long-term Care Facilities Market, By Type ($Million), 2017-2025
Table 13.Long-term Care Facilities Market, By Region ($Million), 2017-2025
Table 14.Nursing Homes Market, By Region ($Million), 2017-2025
Table 15.Homecare Agencies and Hospices Market, By Region, 2017-2025 ($Million)
Table 16.Assisted Living Facilities Market, By Region, 2017-2025 ($Million)
Table 17.Hospitals Market, By Type ($Million), 2017-2025
Table 18.Hospitals Market, By Region ($Million), 2017-2025
Table 19.Small Hospitals Market, By Region ($Million), 2017-2025
Table 20.Medium sized Hospitals Market, By Region, 2017-2025 ($Million)
Table 21.Large Hospitals Market, By Region, 2017-2025 ($Million)
Table 22.Infection Surveillance Solutions Market, By Region ($Million), 2017-2025
Table 23.North America Infection Surveillance Solutions Market, By Country, 2017-2025 ($Million)
Table 24.North America Infection Surveillance Solutions Market, By Product, 2017-2025 ($Million)
Table 25.North America Infection Surveillance Solutions Market, By End User, 2017-2025 ($Million)
Table 26.U.S. Infection Surveillance Solutions Market, by Product, 2017-2025 ($Million)
Table 27.U.S. Infection Surveillance Solutions Market, by End User, 2017-2025 ($Million)
Table 28.Canada Infection Surveillance Solutions Market, By Product, 2017-2025 ($Million)
Table 29.Canada Infection Surveillance Solutions Market, By End User, 2017-2025 ($Million)
Table 30.Mexico Infection Surveillance Solutions Market, By Product, 2017-2025 ($Million)
Table 31.Mexico Infection Surveillance Solutions Market, By End User, 2017-2025 ($Million)
Table 32.Europe Infection Surveillance Solutions Market, By Country, 2017-2025 ($Million)
Table 33.Europe Infection Surveillance Solutions Market, By Product, 2017-2025 ($Million)
Table 34.Europe Infection Surveillance Solutions Market, By End User, 2017-2025 ($Million)
Table 35.Germany Infection Surveillance Solutions Market, By Product, 2017-2025 ($Million)
Table 36.Germany Infection Surveillance Solutions Market, By End User, 2017-2025 ($Million)
Table 37.France Infection Surveillance Solutions Market, By Product, 2017-2025 ($Million)
Table 38.France Infection Surveillance Solutions Market, By End User, 2017-2025 ($Million)
Table 39.UK Infection Surveillance Solutions Market, By Product, 2017-2025 ($Million)
Table 40.UK Infection Surveillance Solutions Market, By End User, 2017-2025 ($Million)
Table 41.Italy Infection Surveillance Solutions Market, By Product, 2017-2025 ($Million)
Table 42.Italy Infection Surveillance Solutions Market, By End User, 2017-2025 ($Million)
Table 43.Spain Infection Surveillance Solutions Market, By Product, 2017-2025 ($Million)
Table 44.Spain Infection Surveillance Solutions Market, By End User, 2017-2025 ($Million)
Table 45.Russia Infection Surveillance Solutions Market, By Product, 2017-2025 ($Million)
Table 46.Russia Infection Surveillance Solutions Market, By End User, 2017-2025 ($Million)
Table 47.Rest of Europe Infection Surveillance Solutions Market, By Product, 2017-2025 ($Million)
Table 48.Rest of Europe Infection Surveillance Solutions Market, By End User, 2017-2025 ($Million)
Table 49.Asia-Pacific Infection Surveillance Solutions Market, By Country, 2017-2025 ($Million)
Table 50.Asia-Pacific Infection Surveillance Solutions Market, By Product, 2017-2025 ($Million)
Table 51.Asia-Pacific Infection Surveillance Solutions Market, By End User, 2017-2025 ($Million)
Table 52.Japan Infection Surveillance Solutions Market, By Product, 2017-2025 ($Million)
Table 53.Japan Infection Surveillance Solutions Market, By End User, 2017-2025 ($Million)
Table 54.China Infection Surveillance Solutions Market, By Product, 2017-2025 ($Million)
Table 55.China Infection Surveillance Solutions Market, By End User, 2017-2025 ($Million)
Table 56.Australia Infection Surveillance Solutions Market, By Product, 2017-2025 ($Million)
Table 57.Australia Infection Surveillance Solutions Market, By End User, 2017-2025 ($Million)
Table 58.India Infection Surveillance Solutions Market, By Product, 2017-2025 ($Million)
Table 59.India Infection Surveillance Solutions Market, By End User, 2017-2025 ($Million)
Table 60.South Korea Infection Surveillance Solutions Market, By Product, 2017-2025 ($Million)
Table 61.South Korea Infection Surveillance Solutions Market, By End User, 2017-2025 ($Million)
Table 62.Taiwan Infection Surveillance Solutions Market, By Product, 2017-2025 ($Million)
Table 63.Taiwan Infection Surveillance Solutions Market, By End User, 2017-2025 ($Million)
Table 64.Rest of Asia-Pacific Infection Surveillance Solutions Market, By Product, 2017-2025 ($Million)
Table 65.Rest of Asia-Pacific Infection Surveillance Solutions Market, By End User, 2017-2025 ($Million)
Table 66.Rest of the World Infection Surveillance Solutions Market, By Country, 2017-2025 ($Million)
Table 67.Rest of the World Infection Surveillance Solutions Market, By Product, 2017-2025 ($Million)
Table 68.Rest of the World Infection Surveillance Solutions Market, By End User, 2017-2025 ($Million)
Table 69.Brazil Infection Surveillance Solutions Market, By Product, 2017-2025 ($Million)
Table 70.Brazil Infection Surveillance Solutions Market, By End User, 2017-2025 ($Million)
Table 71.Turkey Infection Surveillance Solutions Market, By Product, 2017-2025 ($Million)
Table 72.Turkey Infection Surveillance Solutions Market, By End User, 2017-2025 ($Million)
Table 73.Saudi Arabia Infection Surveillance Solutions Market, By Product, 2017-2025 ($Million)
Table 74.Saudi Arabia Infection Surveillance Solutions Market, By End User, 2017-2025 ($Million)
Table 75.South Africa Infection Surveillance Solutions Market, By Product, 2017-2025 ($Million)
Table 76.South Africa Infection Surveillance Solutions Market, By End User, 2017-2025 ($Million)
Table 77.United Arab Emirates Infection Surveillance Solutions Market, By Product, 2017-2025 ($Million)
Table 78.United Arab Emirates Infection Surveillance Solutions Market, By End User, 2017-2025 ($Million)
Table 79.Others Infection Surveillance Solutions Market, By Product, 2017-2025 ($Million)
Table 80.Others Infection Surveillance Solutions Market, By End User, 2017-2025 ($Million)
Table 81.Becton, Dickinson and Company: Key Strategic Developments, 2017-2017
Table 82.Wolters Kluwer N.V.: Key Strategic Developments, 2017-2017
Table 83.Premier, Inc.: Key Strategic Developments, 2017-2017
Table 84.Baxter International Inc.: Key Strategic Developments, 2017-2017
Table 85.Cerner Corporation: Key Strategic Developments, 2017-2017
Table 86. Atlas Development Corporation: Key Strategic Developments, 2017-2017
Table 87.GOJO Industries, Inc.: Key Strategic Developments, 2017-2017
Table 88.HyGreen, Inc.: Key Strategic Developments, 2017-2017
Table 89.Deb Group Limited: Key Strategic Developments, 2017-2017
Table 90.Vigilanz Corporation: Key Strategic Developments, 2017-2017
Table 91.Quantros, Inc.: Key Strategic Developments, 2017-2017
Table 92.Truven Health Analytics: Key Strategic Developments, 2017-2017
Table 93.RL Solutions: Key Strategic Developments, 2017-2017
Table 94.bioMérieux, Inc.: Key Strategic Developments, 2017-2017
Table 95.PeraHealth: Key Strategic Developments, 2017-2017
List of Figures
Figure 1.Infection surveillance solutions Market Share, By Product, 2017 & 2025
Figure 2.Infection surveillance solutions Market, By End User, 2017, ($Million)
Figure 3.Infection surveillance solutions Market, By Region, 2017, ($Million)
Figure 4.Becton, Dickinson and Company: Net Revenues, 2017-2017 ($Million)
Figure 5 Becton, Dickinson and Company: Net Revenue Share, By Segment, 2017
Figure 6.Becton, Dickinson and Company: Net Revenue Share, By Geography, 2017
Figure 7.Wolters Kluwer N.V.: Net Revenues, 2017-2017 ($Million)
Figure 8.Wolters Kluwer N.V.: Net Revenue Share, By Segment, 2017
Figure 9.Wolters Kluwer N.V.: Net Revenue Share, By Geography, 2017
Figure 10.Premier, Inc.: Net Revenues, 2017-2017 ($Million)
Figure 11.Premier, Inc.: Net Revenue Share, By Segment, 2017
Figure 12.Premier, Inc.: Net Revenue Share, By Geography, 2017
Figure 13.Baxter International Inc.: Net Revenues, 2017-2017 ($Million)
Figure 14.Baxter International Inc.: Net Revenue Share, By Segment, 2017
Figure 15.Baxter International Inc. Net Revenue Share, By Geography, 2017
Figure 16.International Business Machines Corporation (IBM): Net Revenues, 2017-2017 ($Million)
Figure 17.International Business Machines Corporation (IBM): Net Revenue Share, By Segment, 2017
Figure 18.International Business Machines Corporation (IBM): Net Revenue Share, By Geography, 2017
Figure 19.bioMérieux, Inc.: Net Revenues, 2017-2017 ($Million)
Figure 20.bioMérieux, Inc.: Net Revenue Share, By Segment, 2017
Figure 21.bioMérieux, Inc.: Net Revenue Share, By Geography, 2017
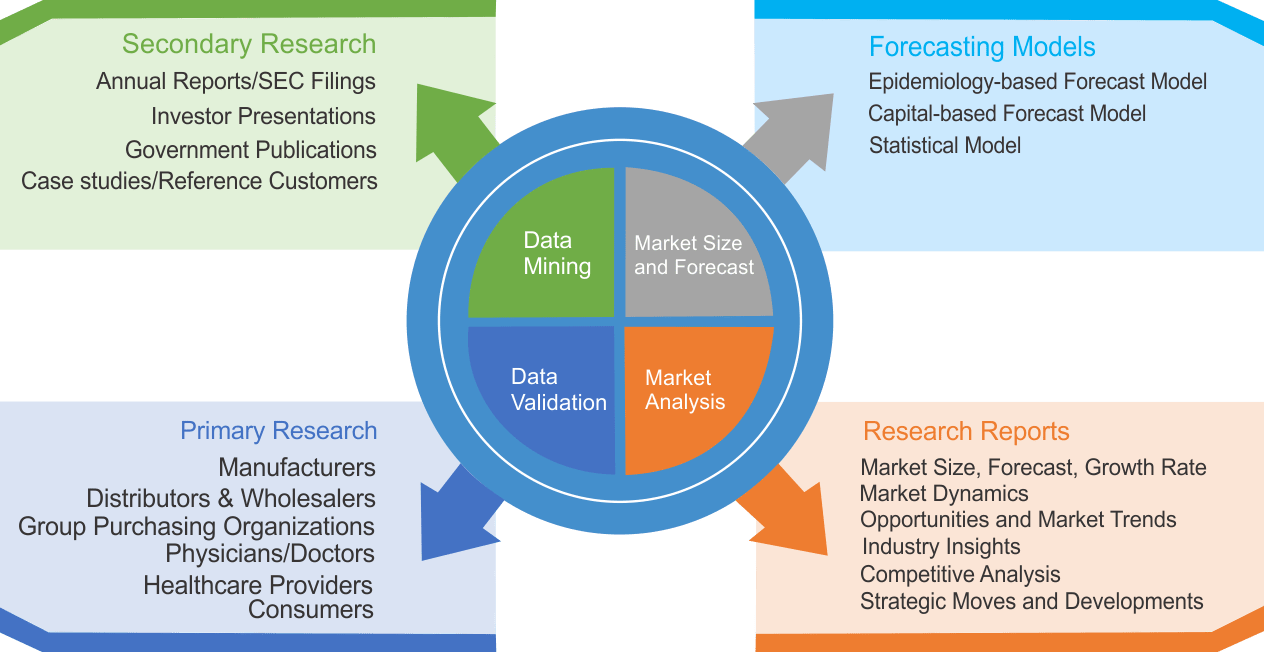
Research Methodology
We use both primary as well as secondary research for our market surveys, estimates and for developing forecast. Our research process commence by analyzing the problem which enable us to design the scope for our research study. Our research process is uniquely designed with enough flexibility to adjust according to changing nature of products and markets, while retaining core element to ensure reliability and accuracy in research findings. We understand both macro and micro-economic factors to evaluate and forecast different market segments.
Data Mining
Data is extensively collected through various secondary sources such as annual reports, investor presentations, SEC filings, and other corporate publications. We also refer trade magazines, technical journals, paid databases such as Factiva and Bloomberg, industry trade journals, scientific journals, and social media data to understand market dynamics and industry trends. Further, we also conduct primary research to understand market drivers, restraints, opportunities, challenges, and competitive scenario to build our analysis.
Data Collection Matrix
|
Data Collection Matrix |
Supply Side |
Demand Side |
|
Primary Data Sources |
|
|
|
Secondary Data Sources |
|
|
Market Modeling and Forecasting
We use epidemiology and capital equipment-based models to forecast market size of different segments at country and regional level.
- Epidemiology-based Forecasting Model: This method uses epidemiology data gathered through various publications and from physicians to estimate population of patients, flow of treatment of individual disease and therapies. The data collected through this method includes statics on incidence of disease, population suffering from disease, and treatment population. This method is used to understand:
- Number of patients for particular device or medical procedure and
- Repeated use of particular device depending on health and condition of patient
- Capital-based Forecasting Model: This method of forecasting is based on number of replacements, installed-based and new sales of capital equipment used in various healthcare and diagnostic centers. These three parameters are calculated and forecast is developed. Installation base is calculated as average number of units per facility; while sales for particular year is calculated from number of new and replace units. Secondary data is collected through various supply chain intermediaries and opinion leaders to arrive at installation and sales rate. These techniques help our analysts in validating market and developed market estimates and forecast.
We do forecast on basis of several parameters such as market drivers, market opportunities, industry trends government regulations, raw materials supply and trade dynamics to ensure relevance of forecast with market scenario. With increasing need to granulized information, we used bottom-up methodology for forecasting where we evaluate each regional segment differently and combined all forecast to develop final market forecast.
Data Validation
We believe primary research is a very important tool in analyzing and forecasting different markets. In order to make sure accuracy of our findings, our team conducts primary interviews at every stage of research to gain deep insights into current business environment and future trends and key developments in market. This includes use of various methods such as telephonic interviews, focus groups, face to face interviews and questionnaires to validate our research from all aspects. We validate our data through primary research from key industry leaders such as CEO, product managers, marketing managers, suppliers, distributors, and consumers are frequently interviewed. These interviews provide valuable insights which help us to have better market understanding besides validating our estimates and forecast.
Data Triangulation
Industry Analysis
|
Qualitative Data |
Quantitative Data (2017-2025) |
|
|