Home Healthcare Market By Component - Global Industry Analysis and Forecast to 2022
Published On : November 2017 Pages : 160 Category: Medical Devices Report Code : HC11321
Industry Trend Analysis
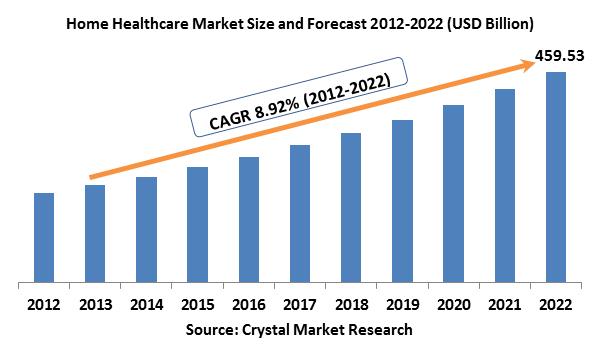
The global home healthcare market was evaluated around USD 195.55 billion in the 2017 and is expected to reach approximately USD 459.53 billion by the end of 2022 while registering itself at a compound annual growth rate (CAGR) of 8.92% over the forecast period. Increasing treatment price is amongst the biggest areas of concern for health organizations and government, and these organizations are determined to control rising healthcare expenditure. Home healthcare is a cost-effective option as compared to costly hospital stays. These services assist to save cost considerably, therefore, expected to act as high impact delivering factor for the global home healthcare industry. Rising workforce concerning to these services interprets the growing home healthcare services demand. According to the statistics released by the United States Bureau of Labor Statistics, the position of home care and personal care aids are projected to rise approximately 13.0 million by the end of 2021, which interprets to around 70.0% boost from 2017. Rising aged population is amongst the major driving factor for the profitable growth of the global market. This population is inclined towards the chronic illnesses which need long-term care. Hence, home healthcare presents best potential option rendering inexpensive quality care. The founding and maintenance of healthcare centers and other settings are investment demanding in nature and involve huge investments concerning operational expenses and capital. Thus, healthcare providers are now penetrating the rapidly emerging home healthcare market with the help of mergers and acquisitions in order to gain benefit from the existing opportunities and restrain expenditure.
Component Outlook and Trend Analysis
In 2017, diagnostics equipment reported for over 35.0% of the total home healthcare equipment industry, and is anticipated to achieve market share around the projected period, due to rising occurrence of cardiovascular, cardiopulmonary and diabetes diseases, also enhanced awareness levels among patients, rising incidence of long-term diseases demanding continuous diagnosis and elevated application rates of fertility and pregnancy tests and BP monitors. In 2017, rehabilitation services reported for around 50.0% of the global home healthcare service market mostly due to rising geriatric population and increasing occurrence rates of surgical procedures concerning to trauma. On the other hand, owing to increasing demand for parenteral and enteral nutrition, infusion therapy is anticipated to achieve market share over the forecast years.
Regional Outlook and Trend Analysis
North American regional market held the major revenue share in 2017 at around 40.0% due to the existence of advance healthcare infrastructure, elevated awareness levels among patient along with moderately higher medical spending levels in this region. Asia Pacific regional market is expected to witness beneficial growth during the forecast years. Developing economy rectifies to develop infrastructure, high unfulfilled requirements of massive population and accessibility skilled labor likely to administer the development of the region.
Competitive Outlook and Trend Analysis
The major market players in global home healthcare market include B. Braun Melsungen AG, Almost Family Inc., Abbott Laboratories, 3M Health Care, Sunrise Medical Inc., Baxter, Cardinal Health Inc., Medtronic, National Healthcare crop., Air Liquide, Roche diagnostics corp., Arcadia Health Care, Omron Healthcare Inc., Bayer AG, Nxstage Medical, Inc., Apria healthcare group, Arkray Inc., Odyssey Healthcare Inc., Critical Homecare, Becton, Dickinson and Company, and Amedisys, Inc. These market players are engaged in a variety of strategic initiatives like collaborations, regional expansion, mergers and acquisitions, service range expansion.
The global home healthcare market is segmented as follows –
By Component
- Equipment
- Therapeutic
- Home Respiratory Equipment
- Insulin Delivery Device
- Home IV Pumps
- Home Dialysis Equipment
- Other Therapeutic Equipment
- Diagnostic
- Diabetic Care Unit
- BP Monitors
- Multi Parameter Diagnostic Monitors
- Home Pregnancy and Fertility Kits
- Other Self-Monitoring Equipment
- Apnea and Sleep Monitors
- Holter Monitors
- Heart Rate Maters
- Other
- Mobility Assist
- Wheel Chair
- Home Medical Furniture
- Walking Assist Devices
- Services
-
- Rehabilitation Services
- Unskilled Home Care
- Respiratory Therapy Services
- Infusion Therapy Services
- Telemetry
By Region
- North America
- U.S
- Canada
- Mexico
- Europe
- Germany
- France
- UK
- Italy
- Spain
- Rest of Europe
- Asia-Pacific
- Japan
- China
- Australia
- India
- South Korea
- Rest of Asia Pacific
- Rest of the World
- Brazil
- South Africa
- Saudi Arabia
- United Arab Emirates
- Others
Some of the key questions answered by the report are:
- What was the market size in 2017 and forecast from 2017 to 2022?
- What will be the industry market growth from 2017 to 2022?
- What are the major drivers, restraints, opportunities, challenges, and industry trends and their impact on the market forecast?
- What are the major segments leading the market growth and why
- Which are the leading players in the market and what are the major strategies adopted by them to sustain the market competition?
Market Classification
- Home Healthcare Market, By Component, Estimates and Forecast, 2012-2022 ($Million)
- Equipment
- Therapeutic
- Home Respiratory Equipment
- Insulin Delivery Device
- Home IV Pumps
- Home Dialysis Equipment
- Other Therapeutic Equipment
- Diagnostic
- Diabetic Care Unit
- BP Monitors
- Multi Parameter Diagnostic Monitors
- Home Pregnancy and Fertility Kits
- Other Self-Monitoring Equipment
- Apnea and Sleep Monitors
- Holter Monitors
- Heart Rate Maters
- Other Diagnostics Components
- Mobility Assist
- Wheel Chair
- Home Medical Furniture
- Walking Assist Devices
- Services
- Rehabilitation Services
- Unskilled Home Care
- Respiratory Therapy Services
- Infusion Therapy Services
- Telemetry
- Home Healthcare Market, By Region, Estimates and Forecast, 2012-2022 ($Million)
- North America
- North America Home Healthcare Market, By Country
- North America Home Healthcare Market, By Component
- U.S. Home Healthcare Market, By Component
- Canada Home Healthcare Market, By Component
- Mexico Home Healthcare Market, By Component
-
- Europe
- Europe Home Healthcare Market, By Country
- Europe Home Healthcare Market, By Component
- Germany Home Healthcare Market, By Component
- France Home Healthcare Market, By Component
- UK Home Healthcare Market, By Component
- Italy Home Healthcare Market, By Component
- Spain Home Healthcare Market, By Component
- Rest of Europe Home Healthcare Market, By Component
-
- Asia-Pacific
- Asia-Pacific Home Healthcare Market, By Country
- Asia-Pacific Home Healthcare Market, By Component
- Japan Home Healthcare Market, By Component
- Australia Home Healthcare Market, By Component
- India Home Healthcare Market, By Component
- South Korea Home Healthcare Market, By Component
- Rest of Asia-Pacific Home Healthcare Market, By Component
-
- Rest of the World
- Rest of the World Home Healthcare Market, By Country
- Rest of the World Home Healthcare Market, By Component
- Brazil Home Healthcare Market, By Component
- South Africa Home Healthcare Market, By Component
- Saudi Arabia Home Healthcare Market, By Component
- Turkey Home Healthcare Market, By Component
- United Arab Emirates Home Healthcare Market, By Component
- Others Home Healthcare Market, By Component
1. Introduction
1.1. Report Description
1.2. Research Methodology
1.2.1. Secondary Research
1.2.2. Primary Research
2. Executive Summary
2.1. Key Highlights
3. Market Overview
3.1. Introduction
3.1.1. Market Definition
3.1.2. Market Segmentation
3.2. Market Dynamics
3.2.1. Drivers
3.2.1.1. Increasing Geriatric Population Across The Globe
3.2.1.2. Increasing Incidences of Chronic Diseases
3.2.1.3. Government Initiatives to Promote Home Healthcare
3.2.2. Restraints
3.2.2.1. Changing Reimbursement Policies
3.2.2.2. Lack Of Insurance Coverage
3.2.3. Opportunities
3.2.3.1. Emerging Markets to Offer Lucrative Growth Opportunities
4. Home Healthcare Market, By Component
4.1. Introduction
4.2. Home Healthcare Market, Assessment and Forecast, By Component, 2012-2022
4.3. Equipment
4.3.1. Market Assessment and Forecast, By Type, 2012-2022 ($Million)
4.3.2. Market Assessment and Forecast, By Region, 2012-2022 ($Million)
4.3.3. Therapeutic
4.3.3.1. Market Assessment and Forecast, By Type, 2012-2022 ($Million)
4.3.3.2. Market Assessment and Forecast, By Region, 2012-2022 ($Million)
4.3.3.3. Home Respiratory Equipment
4.3.3.3.1. Market Assessment and Forecast, By Region, 2012-2022 ($Million)
4.3.3.4. Insulin Delivery Device
4.3.3.4.1. Market Assessment and Forecast, By Region, 2012-2022 ($Million)
4.3.3.5. Home IV Pumps
4.3.3.5.1. Market Assessment and Forecast, By Region, 2012-2022 ($Million)
4.3.3.6. Home Dialysis Equipment
4.3.3.6.1. Market Assessment and Forecast, By Region, 2012-2022 ($Million)
4.3.3.7. Other Therapeutic Equipment
4.3.3.7.1. Market Assessment and Forecast, By Region, 2012-2022 ($Million)
4.3.4. Diagnostic
4.3.4.1. Market Assessment and Forecast, By Type, 2012-2022 ($Million)
4.3.4.2. Market Assessment and Forecast, By Region, 2012-2022 ($Million)
4.3.4.3. Diabetic Care Unit
4.3.4.3.1. Market Assessment and Forecast, By Region, 2012-2022 ($Million)
4.3.4.4. BP Monitors
4.3.4.4.1. Market Assessment and Forecast, By Region, 2012-2022 ($Million)
4.3.4.5. Multi Parameter Diagnostic Monitors
4.3.4.5.1. Market Assessment and Forecast, By Region, 2012-2022 ($Million)
4.3.4.6. Home Pregnancy and Fertility Kits
4.3.4.6.1. Market Assessment and Forecast, By Region, 2012-2022 ($Million)
4.3.4.7. Other Self-Monitoring Equipment
4.3.4.7.1. Market Assessment and Forecast, By Region, 2012-2022 ($Million)
4.3.4.8. Apnea and Sleep Monitors
4.3.4.8.1. Market Assessment and Forecast, By Region, 2012-2022 ($Million)
4.3.4.9. Holter Monitors
4.3.4.9.1. Market Assessment and Forecast, By Region, 2012-2022 ($Million)
4.3.4.10. Heart Rate Maters
4.3.4.10.1. Market Assessment and Forecast, By Region, 2012-2022 ($Million)
4.3.4.11. Other Diagnostics Components
4.3.4.11.1. Market Assessment and Forecast, By Region, 2012-2022 ($Million)
4.3.5. Mobility Assist
4.3.5.1. Market Assessment and Forecast, By Type, 2012-2022 ($Million)
4.3.5.2. Market Assessment and Forecast, By Region, 2012-2022 ($Million)
4.3.5.3. Wheel Chair
4.3.5.3.1. Market Assessment and Forecast, By Region, 2012-2022 ($Million)
4.3.5.4. Home Medical Furniture
4.3.5.4.1. Market Assessment and Forecast, By Region, 2012-2022 ($Million)
4.3.5.5. Walking Assist Devices
4.3.5.5.1. Market Assessment and Forecast, By Region, 2012-2022 ($Million)
4.3.6. Services
4.3.6.1. Market Assessment and Forecast, By Type, 2012-2022 ($Million)
4.3.6.2. Market Assessment and Forecast, By Region, 2012-2022 ($Million)
4.3.6.3. Rehabilitation Services
4.3.6.3.1. Market Assessment and Forecast, By Region, 2012-2022 ($Million)
4.3.6.4. Unskilled Home Care
4.3.6.4.1. Market Assessment and Forecast, By Region, 2012-2022 ($Million)
4.3.6.5. Respiratory Therapy Services
4.3.6.5.1. Market Assessment and Forecast, By Region, 2012-2022 ($Million)
4.3.6.6. Infusion Therapy Services
4.3.6.6.1. Market Assessment and Forecast, By Region, 2012-2022 ($Million)
4.3.6.7. Telemetry
4.3.6.7.1. Market Assessment and Forecast, By Region, 2012-2022 ($Million)
5. Home Healthcare Market, By Region
5.1. Introduction
5.2. Home Healthcare Market, Assessment and Forecast, By Region, 2012-2022 ($Million)
5.3. North America
5.3.1. Market Assessment and Forecast, By Country, 2012-2022 ($Million)
5.3.2. Market Assessment and Forecast, By Component, 2012-2022 ($Million)
5.3.3. U.S.
5.3.3.1. Market Assessment and Forecast, By Component, 2012-2022 ($Million)
5.3.4. Canada
5.3.4.1. Market Assessment and Forecast, By Component, 2012-2022 ($Million)
5.3.5. Mexico
5.3.5.1. Market Assessment and Forecast, By Component, 2012-2022 ($Million)
5.4. Europe
5.4.1. Market Assessment and Forecast, By Country, 2012-2022 ($Million)
5.4.2. Market Assessment and Forecast, By Component, 2012-2022 ($Million)
5.4.3. Germany
5.4.3.1. Market Assessment and Forecast, By Component, 2012-2022 ($Million)
5.4.4. France
5.4.4.1. Market Assessment and Forecast, By Component, 2012-2022 ($Million)
5.4.5. UK
5.4.5.1. Market Assessment and Forecast, By Component, 2012-2022 ($Million)
5.4.6. Italy
5.4.6.1. Market Assessment and Forecast, By Component, 2012-2022 ($Million)
5.4.7. Spain
5.4.7.1. Market Assessment and Forecast, By Component, 2012-2022 ($Million)
5.4.8. Rest of Europe
5.4.8.1. Market Assessment and Forecast, By Component, 2012-2022 ($Million)
5.5. Asia-Pacific
5.5.1. Market Assessment and Forecast, By Country, 2012-2022 ($Million)
5.5.2. Market Assessment and Forecast, By Component, 2012-2022 ($Million)
5.5.3. Japan
5.5.3.1. Market Assessment and Forecast, By Component, 2012-2022 ($Million)
5.5.4. China
5.5.4.1. Market Assessment and Forecast, By Component, 2012-2022 ($Million)
5.5.5. Australia
5.5.5.1. Market Assessment and Forecast, By Component, 2012-2022 ($Million)
5.5.6. India
5.5.6.1. Market Assessment and Forecast, By Component, 2012-2022 ($Million)
5.5.7. South Korea
5.5.7.1. Market Assessment and Forecast, By Component, 2012-2022 ($Million)
5.5.8. Rest of Asia-Pacific
5.5.8.1. Market Assessment and Forecast, By Component, 2012-2022 ($Million)
5.6. Rest of the World
5.6.1. Market Assessment and Forecast, By Country, 2012-2022 ($Million)
5.6.2. Market Assessment and Forecast, By Component, 2012-2022 ($Million)
5.6.3. Brazil
5.6.3.1. Market Assessment and Forecast, By Component, 2012-2022 ($Million)
5.6.4. Turkey
5.6.4.1. Market Assessment and Forecast, By Component, 2012-2022 ($Million)
5.6.5. Saudi Arabia
5.6.5.1. Market Assessment and Forecast, By Component, 2012-2022 ($Million)
5.6.6. South Africa
5.6.6.1. Market Assessment and Forecast, By Component, 2012-2022 ($Million)
5.6.7. United Arab Emirates
5.6.7.1. Market Assessment and Forecast, By Component, 2012-2022 ($Million)
5.6.8. Others
5.6.8.1. Market Assessment and Forecast, By Component, 2012-2022 ($Million)
6. Company Profiles
6.1. Almost Family Inc.
6.1.1. Business Overview
6.1.2. Product Portfolio
6.1.3. Key Financials
6.1.4. Strategic Developments
6.2. B. Braun Melsungen AG
6.2.1. Business Overview
6.2.2. Product Portfolio
6.2.3. Key Financials
6.2.4. Strategic Developments
6.3. Abbott Laboratories
6.3.1. Business Overview
6.3.2. Product Portfolio
6.3.3. Key Financials
6.3.4. Strategic Developments
6.4. Sunrise Medical Inc.
6.4.1. Business Overview
6.4.2. Product Portfolio
6.4.3. Strategic Developments
6.5. 3M Healthcare
6.5.1. Business Overview
6.5.2. Product Portfolio
6.5.3. Key Financials
6.5.4. Strategic Developments
6.6. Baxter International Inc.
6.6.1. Business Overview
6.6.2. Product Portfolio
6.6.3. Strategic Developments
6.7. Medtronic
6.7.1. Business Overview
6.7.2. Product Portfolio
6.7.3. Strategic Developments
6.8. Cardinal Health Inc.
6.8.1. Business Overview
6.8.2. Product Portfolio
6.8.3. Strategic Developments
6.9. Roche Diagnostics Corp.
6.9.1. Business Overview
6.9.2. Product Portfolio
6.9.3. Strategic Developments
6.10. Air Liquide
6.10.1. Business Overview
6.10.2. Product Portfolio
6.10.3. Key Financials
6.10.4. Strategic Developments
6.11. Arcadia Resources, Inc.
6.11.1. Business Overview
6.11.2. Product Portfolio
Strategic Developments
List of Tables
Table 1.Home Healthcare Market, By Component ($Million), 2012-2022
Table 2.Equipment Market, By Type ($Million), 2012-2022
Table 3.Equipment Market, By Region ($Million), 2012-2022
Table 4.Therapeutic Market, By Type ($Million), 2012-2022
Table 5.Therapeutic Market, By Region ($Million), 2012-2022
Table 6.Home Respiratory Equipment Market, By Region ($Million), 2012-2022
Table 7.Insulin Delivery Device Market, By Region ($Million), 2012-2022
Table 8.Home IV Pumps Market, By Region ($Million), 2012-2022
Table 9.Home Dialysis Equipment Market, By Region ($Million), 2012-2022
Table 10.Other Therapeutic Equipment Market, By Region ($Million), 2012-2022
Table 11.Diagnostic Market, By Type ($Million), 2012-2022
Table 12.Diagnostic Market, By Region ($Million), 2012-2022
Table 13.Diabetic Care Unit Market, By Region ($Million), 2012-2022
Table 14.BP Monitors Market, By Region ($Million), 2012-2022
Table 15.Multi Parameter Diagnostic Monitors Market, By Region ($Million), 2012-2022
Table 16.Home Pregnancy and Fertility Kits Market, By Region ($Million), 2012-2022
Table 17.Other Self-Monitoring Equipment Market, By Region ($Million), 2012-2022
Table 18.Apnea and Sleep Monitors Market, By Region ($Million), 2012-2022
Table 19.Holter Monitors Market, By Region ($Million), 2012-2022
Table 20.Heart Rate Maters Market, By Region ($Million), 2012-2022
Table 21.Other Diagnostics Component Market, By Region ($Million), 2012-2022
Table 22.Mobility Assist Market, By Type ($Million), 2012-2022
Table 23.Mobility Assist Market, By Region ($Million), 2012-2022
Table 24.Wheel Chair Market, By Region ($Million), 2012-2022
Table 25.Home Medical Furniture Market, By Region ($Million), 2012-2022
Table 26.Walking Assist Devices Market, By Region ($Million), 2012-2022
Table 27.Services Market, By Type ($Million), 2012-2022
Table 28.Services Market, By Region ($Million), 2012-2022
Table 29.Rehabilitation Services Market, By Region ($Million), 2012-2022
Table 30.Unskilled Home Care Market, By Region ($Million), 2012-2022
Table 31.Respiratory Therapy Services Market, By Region ($Million), 2012-2022
Table 32.Infusion Therapy Services Market, By Region ($Million), 2012-2022
Table 33.Telemetry Market, By Region ($Million), 2012-2022
Table 34.North America Home Healthcare Market, By Country, 2012-2022 ($Million)
Table 35.North America Home Healthcare Market, By Component, 2012-2022 ($Million)
Table 36.U.S.Home Healthcare Market, By Component, 2012-2022 ($Million)
Table 37.Canada Home Healthcare Market, By Component, 2012-2022 ($Million)
Table 38.Mexico Home Healthcare Market, By Component, 2012-2022 ($Million)
Table 39.Europe Home Healthcare Market, By Country, 2012-2022 ($Million)
Table 40.Europe Home Healthcare Market, By Component, 2012-2022 ($Million)
Table 41.Germany Home Healthcare Market, By Component, 2012-2022 ($Million)
Table 42.France Home Healthcare Market, By Component, 2012-2022 ($Million)
Table 43.UK Home Healthcare Market, By Component, 2012-2022 ($Million)
Table 44.Italy Home Healthcare Market, By Component, 2012-2022 ($Million)
Table 45.Spain Home Healthcare Market, By Component, 2012-2022 ($Million)
Table 46.Rest of Europe Home Healthcare Market, By Component, 2012-2022 ($Million)
Table 47.Asia-Pacific Home Healthcare Market, By Country, 2012-2022 ($Million)
Table 48.Asia-Pacific Home Healthcare Market, By Component, 2012-2022 ($Million)
Table 49.Japan Home Healthcare Market, By Component, 2012-2022 ($Million)
Table 50.China Home Healthcare Market, By Component, 2012-2022 ($Million)
Table 51.Australia Home Healthcare Market, By Component, 2012-2022 ($Million)
Table 52.India Home Healthcare Market, By Component, 2012-2022 ($Million)
Table 53.South Korea Home Healthcare Market, By Component, 2012-2022 ($Million)
Table 54.Rest of Asia-Pacific Home Healthcare Market, By Component, 2012-2022 ($Million)
Table 55.Rest of the World Home Healthcare Market, By Country, 2012-2022 ($Million)
Table 56.Rest of the World Home Healthcare Market, By Component, 2012-2022 ($Million)
Table 57.Brazil Home Healthcare Market, By Component, 2012-2022 ($Million)
Table 58.Turkey Home Healthcare Market, By Component, 2012-2022 ($Million)
Table 59.Saudi Arabia Home Healthcare Market, By Component, 2012-2022 ($Million)
Table 60.South Africa Home Healthcare Market, By Component, 2012-2022 ($Million)
Table 61.United Arab Emirates Home Healthcare Market, By Component, 2012-2022 ($Million)
Table 62.Others Home Healthcare Market, By Component, 2012-2022 ($Million)
Table 63.Almost Family Inc..: Key Strategic Developments, 2017-2017
Table 64.B. Braun Melsungen AG: Key Strategic Developments, 2017-2017
Table 65.Abbott Laboratories: Key Strategic Developments, 2017-2017
Table 66.Sunrise Medical Inc.: Key Strategic Developments, 2017-2017
Table 67.3M Healthcare: Key Strategic Developments, 2017-2017
Table 68.Baxter International Inc.: Key Strategic Developments, 2017-2017
Table 69.Medtronic: Key Strategic Developments, 2017-2017
Table 70.Cardinal Health Inc.: Key Strategic Developments, 2017-2017
Table 71.Roche Diagnostics Corp..: Key Strategic Developments, 2017-2017
Table 72.Air Liquide: Key Strategic Developments, 2017-2017
Table 73.Arcadia Resources, Inc.: Key Strategic Developments, 2017-2017
List of Figures
Figure 1.Home Healthcare Market, Share, By Component, 2017 & 2025
Figure 2Home Healthcare Market, By Region, 2017, ($Million)
Figure 3.Almost Family Inc.: Net Revenues, 2017-2017 ($Million)
Figure 4.Almost Family Inc.: Net Revenue Share, By Segment, 2017
Figure 5.Almost Family Inc.: Net Revenue Share, By Geography, 2017
Figure 6.B. Braun Melsungen AG: Net Revenues, 2017-2017 ($Million)
Figure7.B. Braun Melsungen AG: Net Revenue Share, By Segment, 2017
Figure8.B. Braun Melsungen AG: Net Revenue Share, By Geography, 2017
Figure9.Abbott Laboratories: Net Revenues, 2017-2017 ($Million)
Figure10.Abbott Laboratories: Net Revenue Share, By Segment, 2017
Figure 11.Abbott Laboratories: Net Revenue Share, By Geography, 2017
Figure 12.3M Healthcare: Net Revenues, 2017-2017 ($Million)
Figure 13.3M Healthcare: Net Revenue Share, By Segment, 2017
Figure 14.3M Healthcare: Net Revenue Share, By Geography, 2017
Figure 15.Air Liquide: Net Revenues, 2017-2017 ($Million)
Figure 16.Air Liquide: Net Revenue Share, By Segment, 2017
Figure 17.Air Liquide: Net Revenue Share, By Geography, 2017
Research Methodology
We use both primary as well as secondary research for our market surveys, estimates and for developing forecast. Our research process commence by analyzing the problem which enable us to design the scope for our research study. Our research process is uniquely designed with enough flexibility to adjust according to changing nature of products and markets, while retaining core element to ensure reliability and accuracy in research findings. We understand both macro and micro-economic factors to evaluate and forecast different market segments.
Data Mining
Data is extensively collected through various secondary sources such as annual reports, investor presentations, SEC filings, and other corporate publications. We also refer trade magazines, technical journals, paid databases such as Factiva and Bloomberg, industry trade journals, scientific journals, and social media data to understand market dynamics and industry trends. Further, we also conduct primary research to understand market drivers, restraints, opportunities, challenges, and competitive scenario to build our analysis.
Data Collection Matrix
|
Data Collection Matrix |
Supply Side |
Demand Side |
|
Primary Data Sources |
|
|
|
Secondary Data Sources |
|
|
Market Modeling and Forecasting
We use epidemiology and capital equipment-based models to forecast market size of different segments at country and regional level.
- Epidemiology-based Forecasting Model: This method uses epidemiology data gathered through various publications and from physicians to estimate population of patients, flow of treatment of individual disease and therapies. The data collected through this method includes statics on incidence of disease, population suffering from disease, and treatment population. This method is used to understand:
- Number of patients for particular device or medical procedure and
- Repeated use of particular device depending on health and condition of patient
- Capital-based Forecasting Model: This method of forecasting is based on number of replacements, installed-based and new sales of capital equipment used in various healthcare and diagnostic centers. These three parameters are calculated and forecast is developed. Installation base is calculated as average number of units per facility; while sales for particular year is calculated from number of new and replace units. Secondary data is collected through various supply chain intermediaries and opinion leaders to arrive at installation and sales rate. These techniques help our analysts in validating market and developed market estimates and forecast.
We do forecast on basis of several parameters such as market drivers, market opportunities, industry trends government regulations, raw materials supply and trade dynamics to ensure relevance of forecast with market scenario. With increasing need to granulized information, we used bottom-up methodology for forecasting where we evaluate each regional segment differently and combined all forecast to develop final market forecast.
Data Validation
We believe primary research is a very important tool in analyzing and forecasting different markets. In order to make sure accuracy of our findings, our team conducts primary interviews at every stage of research to gain deep insights into current business environment and future trends and key developments in market. This includes use of various methods such as telephonic interviews, focus groups, face to face interviews and questionnaires to validate our research from all aspects. We validate our data through primary research from key industry leaders such as CEO, product managers, marketing managers, suppliers, distributors, and consumers are frequently interviewed. These interviews provide valuable insights which help us to have better market understanding besides validating our estimates and forecast.
Data Triangulation

Industry Analysis
|
Qualitative Data |
Quantitative Data (2017-2025) |
|
|