Genomics Market by Product, Application , and Technology - Global Industry Analysis and Forecast to 2022
Published On : November 2017 Pages : 102 Category: Biotechnology Report Code : HC11314
Industry Trend Analysis
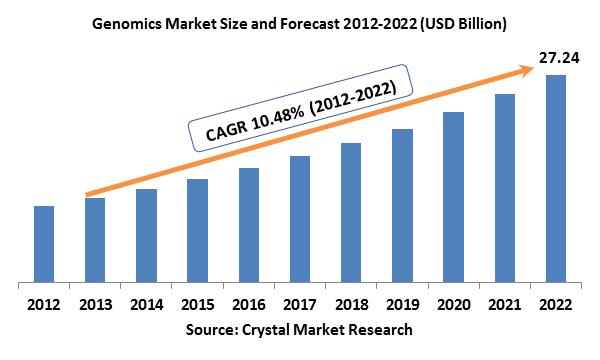
The global genomics market was evaluated around USD 10.06 billion in the 2017 and is expected to reach approximately USD 27.24 billion by the end of 2022 while registering itself at a compound annual growth rate (CAGR) of 10.48% over the forecast period. Genomics is a division of biology that includes the study of genes and their works and implements bioinformatics, recombinant DNA, and DNA sequencing methods to study sequence, and pull together the function and structure of genomes. It involves functional genomics, comparative genomics, Pharmacogenomics, structural genomics, and epigenomics. Genomics has rendered numerous applications in several fields like biotechnology, anthropology, genomic medicine, and other sciences. The global genomics market has experienced a rise in industry potential owing to technological innovations as new informatics accesses that amalgamate various forms of data with genomic data in illness research which permitting researchers to understand the genetic bases of a variety of drug response and diseases more effectively. Additionally, a rise in partial or full compensation for this industry by the government of particular countries, growing the occurrence of fatal diseases like diabetes, cancer, and others provide the rise in their requirement in the global development. Escalating accesses for novel genomics tools and techniques, calculate their benefit to the patient and concentrate on steps to execute it and rising genome profiling technologies are anticipated to expand the genomics industry at the rapid rate. The finely-distributed network of medical laboratories is contributing to faster and easy acceptance of genomics techniques and products.
Product Outlook and Trend Analysis
According to the product, the global genomics market is split into consumables, services, and instruments. In 2017, consumables seized the major share of the global product market at around 59.6% and are predicted to grow at the maximum compound annual growth rate over the forecast years as a result of rising commercial implementation of genomic testing for diverse applications together with decreasing the price of mounting applications and consumables.
Application Outlook and Trend Analysis
By application, the global genomics market is classified into agricultural, drug discovery, diagnostics, academic research, personalizes medicine, and others. In 2017, genomics application in diagnostics industry ruled the global market concerning the market share at around 35.71% owing to rapidly expanding molecular diagnostic tests to guide and manage treatment of disease, rising awareness about the advantages of gene-based diagnostic among various medical practitioners and doctors and precision of gene-based diagnostics disorders. The personalized drug market is anticipated to expand at the leading compound annual growth rate over the projected period owing to diverse factors like early diagnostic of disease, lucrative treatments, patient abidance, the safety of medicine, and treatment optimization. SCGPM (The Stanford Center for Genomics and Personalized Medicine) is attempting to gain advancement in genomic technology to make both genetic and molecular profiling as powerful and routine tools for supervising, forecasting disease threats and treating a range of diseases.
Technology Outlook and Trend Analysis
On the basis of its technology, the global genomics market is classified as DNA sequencing, DNA microarray, PCR, and nucleic acid purification and extraction. In 2017, PCR held the major industry share at 48.9% owing to growing research and development processes in proteomics and genomics, innovations in technology and involvement of government regulations concerning the R&D funding. Nucleic acid purification and extraction technology market is estimated to expand at the maximum compound annual growth rate around 10.1% over the forecast years on account of increasing approaches for innovative diagnostic tools and techniques, analyze their advantages for the patient and concentrate on steps to employ it and promising genome profiling technologies.
Regional Outlook and Trend Analysis
In 2017, European regional market reported for the leading share of the global genomics market at around 43.0% market share. The rising incidence of cardiovascular disorders and genetic disorders along with growing investments in genomics and proteomics is anticipated to fuel the market growth. Though, the market is anticipated to lose its share over the projected period since European economic crisis and the occurrence of irregular refund policies are a few of the restraining factors for the market growth. The Asia Pacific regional genomics market is projected to grow at the top compound annual growth rate of around 12.7% over the forecast period owing to rising awareness as well as adoption of a variety of genomics techniques in developing countries like China and India for treatment, prognosis and detecting a range of genetic diseases like diabetes, cancer, and others. Besides to this, amending medical infrastructure, high unfulfilled medical requirements, increasing disposable earnings of incomes and rising health care spendings are also the driving factors for the expansion of this market.
Competitive Outlook and Trend Analysis
The major market players for global genomics market include Affymetrix, Inc., Agilent Technologies, BGI, Bio-Rad Laboratories Inc., GE Healthcare, Illumina Inc., Qiagen, Roche Diagnostics, Life Technologies Corporation, Cepheid, Inc., and others. Tactical partnerships, acquisitions, new product launches and geographic growth are the most frequently used strategies by the majority companies in the global market.
The global genomics market is segmented as follows –
By Product
- Instruments
- Consumables
- Services
By Application
- Drug Discovery and Development
- Academic Research
- Agriculture
- Diagnostics
- Personalized Medicines
By Technology
- DNA Microarray
- Nucleic Acid Extraction and Purification
- PCR
- DNA Sequencing
By Region
- North America
- U.S
- Canada
- Mexico
- Europe
- Germany
- France
- UK
- Italy
- Spain
- Rest of Europe
- Asia-Pacific
- Japan
- China
- Australia
- India
- South Korea
- Rest of Asia Pacific
- Rest of the World
- Brazil
- South Africa
- Saudi Arabia
- United Arab Emirates
- Others
Some of the key questions answered by the report are:
- What was the market size in 2017 and forecast from 2017 to 2022?
- What will be the industry market growth from 2017 to 2022
- What are the major drivers, restraints, opportunities, challenges, and industry trends and their impact on the market forecast?
- What are the major segments leading the market growth and why?
- Which are the leading players in the market and what are the major strategies adopted by them to sustain the market competition?
- Genomics Market, By Product, Estimates and Forecast, 2012-2022 ($Million)
- Instruments
- Consumables
- Services
- Genomics Market, By Application, Estimates and Forecast, 2012-2022 ($Million)
- Drug Discovery and Development
- Academic Research
- Agriculture
- Diagnostics
- Personalized Medicines
- Genomics Market, By End User, Estimates and Forecast, 2012-2022 ($Million)
- DNA Microarray
- Nucleic Acid Extraction and Purification
- PCR
- DNA Sequencing
- Genomics Market, By Region, Estimates and Forecast, 2012-2022 ($Million)
- North America
- North America Genomics Market, By Country
- North America Genomics Market, By Product
- North America Genomics Market, By Application
- North America Genomics Market, By End User
- U.S. Genomics Market, By Product
- U.S. Genomics Market, By Application
- U.S. Genomics Market, By End User
- Canada Genomics Market, By Product
- Canada Genomics Market, By Application
- Canada Genomics Market, By End User
- Mexico Genomics Market, By Product
- Mexico Genomics Market, By Application
- Mexico Genomics Market, By End User
-
- Europe
- Europe Genomics Market, By Country
- Europe Genomics Market, By Product
- Europe Genomics Market, By Application
- Europe Genomics Market, By End User
- Germany Genomics Market, By Product
- Germany Genomics Market, By Application
- Germany Genomics Market, By End User
- France Genomics Market, By Product
- France Genomics Market, By Application
- France Genomics Market, By End User
- UK Genomics Market, By Product
- UK Genomics Market, By Application
- UK Genomics Market, By End User
- Italy Genomics Market, By Product
- Italy Genomics Market, By Application
- Italy Genomics Market, By End User
- Spain Genomics Market, By Product
- Spain Genomics Market, By Application
- Spain Genomics Market, By End User
- Rest of Europe Genomics Market, By Product
- Rest of Europe Genomics Market, By Application
- Rest of Europe Genomics Market, By End User
-
- Asia-Pacific
- Asia-Pacific Genomics Market, By Country
- Asia-Pacific Genomics Market, By Product
- Asia-Pacific Genomics Market, By Application
- Asia-Pacific Genomics Market, By End User
- Japan Genomics Market, By Product
- Japan Genomics Market, By Application
- Japan Genomics Market, By End User
- China Genomics Market, By Product
- China Genomics Market, By Application
- China Genomics Market, By End User
- Australia Genomics Market, By Product
- Australia Genomics Market, By Application
- Australia Genomics Market, By End User
- India Genomics Market, By Product
- India Genomics Market, By Application
- India Genomics Market, By End User
- South Korea Genomics Market, By Product
- South Korea Genomics Market, By Application
- South Korea Genomics Market, By End User
- Rest of Asia-Pacific Genomics Market, By Product
- Rest of Asia-Pacific Genomics Market, By Application
- Rest of Asia-Pacific Genomics Market, By End User
-
- Rest of the World
- Rest of the World Genomics Market, By Country
- Rest of the World Genomics Market, By Product
- Rest of the World Genomics Market, By Application
- Rest of the World Genomics Market, By End User
- Brazil Genomics Market, By Product
- Brazil Genomics Market, By Application
- Brazil Genomics Market, By End User
- South Africa Genomics Market, By Product
- South Africa Genomics Market, By Application
- South Africa Genomics Market, By End User
- Saudi Arabia Genomics Market, By Product
- Saudi Arabia Genomics Market, By Application
- Saudi Arabia Genomics Market, By End User
- Turkey Genomics Market, By Product
- Turkey Genomics Market, By Application
- Turkey Genomics Market, By End User
- United Arab Emirates Genomics Market, By Product
- United Arab Emirates Genomics Market, By Application
- United Arab Emirates Genomics Market, By End User
- Others Genomics Market, By Product
- Others Genomics Market, By Application
- Others Genomics Market, By End User
1. Introduction
1.1. Report Description
1.2. Research Methodology
1.2.1. Secondary Research
1.2.2. Primary Research
2. Executive Summary
2.1. Key Highlights
3. Market Overview
3.1. Introduction
3.1.1. Market Definition
3.1.2. Market Segmentation
3.2. Market Dynamics
3.2.1. Drivers
3.2.1.1. Increasing Application Areas of Genomics
3.2.1.2. Rising Government Funding and Growth in Genomics Projects
3.2.2. Restraints
3.2.2.1. High Cost of Genomics equipment
3.2.3. Opportunities
3.2.3.1. Utilization of Genomics in medical industries
4. Genomics Market, By Product
4.1. Introduction
4.2. Genomics Market Assessment and Forecast, By Product, 2012-2022
4.3. Instruments
4.3.1. Market Assessment and Forecast, By Region, 2012-2022 ($Million)
4.4. Consumables
4.4.1. Market Assessment and Forecast, By Region, 2012-2022 ($Million)
4.5. Services
4.5.1. Market Assessment and Forecast, By Region, 2012-2022 ($Million)
5. Genomics Market, By Application
5.1. Introduction
5.2. Genomics Market Assessment and Forecast, By Application, 2012-2022
5.3. Drug Discovery and Development
5.3.1. Market Assessment and Forecast, By Region, 2012-2022 ($Million)
5.4. Academic Research
5.4.1. Market Assessment and Forecast, By Region, 2012-2022 ($Million)
5.5. Agriculture
5.5.1. Market Assessment and Forecast, By Region, 2012-2022 ($Million)
5.6. Diagnostics
5.6.1. Market Assessment and Forecast, By Region, 2012-2022 ($Million)
5.7. Personalized Medicines
5.7.1. Market Assessment and Forecast, By Region, 2012-2022 ($Million)
6. Genomics Market, By Technology
6.1. Introduction
6.2. Genomics Market Assessment and Forecast, By Technology, 2012-2022 ($Million)
6.3. DNA Microarray
6.3.1. Market Assessment and Forecast, By Region, 2012-2022 ($Million)
6.4. Nucleic Acid Extraction and Purification
6.4.1. Market Assessment and Forecast, By Region, 2012-2022 ($Million)
6.5. PCR
6.5.1. Market Assessment and Forecast, By Region, 2012-2022 ($Million)
6.6. DNA Sequencing
6.6.1. Market Assessment and Forecast, By Region, 2012-2022 ($Million)
7. Genomics Market, By Region
7.1. Introduction
7.2. Genomics Market Assessment and Forecast, By Region, 2012-2022 ($Million)
7.3. North America
7.3.1. Market Assessment and Forecast, By Country, 2012-2022 ($Million)
7.3.2. Market Assessment and Forecast, By Product, 2012-2022 ($Million)
7.3.3. Market Assessment and Forecast, By Application, 2012-2022 ($Million)
7.3.4. Market Assessment and Forecast, By Technology, 2012-2022 ($Million)
7.3.4.1. U.S.
7.3.4.1.1. Market Assessment and Forecast, By Product, 2012-2022 ($Million)
7.3.4.1.2. Market Assessment and Forecast, By Application, 2012-2022 ($Million)
7.3.4.1.3. Market Assessment and Forecast, By Technology, 2012-2022 ($Million)
7.3.4.2. Canada
7.3.4.2.1. Market Assessment and Forecast, By Product, 2012-2022 ($Million)
7.3.4.2.2. Market Assessment and Forecast, By Application, 2012-2022 ($Million)
7.3.4.2.3. Market Assessment and Forecast, By Technology, 2012-2022 ($Million)
7.3.4.3. Mexico
7.3.4.3.1. Market Assessment and Forecast, By Product, 2012-2022 ($Million)
7.3.4.3.2. Market Assessment and Forecast, By Application, 2012-2022 ($Million)
7.3.4.3.3. Market Assessment and Forecast, By Technology, 2012-2022 ($Million)
7.4. Europe
7.4.1. Market Assessment and Forecast, By Country, 2012-2022 ($Million)
7.4.2. Market Assessment and Forecast, By Product, 2012-2022 ($Million)
7.4.3. Market Assessment and Forecast, By Application, 2012-2022 ($Million)
7.4.4. Market Assessment and Forecast, By Technology, 2012-2022 ($Million)
7.4.4.1. Germany
7.4.4.1.1. Market Assessment and Forecast, By Product, 2012-2022 ($Million)
7.4.4.1.2. Market Assessment and Forecast, By Application, 2012-2022 ($Million)
7.4.4.1.3. Market Assessment and Forecast, By Technology, 2012-2022 ($Million)
7.4.4.2. France
7.4.4.2.1. Market Assessment and Forecast, By Product, 2012-2022 ($Million)
7.4.4.2.2. Market Assessment and Forecast, By Applications, 2012-2022 ($Million)
7.4.4.2.3. Market Assessment and Forecast, By Technology, 2012-2022 ($Million)
7.4.4.3. UK
7.4.4.3.1. Market Assessment and Forecast, By Product, 2012-2022 ($Million)
7.4.4.3.2. Market Assessment and Forecast, By Application, 2012-2022 ($Million)
7.4.4.3.3. Market Assessment and Forecast, By Technology, 2012-2022 ($Million)
7.4.4.4. Italy
7.4.4.4.1. Market Assessment and Forecast, By Product, 2012-2022 ($Million)
7.4.4.4.2. Market Assessment and Forecast, By Application, 2012-2022 ($Million)
7.4.4.4.3. Market Assessment and Forecast, By Technology, 2012-2022 ($Million)
7.4.4.5. Spain
7.4.4.5.1. Market Assessment and Forecast, By Product, 2012-2022 ($Million)
7.4.4.5.2. Market Assessment and Forecast, By Application, 2012-2022 ($Million)
7.4.4.5.3. Market Assessment and Forecast, By Technology, 2012-2022 ($Million)
7.4.4.6. Rest of Europe
7.4.4.6.1. Market Assessment and Forecast, By Product, 2012-2022 ($Million)
7.4.4.6.2. Market Assessment and Forecast, By Application, 2012-2022 ($Million)
7.4.4.6.3. Market Assessment and Forecast, By Technology, 2012-2022 ($Million)
7.5. Asia-Pacific
7.5.1. Market Assessment and Forecast, By Country, 2012-2022 ($Million)
7.5.2. Market Assessment and Forecast, By Product, 2012-2022 ($Million)
7.5.3. Market Assessment and Forecast, By Application, 2012-2022 ($Million)
7.5.4. Market Assessment and Forecast, By Technology, 2012-2022 ($Million)
7.5.4.1. Japan
7.5.4.1.1. Market Assessment and Forecast, By Product, 2012-2022 ($Million)
7.5.4.1.2. Market Assessment and Forecast, By Application, 2012-2022 ($Million)
7.5.4.1.3. Market Assessment and Forecast, By Technology, 2012-2022 ($Million)
7.5.4.2. China
7.5.4.2.1. Market Assessment and Forecast, By Product, 2012-2022 ($Million)
7.5.4.2.2. Market Assessment and Forecast, By Application, 2012-2022 ($Million)
7.5.4.2.3. Market Assessment and Forecast, By Technology, 2012-2022 ($Million)
7.5.4.3. Australia
7.5.4.3.1. Market Assessment and Forecast, By Product, 2012-2022 ($Million)
7.5.4.3.2. Market Assessment and Forecast, By Application, 2012-2022 ($Million)
7.5.4.3.3. Market Assessment and Forecast, By Technology, 2012-2022 ($Million)
7.5.4.4. India
7.5.4.4.1. Market Assessment and Forecast, By Product, 2012-2022 ($Million)
7.5.4.4.2. Market Assessment and Forecast, By Application, 2012-2022 ($Million)
7.5.4.4.3. Market Assessment and Forecast, By Technology, 2012-2022 ($Million)
7.5.4.5. South Korea
7.5.4.5.1. Market Assessment and Forecast, By Product, 2012-2022 ($Million)
7.5.4.5.2. Market Assessment and Forecast, By Application, 2012-2022 ($Million)
7.5.4.5.3. Market Assessment and Forecast, By Technology, 2012-2022 ($Million)
7.5.4.6. Rest of Asia-Pacific
7.5.4.6.1. Market Assessment and Forecast, By Product, 2012-2022 ($Million)
7.5.4.6.2. Market Assessment and Forecast, By Application, 2012-2022 ($Million)
7.5.4.6.3. Market Assessment and Forecast, By Technology, 2012-2022 ($Million)
7.6. Rest of the World
7.6.1. Market Assessment and Forecast, By Country, 2012-2022 ($Million)
7.6.2. Market Assessment and Forecast, By Product, 2012-2022 ($Million)
7.6.3. Market Assessment and Forecast, By Application, 2012-2022 ($Million)
7.6.4. Market Assessment and Forecast, By Technology, 2012-2022 ($Million)
7.6.4.1. Brazil
7.6.4.1.1. Market Assessment and Forecast, By Product, 2012-2022 ($Million)
7.6.4.1.2. Market Assessment and Forecast, By Application, 2012-2022 ($Million)
7.6.4.1.3. Market Assessment and Forecast, By Technology, 2012-2022 ($Million)
7.6.4.2. Turkey
7.6.4.2.1. Market Assessment and Forecast, By Product, 2012-2022 ($Million)
7.6.4.2.2. Market Assessment and Forecast, By Application, 2012-2022 ($Million)
7.6.4.2.3. Market Assessment and Forecast, By Technology, 2012-2022 ($Million)
7.6.4.3. Saudi Arabia
7.6.4.3.1. Market Assessment and Forecast, By Product, 2012-2022 ($Million)
7.6.4.3.2. Market Assessment and Forecast, By Application, 2012-2022 ($Million)
7.6.4.3.3. Market Assessment and Forecast, By Technology, 2012-2022 ($Million)
7.6.4.4. South Africa
7.6.4.4.1. Market Assessment and Forecast, By Product, 2012-2022 ($Million)
7.6.4.4.2. Market Assessment and Forecast, By Application, 2012-2022 ($Million)
7.6.4.4.3. Market Assessment and Forecast, By Technology, 2012-2022 ($Million)
7.6.4.5. United Arab Emirates
7.6.4.5.1. Market Assessment and Forecast, By Product, 2012-2022 ($Million)
7.6.4.5.2. Market Assessment and Forecast, By Application, 2012-2022 ($Million)
7.6.4.5.3. Market Assessment and Forecast, By Technology, 2012-2022 ($Million)
7.6.4.6. Others
7.6.4.6.1. Market Assessment and Forecast, By Product, 2012-2022 ($Million)
7.6.4.6.2. Market Assessment and Forecast, By Application, 2012-2022 ($Million)
7.6.4.6.3. Market Assessment and Forecast, By Technology, 2012-2022 ($Million)
8. Company Profiles
8.1. BGI
8.1.1. Business Overview
8.1.2. Product Portfolio
8.1.3. Key Financials
8.1.4. Strategic Developments
8.2. Bio-Rad Laboratories Inc.
8.2.1. Business Overview
8.2.2. Product Portfolio
8.2.3. Key Financials
8.2.4. Strategic Developments
8.3. Agilent Technologies
8.3.1. Business Overview
8.3.2. Product Portfolio
8.3.3. Key Financials
8.3.4. Strategic Developments
8.4. Affymetrix, Inc.
8.4.1. Business Overview
8.4.2. Product Portfolio
8.4.3. Key Financials
8.4.4. Strategic Developments
8.5. GE Healthcare
8.5.1. Business Overview
8.5.2. Product Portfolio
8.5.3. Key Financials
8.5.4. Strategic Developments
8.6. Qiagen
8.6.1. Business Overview
8.6.2. Product Portfolio
8.6.3. Strategic Developments
8.7. Illumina Inc.
8.7.1. Business Overview
8.7.2. Product Portfolio
8.7.3. Key Financials
8.7.4. Strategic Developments
8.8. Roche Diagnostics
8.8.1. Business Overview
8.8.2. Product Portfolio
8.8.3. Strategic Developments
8.9. Cepheid
8.9.1. Business Overview
8.9.2. Product Portfolio
8.9.3. Key Financials
8.9.4. Strategic Developments
8.10. Life Technologies
8.10.1. Business Overview
8.10.2. Product Portfolio
8.10.3. Key Financials
8.10.4. Strategic Developments
List of Tables
Table 1.Genomics Market, By Product ($Million), 2012-2022
Table 2.Instruments Market, By Region ($Million), 2012-2022
Table 3.Consumables Market, By Region ($Million), 2012-2022
Table 4.Services Market, By Region ($Million), 2012-2022
Table 5.Genomics Market, By Application ($Million), 2012-2022
Table 6.Drug Discovery and Development Market, By Region ($Million), 2012-2022
Table 7.Academic Research Market, By Region ($Million), 2012-2022
Table 8.Agriculture Market, By Region ($Million), 2012-2022
Table 9.Diagnostics Market, By Region ($Million), 2012-2022
Table 10.Personalized Medicines Market, By Region ($Million), 2012-2022
Table 11.Genomics Market, By Technology ($Million), 2012-2022
Table 12.DNA Microarray Market, By Region ($Million), 2012-2022
Table 13.Nucleic Acid Extraction and Purification Market, By Region ($Million), 2012-2022
Table 14.PCR Market, By Region ($Million), 2012-2022
Table 15.DNA Sequencing Market, By Region ($Million), 2012-2022
Table 16.Genomics Market, By Region ($Million), 2012-2022
Table 17.North America Genomics Market, By Country, 2012-2022 ($Million)
Table 18.North America Genomics Market, By Product, 2012-2022 ($Million)
Table 19.North America Genomics Market, By Application, 2012-2022 ($Million)
Table 20.North America Genomics Market, By Technology, 2012-2022 ($Million)
Table 21.U.S. Genomics Market, By Product, 2012-2022 ($Million)
Table 22.U.S. Genomics Market, By Application, 2012-2022 ($Million)
Table 23.U.S. Genomics Market, By Technology, 2012-2022 ($Million)
Table 24.Canada Genomics Market, By Product, 2012-2022 ($Million)
Table 25.Canada Genomics Market, By Application, 2012-2022 ($Million)
Table 26.Canada Genomics Market, By Technology, 2012-2022 ($Million)
Table 27.Mexico Genomics Market, By Product, 2012-2022 ($Million)
Table 28.Mexico Genomics Market, By Application, 2012-2022 ($Million)
Table 29.Mexico Genomics Market, By Technology, 2012-2022 ($Million)
Table 30.Europe Genomics Market, By Country, 2012-2022 ($Million)
Table 31.Europe Genomics Market, By Product, 2012-2022 ($Million)
Table 32.Europe Genomics Market, By Application, 2012-2022 ($Million)
Table 33.Europe Genomics Market, By Technology, 2012-2022 ($Million)
Table 34.Germany Genomics Market, By Product, 2012-2022 ($Million)
Table 35.Germany Genomics Market, By Application, 2012-2022 ($Million)
Table 36.Germany Genomics Market, By Technology, 2012-2022 ($Million)
Table 37.France Genomics Market, By Product, 2012-2022 ($Million)
Table 38.France Genomics Market, By Application, 2012-2022 ($Million)
Table 39.France Genomics Market, By Technology, 2012-2022 ($Million)
Table 40.UK Genomics Market, By Product, 2012-2022 ($Million)
Table 41.UK Genomics Market, By Application, 2012-2022 ($Million)
Table 42.UK Genomics Market, By Technology, 2012-2022 ($Million)
Table 43.Italy Genomics Market, By Product, 2012-2022 ($Million)
Table 44.Italy Genomics Market, By Application, 2012-2022 ($Million)
Table 45.Italy Genomics Market, By Technology, 2012-2022 ($Million)
Table 46.Spain Genomics Market, By Product, 2012-2022 ($Million)
Table 47.Spain Genomics Market, By Application, 2012-2022 ($Million)
Table 48.Spain Genomics Market, By Technology, 2012-2022 ($Million)
Table 49.Rest of Europe Genomics Market, By Product, 2012-2022 ($Million)
Table 50.Rest of Europe Genomics Market, By Application, 2012-2022 ($Million)
Table 51.Rest of Europe Genomics Market, By Technology, 2012-2022 ($Million)
Table 52.Asia-Pacific Genomics Market, By Country, 2012-2022 ($Million)
Table 53.Asia-Pacific Genomics Market, By Product, 2012-2022 ($Million)
Table 54.Asia-Pacific Genomics Market, By Application, 2012-2022 ($Million)
Table 55.Asia-Pacific Genomics Market, By Technology, 2012-2022 ($Million)
Table 56.Japan Genomics Market, By Product, 2012-2022 ($Million)
Table 57.Japan Genomics Market, By Application, 2012-2022 ($Million)
Table 58.Japan Genomics Market, By Technology, 2012-2022 ($Million)
Table 59.China Genomics Market, By Product, 2012-2022 ($Million)
Table 60.China Genomics Market, By Application, 2012-2022 ($Million)
Table 61.China Genomics Market, By Technology, 2012-2022 ($Million)
Table 62.Australia Genomics Market, By Product, 2012-2022 ($Million)
Table 63.Australia Genomics Market, By Application, 2012-2022 ($Million)
Table 64.Australia Genomics Market, By Technology, 2012-2022 ($Million)
Table 65.India Genomics Market, By Product, 2012-2022 ($Million)
Table 66.India Genomics Market, By Application, 2012-2022 ($Million)
Table 67.India Genomics Market, By Technology, 2012-2022 ($Million)
Table 68.South Korea Genomics Market, By Product, 2012-2022 ($Million)
Table 69.South Korea Genomics Market, By Application, 2012-2022 ($Million)
Table 70.South Korea Genomics Market, By Technology, 2012-2022 ($Million)
Table 71.Rest of Asia-Pacific Genomics Market, By Product, 2012-2022 ($Million)
Table 72.Rest of Asia-Pacific Genomics Market, By Application, 2012-2022 ($Million)
Table 73.Rest of Asia-Pacific Genomics Market, By Technology, 2012-2022 ($Million)
Table 74.Rest of the World Genomics Market, By Country, 2012-2022 ($Million)
Table 75.Rest of the World Genomics Market, By Product, 2012-2022 ($Million)
Table 76.Rest of the World Genomics Market, By Application, 2012-2022 ($Million)
Table 77.Rest of the World Genomics Market, By Technology, 2012-2022 ($Million)
Table 78.Brazil Genomics Market, By Product, 2012-2022 ($Million)
Table 79.Brazil Genomics Market, By Application, 2012-2022 ($Million)
Table 80.Brazil Genomics Market, By Technology, 2012-2022 ($Million)
Table 81.Turkey Genomics Market, By Product, 2012-2022 ($Million)
Table 82.Turkey Genomics Market, By Application, 2012-2022 ($Million)
Table 83.Turkey Genomics Market, By Technology, 2012-2022 ($Million)
Table 84.Saudi Arabia Genomics Market, By Product, 2012-2022 ($Million)
Table 85.Saudi Arabia Genomics Market, By Application, 2012-2022 ($Million)
Table 86.Saudi Arabia Genomics Market, By Technology, 2012-2022 ($Million)
Table 87.South Africa Genomics Market, By Product, 2012-2022 ($Million)
Table 88.South Africa Genomics Market, By Application, 2012-2022 ($Million)
Table 89.South Africa Genomics Market, By Technology, 2012-2022 ($Million)
Table 90.United Arab Emirates Genomics Market, By Product, 2012-2022 ($Million)
Table 91.United Arab Emirates Genomics Market, By Application, 2012-2022 ($Million)
Table 92.United Arab Emirates Genomics Market, By Technology, 2012-2022 ($Million)
Table 93.Others Genomics Market, By Product, 2012-2022 ($Million)
Table 94.Others Genomics Market, By Application, 2012-2022 ($Million)
Table 95.Others Genomics Market, By Technology, 2012-2022 ($Million)
Table 96.BGI: Key Strategic Developments, 2017-2017
Table 97.Bio-Rad Laboratories Inc.: Key Strategic Developments, 2017-2017
Table 98.Agilent Technologies: Key Strategic Developments, 2017-2017
Table 99.Affymetrix, Inc.: Key Strategic Developments, 2017-2017
Table 100.GE Healthcare: Key Strategic Developments, 2017-2017
Table 101.Qiagen: Key Strategic Developments, 2017-2017
Table 102.Illumina Inc.: Key Strategic Developments, 2017-2017
Table 103.Roche Diagnostics: Key Strategic Developments, 2017-2017
Table 104.Cepheid: Key Strategic Developments, 2017-2017
Table 105.Life Technologies: Key Strategic Developments, 2017-2017
List of Figures
Figure 1.Genomics Market Share, By Product, 2012 & 2022 ($Million)
Figure 2.Genomics Market, By Application, 2012 & 2022 ($Million)
Figure 3.Genomics Market, By Technology, 2012 & 2022 ($Million)
Figure 4.Genomics Market, By Region, 2017, ($Million)
Figure 5.BGI: Net Revenues, 2017-2017 ($Million)
Figure 6.BGI: Net Revenue Share, By Segment, 2017
Figure 7.BGI: Net Revenue Share, By Geography, 2017
Figure 8.Agilent Technologies: Net Revenues, 2017-2017 ($Million)
Figure 9.Agilent Technologies: Net Revenue Share, By Segment, 2017
Figure 10.Agilent Technologies: Net Revenue Share, By Geography, 2017
Figure 11.GE Healthcare: Net Revenues, 2017-2017 ($Million)
Figure 12.GE Healthcare: Net Revenue Share, By Segment, 2017
Figure 13.GE Healthcare: Net Revenue Share, By Geography, 2017
Figure 14.Illumina Inc.: Net Revenues, 2017-2017 ($Million)
Figure 15.Illumina Inc.: Net Revenue Share, By Segment, 2017
Figure 16.Illumina Inc.: Net Revenue Share, By Geography, 2017
Research Methodology
We use both primary as well as secondary research for our market surveys, estimates and for developing forecast. Our research process commence by analyzing the problem which enable us to design the scope for our research study. Our research process is uniquely designed with enough flexibility to adjust according to changing nature of products and markets, while retaining core element to ensure reliability and accuracy in research findings. We understand both macro and micro-economic factors to evaluate and forecast different market segments.
Data Mining
Data is extensively collected through various secondary sources such as annual reports, investor presentations, SEC filings, and other corporate publications. We also refer trade magazines, technical journals, paid databases such as Factiva and Bloomberg, industry trade journals, scientific journals, and social media data to understand market dynamics and industry trends. Further, we also conduct primary research to understand market drivers, restraints, opportunities, challenges, and competitive scenario to build our analysis.
Data Collection Matrix
|
Data Collection Matrix |
Supply Side |
Demand Side |
|
Primary Data Sources |
|
|
|
Secondary Data Sources |
|
|
Market Modeling and Forecasting
We use epidemiology and capital equipment-based models to forecast market size of different segments at country and regional level.
- Epidemiology-based Forecasting Model: This method uses epidemiology data gathered through various publications and from physicians to estimate population of patients, flow of treatment of individual disease and therapies. The data collected through this method includes statics on incidence of disease, population suffering from disease, and treatment population. This method is used to understand:
- Number of patients for particular device or medical procedure and
- Repeated use of particular device depending on health and condition of patient
- Capital-based Forecasting Model: This method of forecasting is based on number of replacements, installed-based and new sales of capital equipment used in various healthcare and diagnostic centers. These three parameters are calculated and forecast is developed. Installation base is calculated as average number of units per facility; while sales for particular year is calculated from number of new and replace units. Secondary data is collected through various supply chain intermediaries and opinion leaders to arrive at installation and sales rate. These techniques help our analysts in validating market and developed market estimates and forecast.
We do forecast on basis of several parameters such as market drivers, market opportunities, industry trends government regulations, raw materials supply and trade dynamics to ensure relevance of forecast with market scenario. With increasing need to granulized information, we used bottom-up methodology for forecasting where we evaluate each regional segment differently and combined all forecast to develop final market forecast.
Data Validation
We believe primary research is a very important tool in analyzing and forecasting different markets. In order to make sure accuracy of our findings, our team conducts primary interviews at every stage of research to gain deep insights into current business environment and future trends and key developments in market. This includes use of various methods such as telephonic interviews, focus groups, face to face interviews and questionnaires to validate our research from all aspects. We validate our data through primary research from key industry leaders such as CEO, product managers, marketing managers, suppliers, distributors, and consumers are frequently interviewed. These interviews provide valuable insights which help us to have better market understanding besides validating our estimates and forecast.
Data Triangulation

Industry Analysis
|
Qualitative Data |
Quantitative Data (2017-2025) |
|
|