Galacto-oligosaccharide GOS Market by Application - Global Industry Analysis and Forecast to 2022
Published On : September 2017 Pages : 82 Category: Renewable Chemicals Report Code : CM09223
Industry Outlook and Trend Analysis
The Galacto-oligosaccharide GOS market was valued around USD 0.56 billion in 2017 and is expected to reach roughly USD 1.13 billion by the end of 2022 while registering itself at a compound annual growth rate (CAGR) of 8.01% during the forecast period. The product contains elements that are similar to the human milk; hence it renders high level of nutrition to the infant. A few oligosaccharides including lactosucrose, galacto-oligosaccharides, lactitol, and lactulose are retrieved from lactose as crude material. Lactose is the prime milk sugar, however, there are other carbohydrates and saccharides present in small amounts as well. The Food and Drug Administration of the United States acknowledges galacto-oligosaccharide to be safe for utilization and have given it the Generally Recognized as Safe (GRAS) status under the act of Federal Food, Drug, and Cosmetic. As per a regulation, the product is said to be helpful in decreasing pathogenic microorganisms and gastrointestinal issues. Significant assembling organizations have been concentrating on creating GOS with particular fixation and application in a financially savvy manner.
Application Outlook and Trend Analysis
The demand in the global Galacto-oligosaccharide market was dominated by food and beverages that is registered for more than 90 percent of the share in 2017. Rising requirements for cereals, ice-creams and dairy products is anticipated to duel the demand of the product. Rising awareness among consumers that is associated with adopting a healthy diet is expected to boost the demand in the following years. The product assists in enhancing the digestive health of aged consumers that increases the demand of protected food in consumers of all age groups. The product being given the GRAS status is said to fuel its utilization in products such as milk beverages, bars, fruit preparations, waters or quenchers, baby foods and dairy products. The segment of dietary supplement is anticipated to encounter substantial growth. It possesses the ability to improve the immune system in humans which is one of the major factors that boosts the growth of this market. Stationary working style combined with expanded anxiety is probably going to fuel the requirement of the product over the estimated time frame. Rising disposable income in employed women in developing countries like China and India is expected to boost the dietary supplement segment.
Regional Outlook and Trend Analysis
The biggest market in 2017 was Europe that registered for a share of more than 50 percent, on the basis of profit. Surging geriatric population along with the emergence of various infant formula companies is expected to boost the demand over the forecast period. The dominant consumers and manufacturers of galacto-oligosaccharide are Japan and Europe. As per the year 2017, the global galacto-oligosaccharide manufacturing and development activity was dominated by Japanese organizations. European enthusiasm for galacto-oligosaccharide based items has seen a noteworthy ascent with a few organizations right now creating or intending to deliver galacto-oligosaccharide blends. Due to surging population, rising requirement of functional foods and urbanization Asia Pacific is projected to be the fastest developing market. Additionally, the emergence of major companies in this region is anticipated to boost the growth of this market. The increasing demand in North America is due to increasing utilization of milk products that are low in fat like low-fat tea & coffee and yoghurt.
Competitive Insights
Some of the major players in the global galacto-oligosaccharide market are Taiwan Fructose, First Milk, Wuxi, FrieslandCampina, Samyang Optics, Nissin Foods, ABO Swiss Co. Ltd., Yakult Danone India Private Limited, Humana and New Francisco Biotechnology. Research and development speculation and new item advancement is the key procedure being received by the players keeping in mind the end goal to oblige rising interest.
The global galacto-oligosaccharide market is segmented as follows-
By Application
- Dairy Products
- Frozen Dairy Dessert
- Yogurt
- Food Supplements
- Beverages
- Infant Formulas
- Baby Juice
- Infant Meal Replacement Drinks
- Baby Yogurt Drinks
- Baby Dessert
- Baby Snack
- Bakery & Confectionery
- Others
By Region
- North America
- U.S
- Canada
- Mexico
- Europe
- Germany
- France
- UK
- Italy
- Spain
- Rest of Europe
- Asia-Pacific
- Japan
- China
- Australia
- India
- South Korea
- Rest of Asia Pacific
- Rest of the World
- Brazil
- South Africa
- Saudi Arabia
- United Arab Emirates
- Others
Some of the key questions answered by the report are:
- What was the market size in 2017 and forecast from 2017 to 2022?
- What will be the industry market growth from 2017 to 2022?
- What are the major drivers, restraints, opportunities, challenges, and industry trends and their impact on the market forecast?
- What are the major segments leading the market growth and why?
- Which are the leading players in the market and what are the major strategies adopted by them to sustain the market competition?
Market Classification
- Galacto-oligosaccharide GOS Market, By Application, Estimates and Forecast, 2014-2022 ($Million)
- Dairy Products
- Frozen Dairy Dessert
- Yogurt
- Food Supplements
- Beverages
- Infant Formulas
- Baby Juice
- Infant Meal Replacement Drinks
- Baby Yogurt Drinks
- Baby Dessert
- Baby Snack
- Bakery & Confectionery
- Other Applications
- Dairy Products
- Galacto-oligosaccharide GOS Market, By Region, Estimates and Forecast, 2014-2022 ($Million)
- North America
- North America Galacto-oligosaccharide GOS Market, By Country
- North America Galacto-oligosaccharide GOS Market, By Application
- U.S. Galacto-oligosaccharide GOS Market, By Application
- Canada Galacto-oligosaccharide GOS Market, By Application
- Mexico Galacto-oligosaccharide GOS Market, By Application
-
- Europe
- Europe Galacto-oligosaccharide GOS Market, By Country
- Europe Galacto-oligosaccharide GOS Market, By Application
- Germany Galacto-oligosaccharide GOS Market, By Application
- France Galacto-oligosaccharide GOS Market, By Application
- UK Galacto-oligosaccharide GOS Market, By Application
- Italy Galacto-oligosaccharide GOS Market, By Application
- Spain Galacto-oligosaccharide GOS Market, By Application
- Rest of Europe Galacto-oligosaccharide GOS Market, By Application
-
- Asia-Pacific
- Asia-Pacific Galacto-oligosaccharide GOS Market, By Country
- Asia-Pacific Galacto-oligosaccharide GOS Market, By Application
- Japan Galacto-oligosaccharide GOS Market, By Application
- Australia Galacto-oligosaccharide GOS Market, By Application
- India Galacto-oligosaccharide GOS Market, By Application
- South Korea Galacto-oligosaccharide GOS Market, By Application
- Rest of Asia-Pacific Galacto-oligosaccharide GOS Market, By Application
- Asia-Pacific
-
- Rest of the World
- Rest of the World Galacto-oligosaccharide GOS Market, By Country
- Rest of the World Galacto-oligosaccharide GOS Market, By Application
- Brazil Galacto-oligosaccharide GOS Market, By Application
- South Africa Galacto-oligosaccharide GOS Market, By Application
- Saudi Arabia Galacto-oligosaccharide GOS Market, By Application
- Turkey Galacto-oligosaccharide GOS Market, By Application
- United Arab Emirates Galacto-oligosaccharide GOS Market, By Application
- Others Galacto-oligosaccharide GOS Market, By Application
- Rest of the World
Table of Contents
1.Introduction
1.1.Report Description
1.2.Research Methodology
1.2.1. Secondary Research
1.2.2. Primary Research
2.Executive Summary
2.1.Key Highlights
3.Market Overview
3.1.Introduction
3.1.1. Market Definition
3.1.2. Market Segmentation
3.2.Market Share Analysis
3.3.Market Dynamics
3.3.1. Drivers
3.3.1.1.Intensifying consumption of low-fat milk products
3.3.1.2.Growth in infant population
3.3.1.3.Growing awareness regarding health benefits of yogurt
3.3.2. Restraints
3.3.2.1.increasing demand for Isomaltooligosaccharide (IMO)
3.3.3. Opportunities
3.3.3.1.Technological advancement in low-fat milk products
3.4.Industry Trends
4.Galacto-oligosaccharide GOS Market, By Application
4.1.Introduction
4.2.Galacto-oligosaccharide GOS Market Assessment and Forecast, By Application, 2017-2022
4.3.Dairy Products
4.3.1.1.Market Assessment and Forecast, By Type, 2017-2022 ($Million)
4.3.1.2.Market Assessment and Forecast, By Region, 2017-2022 ($Million)
4.3.1.3.Frozen Dairy Dessert
4.3.1.3.1.Market Assessment and Forecast, By Region, 2017-2022 ($Million)
4.3.1.4.Yogurt
4.3.1.4.1.Market Assessment and Forecast, By Region, 2017-2022 ($Million)
4.4.Food Supplements
4.4.1.1.Market Assessment and Forecast, By Region, 2017-2022 ($Million)
4.5.Beverages
4.5.1.1.Market Assessment and Forecast, By Region, 2017-2022 ($Million)
4.6.Infant Formulas
4.6.1.1.1.Market Assessment and Forecast, By Type, 2017-2022 ($Million)
4.6.1.1.2.Market Assessment and Forecast, By Region, 2017-2022 ($Million)
4.6.1.2.Baby Juice
4.6.1.2.1.Market Assessment and Forecast, By Region, 2017-2022 ($Million)
4.6.1.3.Infant Meal Replacement Drinks
4.6.1.3.1.Market Assessment and Forecast, By Region, 2017-2022 ($Million)
4.6.1.4.Baby Yogurt Drinks
4.6.1.4.1.Market Assessment and Forecast, By Region, 2017-2022 ($Million)
4.6.1.5.Baby Dessert
4.6.1.5.1.Market Assessment and Forecast, By Region, 2017-2022 ($Million)
4.6.1.6.Baby Snack
4.6.1.6.1.Market Assessment and Forecast, By Region, 2017-2022 ($Million)
4.7.Bakery & Confectionery
4.7.1.1.Market Assessment and Forecast, By Region, 2017-2022 ($Million)
4.8.Other Applications
4.8.1.1.Market Assessment and Forecast, By Region, 2017-2022 ($Million)
5.Galacto-oligosaccharide GOS Market, By Region
5.1.Introduction
5.2.Galacto-oligosaccharide GOS Market Assessment and Forecast, By Region, 2017-2022 ($Million)
5.3.North America
5.3.1. Market Assessment and Forecast, By Country, 2017-2022 ($Million)
5.3.2. Market Assessment and Forecast, By Application, 2017-2022 ($Million)
5.3.2.1.U.S.
5.3.2.1.1.Market Assessment and Forecast, By Application, 2017-2022 ($Million)
5.3.2.2.Canada
5.3.2.2.1.Market Assessment and Forecast, By Application, 2017-2022 ($Million)
5.3.2.3.Mexico
5.3.2.3.1.Market Assessment and Forecast, By Application, 2017-2022 ($Million)
5.4.Europe
5.4.1. Market Assessment and Forecast, By Country, 2017-2022 ($Million)
5.4.2. Market Assessment and Forecast, By Application, 2017-2022 ($Million)
5.4.2.1.Germany
5.4.2.1.1.Market Assessment and Forecast, By Application, 2017-2022 ($Million)
5.4.2.2.France
5.4.2.2.1.Market Assessment and Forecast, By Application, 2017-2022 ($Million)
5.4.2.3.UK
5.4.2.3.1.Market Assessment and Forecast, By Application, 2017-2022 ($Million)
5.4.2.4.Italy
5.4.2.4.1.Market Assessment and Forecast, By Application, 2017-2022 ($Million)
5.4.2.5.Spain
5.4.2.5.1.Market Assessment and Forecast, By Application, 2017-2022 ($Million)
5.4.2.6.Russia
5.4.2.6.1.Market Assessment and Forecast, By Application, 2017-2022 ($Million)
5.4.2.7.Rest of Europe
5.4.2.7.1.Market Assessment and Forecast, By Application, 2017-2022 ($Million)
5.5.Asia-Pacific
5.5.1. Market Assessment and Forecast, By Country, 2017-2022 ($Million)
5.5.2. Market Assessment and Forecast, By Application, 2017-2022 ($Million)
5.5.2.1.Japan
5.5.2.1.1.Market Assessment and Forecast, By Application, 2017-2022 ($Million)
5.5.2.2.China
5.5.2.2.1.Market Assessment and Forecast, By Application, 2017-2022 ($Million)
5.5.2.3.Australia
5.5.2.3.1.Market Assessment and Forecast, By Application, 2017-2022 ($Million)
5.5.2.4.India
5.5.2.4.1.Market Assessment and Forecast, By Application, 2017-2022 ($Million)
5.5.2.5.South Korea
5.5.2.5.1.Market Assessment and Forecast, By Application, 2017-2022 ($Million)
5.5.2.6.Taiwan
5.5.2.6.1.Market Assessment and Forecast, By Application, 2017-2022 ($Million)
5.5.2.7.Rest of Asia-Pacific
5.5.2.7.1.Market Assessment and Forecast, By Application, 2017-2022 ($Million)
5.6.Rest of the World
5.6.1. Market Assessment and Forecast, By Country, 2017-2022 ($Million)
5.6.2. Market Assessment and Forecast, By Application, 2017-2022 ($Million)
5.6.2.1.Brazil
5.6.2.1.1.Market Assessment and Forecast, By Application, 2017-2022 ($Million)
5.6.2.2.Turkey
5.6.2.2.1.Market Assessment and Forecast, By Application, 2017-2022 ($Million)
5.6.2.3.Saudi Arabia
5.6.2.3.1.Market Assessment and Forecast, By Application, 2017-2022 ($Million)
5.6.2.4.South Africa
5.6.2.4.1.Market Assessment and Forecast, By Application, 2017-2022 ($Million)
5.6.2.5.United Arab Emirates
5.6.2.5.1.Market Assessment and Forecast, By Application, 2017-2022 ($Million)
5.6.2.6.Others
5.6.2.6.1.Market Assessment and Forecast, By Application, 2017-2022 ($Million)
6.Company Profiles
6.1.Yakult Honsha
6.1.1. Business Overview
6.1.2. Product Portfolio
6.1.3. Key Financials
6.1.4. Strategic Developments
6.2.Royal FrieslandCampina
6.2.1. Business Overview
6.2.2. Product Portfolio
6.2.3. Key Financials
6.2.4. Strategic Developments
6.3.Ingredion group of companies
6.3.1. Business Overview
6.3.2. Product Portfolio
6.3.3. Key Financials
6.3.4. Strategic Developments
6.4.First Milk Ltd.
6.4.1. Business Overview
6.4.2. Product Portfolio
6.4.3. Key Financials
6.4.4. Strategic Developments
6.5.Taiwan Fructose
6.5.1. Business Overview
6.5.2. Product Portfolio
6.5.3. Strategic Developments
6.6.WuXi AppTec
6.6.1. Business Overview
6.6.2. Product Portfolio
6.6.3. Strategic Developments
6.7.Kowa Europe GmbH
6.7.1. Business Overview
6.7.2. Product Portfolio
6.7.3. Strategic Developments
List of Tables
Table 1.Galacto-oligosaccharide GOS Market, By Application ($Million), 2017-2022
Table 2.Dairy Products Market, By Region ($Million), 2017-2022
Table 3.Frozen Dairy Dessert Market, By Region ($Million), 2017-2022
Table 4.Yogurt Market, By Region ($Million), 2017-2022
Table 5.Food Supplements Market, By Region ($Million), 2017-2022
Table 6.Beverages Market, By Region ($Million), 2017-2022
Table 7.Infant Formulas Market, By Region ($Million), 2017-2022
Table 8.Baby Juice Market, By Region ($Million), 2017-2022
Table 9.Infant Meal Replacement Drinks Market, By Region ($Million), 2017-2022
Table 10.Baby Yogurt Drinks Market, By Region ($Million), 2017-2022
Table 11.Baby Dessert Market, By Region ($Million), 2017-2022
Table 12.Baby Snack Market, By Region ($Million), 2017-2022
Table 13.Bakery & Confectionery Market, By Region ($Million), 2017-2022
Table 14.Other Applications Market, By Region ($Million), 2017-2022
Table 15.Galacto-oligosaccharide GOS Market, By Region ($Million), 2017-2022
Table 16.North America Galacto-oligosaccharide GOS Market, By Country, 2017-2022 ($Million)
Table 17.North America Galacto-oligosaccharide GOS Market, By Application, 2017-2022 ($Million)
Table 18.U.S. Galacto-oligosaccharide GOS Market, By Application, 2017-2022 ($Million)
Table 19.Canada Galacto-oligosaccharide GOS Market, By Application, 2017-2022 ($Million)
Table 20.Mexico Galacto-oligosaccharide GOS Market, By Application, 2017-2022 ($Million)
Table 21.Europe Galacto-oligosaccharide GOS Market, By Country, 2017-2022 ($Million)
Table 22.Europe Galacto-oligosaccharide GOS Market, By Application, 2017-2022 ($Million)
Table 23.Germany Galacto-oligosaccharide GOS Market, By Application, 2017-2022 ($Million)
Table 24.France Galacto-oligosaccharide GOS Market, By Application, 2017-2022 ($Million)
Table 25.UK Galacto-oligosaccharide GOS Market, By Application, 2017-2022 ($Million)
Table 26.Italy Galacto-oligosaccharide GOS Market, By Application, 2017-2022 ($Million)
Table 27.Spain Galacto-oligosaccharide GOS Market, By Application, 2017-2022 ($Million)
Table 28.Russia Galacto-oligosaccharide GOS Market, By Application, 2017-2022 ($Million)
Table 29.Rest of Europe Galacto-oligosaccharide GOS Market, By Application, 2017-2022 ($Million)
Table 30.Asia-Pacific Galacto-oligosaccharide GOS Market, By Country, 2017-2022 ($Million)
Table 31.Asia-Pacific Galacto-oligosaccharide GOS Market, By Application, 2017-2022 ($Million)
Table 32.Japan Galacto-oligosaccharide GOS Market, By Application, 2017-2022 ($Million)
Table 33.China Galacto-oligosaccharide GOS Market, By Application, 2017-2022 ($Million)
Table 34.Australia Galacto-oligosaccharide GOS Market, By Application, 2017-2022 ($Million)
Table 35.India Galacto-oligosaccharide GOS Market, By Application, 2017-2022 ($Million)
Table 36.South Korea Galacto-oligosaccharide GOS Market, By Application, 2017-2022 ($Million)
Table 37.Taiwan Galacto-oligosaccharide GOS Market, By Application, 2017-2022 ($Million)
Table 38.Rest of Asia-Pacific Galacto-oligosaccharide GOS Market, By Application, 2017-2022 ($Million)
Table 39.Rest of the World Galacto-oligosaccharide GOS Market, By Country, 2017-2022 ($Million)
Table 40.Rest of the World Galacto-oligosaccharide GOS Market, By Application, 2017-2022 ($Million)
Table 41.Brazil Galacto-oligosaccharide GOS Market, By Application, 2017-2022 ($Million)
Table 42.Turkey Galacto-oligosaccharide GOS Market, By Application, 2017-2022 ($Million)
Table 43.Saudi Arabia Galacto-oligosaccharide GOS Market, By Application, 2017-2022 ($Million)
Table 44.South Africa Galacto-oligosaccharide GOS Market, By Application, 2017-2022 ($Million)
Table 45.United Arab Emirates Galacto-oligosaccharide GOS Market, By Application, 2017-2022 ($Million)
Table 46.Others Galacto-oligosaccharide GOS Market, By Application, 2017-2022 ($Million)
Table 47.Yakult Honsha: Key Strategic Developments, 2017-2017
Table 48.Royal FrieslandCampina: Key Strategic Developments, 2017-2017
Table 49.Ingredion group of companies: Key Strategic Developments, 2017-2017
Table 50.First Milk Ltd.: Key Strategic Developments, 2017-2017
Table 51.Taiwan Fructose: Key Strategic Developments, 2017-2017
Table 52.WuXi AppTec: Key Strategic Developments, 2017-2017
Table 53.Kowa Europe GmbH: Key Strategic Developments, 2017-2017
List of Figures
Figure 1.Galacto-oligosaccharide GOS Market, By Application, 2017 & 2022 ($Million)
Figure 2.Galacto-oligosaccharide GOS Market, By Region, 2017, ($Million)
Figure 3.Yakult Honsha: Net Revenues, 2017-2017 ($Million)
Figure 4.Yakult Honsha: Net Revenue Share, By Segment, 2017
Figure 5.Yakult Honsha: Net Revenue Share, By Geography, 2017
Figure 6.Royal FrieslandCampina: Net Revenues, 2017-2017 ($Million)
Figure 7.Royal FrieslandCampina: Net Revenue Share, By Segment, 2017
Figure 8.Royal FrieslandCampina: Net Revenue Share, By Geography, 2017
Figure 9.Ingredion group of companies: Net Revenues, 2017-2017 ($Million)
Figure 10.Ingredion group of companies: Net Revenue Share, By Segment, 2017
Figure 11.Ingredion group of companies: Net Revenue Share, By Geography, 2017
Figure 12.First Milk Ltd.: Net Revenues, 2017-2017 ($Million)
Figure 13.First Milk Ltd.: Net Revenue Share, By Segment, 2017
Figure 14.First Milk Ltd.: Net Revenue Share, By Geography, 2017
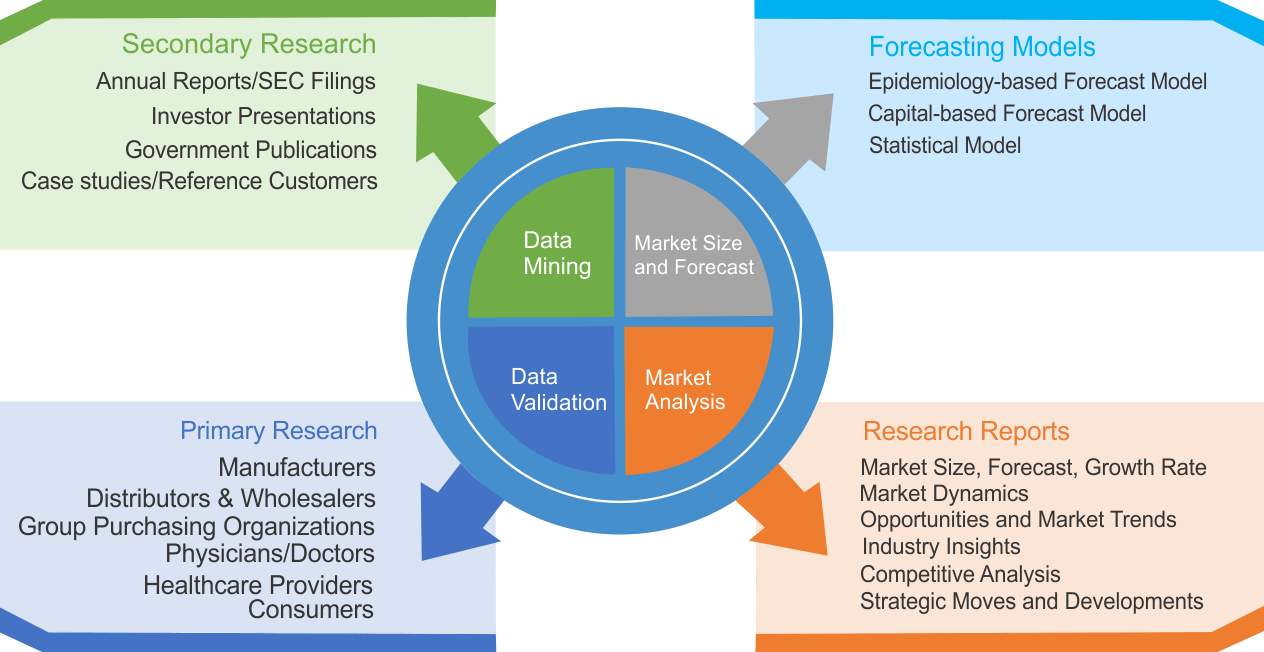
Research Methodology
We use both primary as well as secondary research for our market surveys, estimates and for developing forecast. Our research process commence by analyzing the problem which enable us to design the scope for our research study. Our research process is uniquely designed with enough flexibility to adjust according to changing nature of products and markets, while retaining core element to ensure reliability and accuracy in research findings. We understand both macro and micro-economic factors to evaluate and forecast different market segments.
Data Mining
Data is extensively collected through various secondary sources such as annual reports, investor presentations, SEC filings, and other corporate publications. We also refer trade magazines, technical journals, paid databases such as Factiva and Bloomberg, industry trade journals, scientific journals, and social media data to understand market dynamics and industry trends. Further, we also conduct primary research to understand market drivers, restraints, opportunities, challenges, and competitive scenario to build our analysis.
Data Collection Matrix
|
Data Collection Matrix |
Supply Side |
Demand Side |
|
Primary Data Sources |
|
|
|
Secondary Data Sources |
|
|
Market Modeling and Forecasting
We use epidemiology and capital equipment-based models to forecast market size of different segments at country and regional level.
- Epidemiology-based Forecasting Model: This method uses epidemiology data gathered through various publications and from physicians to estimate population of patients, flow of treatment of individual disease and therapies. The data collected through this method includes statics on incidence of disease, population suffering from disease, and treatment population. This method is used to understand:
- Number of patients for particular device or medical procedure and
- Repeated use of particular device depending on health and condition of patient
- Capital-based Forecasting Model: This method of forecasting is based on number of replacements, installed-based and new sales of capital equipment used in various healthcare and diagnostic centers. These three parameters are calculated and forecast is developed. Installation base is calculated as average number of units per facility; while sales for particular year is calculated from number of new and replace units. Secondary data is collected through various supply chain intermediaries and opinion leaders to arrive at installation and sales rate. These techniques help our analysts in validating market and developed market estimates and forecast.
We do forecast on basis of several parameters such as market drivers, market opportunities, industry trends government regulations, raw materials supply and trade dynamics to ensure relevance of forecast with market scenario. With increasing need to granulized information, we used bottom-up methodology for forecasting where we evaluate each regional segment differently and combined all forecast to develop final market forecast.
Data Validation
We believe primary research is a very important tool in analyzing and forecasting different markets. In order to make sure accuracy of our findings, our team conducts primary interviews at every stage of research to gain deep insights into current business environment and future trends and key developments in market. This includes use of various methods such as telephonic interviews, focus groups, face to face interviews and questionnaires to validate our research from all aspects. We validate our data through primary research from key industry leaders such as CEO, product managers, marketing managers, suppliers, distributors, and consumers are frequently interviewed. These interviews provide valuable insights which help us to have better market understanding besides validating our estimates and forecast.
Data Triangulation
Industry Analysis
|
Qualitative Data |
Quantitative Data (2017-2025) |
|
|