Dimer Acid Market by Product Type and Application - Global Industry Analysis and Forecast to 2027
Published On : September 2017 Pages : 82 Category: Renewable Chemicals Report Code : CM09213
Industry Trend Analysis
The global Dimer Acid market was valued at USD 1.43 billion in the year of 2017 and is anticipated to reach approximately USD 2.57 billion by 2027, while registering itself at a compound annual growth rate (CAGR) of 6.70% during the forecast period. Increasing demand for polyamide resins in adhesives and coatings industries is anticipated to be a major driving factor for market industry growth during the forecast years. Emerging regions in Asia Pacific, Central, and South America are estimated to witness significant growth during the forecast period together accounting for around 45% share of the global market by 2027. Growing urbanization in Mexico, China, Russia, South Africa, Brazil, and India has eased the requirement of better residential and public infrastructure. These regions are also distinguished by escalating production facilities further alleviating construction activities. Rising construction expenditure, especially by the government, in emerging countries is projected to boost the demand for polyamide resins in construction materials and adhesives, thus nurturing dimer acid market growth. Oilfield chemicals find the extensive scope of application in gas and oil extraction and treating activities and other uses such as hydraulic fracturing, well drilling, and refining. Major oilfield chemicals that make use of dimer acid as a raw material involve wetting agents, corrosion & scale inhibitors, demulsifiers, and surfactants. The change in trend from energy importations to domestic energy production, to turn into self-sufficient and fulfill the rising energy demand in developing countries is also prone to promote dimer acid applications. The escalating number of drilling across the world to fulfill extra energy demand is anticipated to optimistically impact oilfield chemicals and dimer acid demand. Increasing crude oil production and its consumption in countries like the United States, Canada, China and other Middle Eastern nations is also projected to fuel oilfield chemicals demand. These factors are a vital determining factor of the market growth for dimer acid. Escalating shipping industry and water transport are assured to drive the demand for marine coatings. Marine coatings are increasingly using dimer acid in the structure of acid depend upon polyamide resins for superior coatings performance. This trend is projected to fuel dimer acid requirement over the forecast years. Vegetable oils such as corn and soybean are experiencing high demand from the biofuels and food industry, ensuing in declining renders for dimer acid manufacturing. Raw material price instability due to restricted supply is projected to hamper the growth. Though, encouraging regulations from authorities such as REACH and EPA are estimated to offer huge opportunities to key participants during the forecast years.
Application Outlook and Trend Analysis
Reactive polyamide resins egressed as the biggest application section with a volume anticipated at around 190-kilo tons in 2017. The growth of the segment is motivated by rising demand for these resins in the construction field, particularly in floor & epoxies coatings to improve performance. It is also projected to appear as the top application, mounting at significant compound annual growth rate over the forecast years. Nonreactive polyamide resins section is anticipated to show substantial growth in the near future, on account of increasing applications in a range of paper coatings, flexographic printing inks, and industrial solvents. The segment described for 40% of the total market volume in 2017 as well as expected to witness high compound annual growth rate.
Regional Outlook and Trend Analysis
Asia Pacific dimer acid market has led the global market industry and calculated for over 40% of the overall volume in 2017. It is anticipated to preserve its governance over the forecast years, rising at steady compound annual growth rate during forecast timeline. Expansion in construction activities together with encouraging government initiatives and regulations in the region boosting manufacturing is likely to drive dimer acid demand as well. North America is predicted to witness intermediate growth owing to rising construction expenditure in Mexico together with the recuperation of housing division post-recession. It is also likely to benefit from escalating shale gas extraction and crude oil production in the United States.
Competitive Insights
The global market industry is greatly focused on four key companies reporting for around 45% of the total market volume. Some of the major players in global dimer acid market involve, Arizona Chemicals, Florachem Corp., Aturex Group, BASF, Emery Oleochemicals, Oleon N.V., Novepha Co. Ltd., Anqing Hongyu Chemical Co. Ltd., Nissan Chemical America Corp. and Harima Chemicals.
The global dimer acid market is segmented as follows-
By Product Type
- Standard
- Distilled
- Distilled & hydrogenated
By Application
- Non-reactive polyamides
- Reactive polyamides
- Oilfield chemicals
- Other Applications
By Region
- North America
- U.S
- Canada
- Mexico
- Europe
- Germany
- France
- UK
- Italy
- Spain
- Rest of Europe
- Asia-Pacific
- Japan
- China
- Australia
- India
- South Korea
- Rest of Asia Pacific
- Rest of the World
- Brazil
- South Africa
- Saudi Arabia
- United Arab Emirates
- Others
Some of the key questions answered by the report are:
- What was the market size in 2017 and forecast from 2022 to 2027?
- What will be the industry market growth from 2022 to 2027?
- What are the major drivers, restraints, opportunities, challenges, and industry trends and their impact on the market forecast?
- What are the major segments leading the market growth and why?
- Which are the leading players in the market and what are the major strategies adopted by them to sustain the market competition?
Market Classification
- Dimer Acid, By Product Type, Estimates and Forecast, 2017-2027 ($Million)
- Standard
- Distilled
- Distilled & hydrogenated
- Dimer Acid, By Application, Estimates and Forecast, 2017-2027 ($Million)
- Non-reactive polyamides
- Reactive polyamides
- Oilfield chemicals
- Other Applications
- Dimer Acid, By Region, Estimates and Forecast, 2017-2027 ($Million)
- North America
- North America Dimer Acid, By Country
- North America Dimer Acid, By Product Type
- North America Dimer Acid, By Application
- U.S. Dimer Acid, By Product Type
- U.S. Dimer Acid, By Application
- Canada Dimer Acid, By Product Type
- Canada Dimer Acid, By Application
- Mexico Dimer Acid, By Product Type
- Mexico Dimer Acid, By Application
-
- Europe
- Europe Dimer Acid, By Country
- Europe Dimer Acid, By Product Type
- Europe Dimer Acid, By Application
- Germany Dimer Acid, By Product Type
- Germany Dimer Acid, By Application
- France Dimer Acid, By Product Type
- France Dimer Acid, By Application
- UK Dimer Acid, By Product Type
- UK Dimer Acid, By Application
- Italy Dimer Acid, By Product Type
- Italy Dimer Acid, By Application
- Spain Dimer Acid, By Product Type
- Spain Dimer Acid, By Application
- Rest of Europe Dimer Acid, By Product Type
- Rest of Europe Dimer Acid, By Application
-
- Asia-Pacific
- Asia-Pacific Dimer Acid, By Country
- Asia-Pacific Dimer Acid, By Product Type
- Asia-Pacific Dimer Acid, By Application
- Japan Dimer Acid, By Product Type
- Japan Dimer Acid, By Application
- Australia Dimer Acid, By Product Type
- Australia Dimer Acid, By Application
- India Dimer Acid, By Product Type
- India Dimer Acid, By Application
- South Korea Dimer Acid, By Product Type
- South Korea Dimer Acid, By Application
- Rest of Asia-Pacific Dimer Acid, By Product Type
- Rest of Asia-Pacific Dimer Acid, By Application
- Asia-Pacific
-
- Rest of the World
- Rest of the World Dimer Acid, By Country
- Rest of the World Dimer Acid, By Product Type
- Rest of the World Dimer Acid, By Application
- Brazil Dimer Acid, By Product Type
- Brazil Dimer Acid, By Application
- South Africa Dimer Acid, By Product Type
- South Africa Dimer Acid, By Application
- Saudi Arabia Dimer Acid, By Product Type
- Saudi Arabia Dimer Acid, By Application
- Turkey Dimer Acid, By Product Type
- Turkey Dimer Acid, By Application
- United Arab Emirates Dimer Acid, By Product Type
- United Arab Emirates Dimer Acid, By Application
- Others Dimer Acid, By Product Type
- Others Dimer Acid, By Application
- Rest of the World
Table of Contents
1.Introduction
1.1.Report Description
1.2.Research Methodology
1.2.1. Secondary Research
1.2.2. Primary Research
2.Executive Summary
2.1.Key Highlights
3.Market Overview
3.1.Introduction
3.1.1. Market Definition
3.1.2. Market Segmentation
3.2.Market Share Analysis
3.3.Market Dynamics
3.3.1. Drivers
3.3.1.1.Increasing demand of Oilfield Chemicals
3.3.1.2.Growing construction expenditure in developing economies
3.3.2. Restraints
3.3.2.1.Upsurge prices of Raw material
3.3.3. Opportunities
3.3.3.1.Technological Advancement in Construction field
3.4.Industry Trends
4.Dimer Acid Market, By Product Type
4.1.Introduction
4.2.Dimer Acid Market Assessment and Forecast, By Product Type, 2017-2027
4.3.Standard
4.3.1. Market Assessment and Forecast, By Region, 2017-2027 ($Million)
4.4.Distilled
4.4.1. Market Assessment and Forecast, By Region, 2017-2027 ($Million)
4.5.Distilled & hydrogenated
4.5.1. Market Assessment and Forecast, By Region, 2017-2027 ($Million)
5.Dimer Acid Market, By Application
5.1.Introduction
5.2.Dimer Acid Market Assessment and Forecast, By Application, 2017-2027 ($Million)
5.3.Non-reactive polyamides
5.3.1.1.Market Assessment and Forecast, By Region, 2017-2027 ($Million)
5.4.Reactive polyamides
5.4.1.1.Market Assessment and Forecast, By Region, 2017-2027 ($Million)
5.5.Oilfield chemicals
5.5.1.1.Market Assessment and Forecast, By Region, 2017-2027 ($Million)
5.6.Other Applications
5.6.1. Market Assessment and Forecast, By Region, 2017-2027 ($Million)
6.Dimer Acid Market, By Region
6.1.Introduction
6.2.Dimer Acid Market Assessment and Forecast, By Region, 2017-2027 ($Million)
6.3.North America
6.3.1. Market Assessment and Forecast, By Country, 2017-2027 ($Million)
6.3.2. Market Assessment and Forecast, By Product Type, 2017-2027 ($Million)
6.3.3. Market Assessment and Forecast, By Application, 2017-2027 ($Million)
6.3.3.1.U.S.
6.3.3.1.1.Market Assessment and Forecast, By Product Type, 2017-2027 ($Million)
6.3.3.1.2.Market Assessment and Forecast, By Application, 2017-2027 ($Million)
6.3.3.1.3.
6.3.3.2.Canada
6.3.3.2.1.Market Assessment and Forecast, By Product Type, 2017-2027 ($Million)
6.3.3.2.2.Market Assessment and Forecast, By Application, 2017-2027 ($Million)
6.3.3.3.Mexico
6.3.3.3.1.Market Assessment and Forecast, By Product Type, 2017-2027 ($Million)
6.3.3.3.2.Market Assessment and Forecast, By Application, 2017-2027 ($Million)
6.4.Europe
6.4.1. Market Assessment and Forecast, By Country, 2017-2027 ($Million)
6.4.2. Market Assessment and Forecast, By Product Type, 2017-2027 ($Million)
6.4.3. Market Assessment and Forecast, By Application, 2017-2027 ($Million)
6.4.3.1.Germany
6.4.3.1.1.Market Assessment and Forecast, By Product Type, 2017-2027 ($Million)
6.4.3.1.2.Market Assessment and Forecast, By Application, 2017-2027 ($Million)
6.4.3.2.France
6.4.3.2.1.Market Assessment and Forecast, By Product Type, 2017-2027 ($Million)
6.4.3.2.2.Market Assessment and Forecast, By Application, 2017-2027 ($Million)
6.4.3.3.UK
6.4.3.3.1.Market Assessment and Forecast, By Product Type, 2017-2027 ($Million)
6.4.3.3.2.Market Assessment and Forecast, By Application, 2017-2027 ($Million)
6.4.3.4.Italy
6.4.3.4.1.Market Assessment and Forecast, By Product Type, 2017-2027 ($Million)
6.4.3.4.2.Market Assessment and Forecast, By Application, 2017-2027 ($Million)
6.4.3.5.Spain
6.4.3.5.1.Market Assessment and Forecast, By Product Type, 2017-2027 ($Million)
6.4.3.5.2.Market Assessment and Forecast, By Application, 2017-2027 ($Million)
6.4.3.6.Russia
6.4.3.6.1.Market Assessment and Forecast, By Product Type, 2017-2027 ($Million)
6.4.3.6.2.Market Assessment and Forecast, By Application, 2017-2027 ($Million)
6.4.3.7.Rest of Europe
6.4.3.7.1.Market Assessment and Forecast, By Product Type, 2017-2027 ($Million)
6.4.3.7.2.Market Assessment and Forecast, By Application, 2017-2027 ($Million)
6.5.Asia-Pacific
6.5.1. Market Assessment and Forecast, By Country, 2017-2027 ($Million)
6.5.2. Market Assessment and Forecast, By Product Type, 2017-2027 ($Million)
6.5.3. Market Assessment and Forecast, By Application, 2017-2027 ($Million)
6.5.3.1.Japan
6.5.3.1.1.Market Assessment and Forecast, By Product Type, 2017-2027 ($Million)
6.5.3.1.2.Market Assessment and Forecast, By Application, 2017-2027 ($Million)
6.5.3.2.China
6.5.3.2.1.Market Assessment and Forecast, By Product Type, 2017-2027 ($Million)
6.5.3.2.2.Market Assessment and Forecast, By Application, 2017-2027 ($Million)
6.5.3.3.Australia
6.5.3.3.1.Market Assessment and Forecast, By Product Type, 2017-2027 ($Million)
6.5.3.3.2.Market Assessment and Forecast, By Application, 2017-2027 ($Million)
6.5.3.4.India
6.5.3.4.1.Market Assessment and Forecast, By Product Type, 2017-2027 ($Million)
6.5.3.4.2.Market Assessment and Forecast, By Application, 2017-2027 ($Million)
6.5.3.5.South Korea
6.5.3.5.1.Market Assessment and Forecast, By Product Type, 2017-2027 ($Million)
6.5.3.5.2.Market Assessment and Forecast, By Application, 2017-2027 ($Million)
6.5.3.6.Taiwan
6.5.3.6.1.Market Assessment and Forecast, By Product Type, 2017-2027 ($Million)
6.5.3.6.2.Market Assessment and Forecast, By Application, 2017-2027 ($Million)
6.5.3.7.Rest of Asia-Pacific
6.5.3.7.1.Market Assessment and Forecast, By Product Type, 2017-2027 ($Million)
6.5.3.7.2.Market Assessment and Forecast, By Application, 2017-2027 ($Million)
6.6.Rest of the World
6.6.1. Market Assessment and Forecast, By Country, 2017-2027 ($Million)
6.6.2. Market Assessment and Forecast, By Product Type, 2017-2027 ($Million)
6.6.3. Market Assessment and Forecast, By Application, 2017-2027 ($Million)
6.6.3.1.Brazil
6.6.3.1.1.Market Assessment and Forecast, By Product Type, 2017-2027 ($Million)
6.6.3.1.2.Market Assessment and Forecast, By Application, 2017-2027 ($Million)
6.6.3.2.Turkey
6.6.3.2.1.Market Assessment and Forecast, By Product Type, 2017-2027 ($Million)
6.6.3.2.2.Market Assessment and Forecast, By Application, 2017-2027 ($Million)
6.6.3.3.Saudi Arabia
6.6.3.3.1.Market Assessment and Forecast, By Product Type, 2017-2027 ($Million)
6.6.3.3.2.Market Assessment and Forecast, By Application, 2017-2027 ($Million)
6.6.3.4.South Africa
6.6.3.4.1.Market Assessment and Forecast, By Product Type, 2017-2027 ($Million)
6.6.3.4.2.Market Assessment and Forecast, By Application, 2017-2027 ($Million)
6.6.3.5.United Arab Emirates
6.6.3.5.1.Market Assessment and Forecast, By Product Type, 2017-2027 ($Million)
6.6.3.5.2.Market Assessment and Forecast, By Application, 2017-2027 ($Million)
6.6.3.6.Others
6.6.3.6.1.Market Assessment and Forecast, By Product Type, 2017-2027 ($Million)
6.6.3.6.2.Market Assessment and Forecast, By Application, 2017-2027 ($Million)
7.Company Profiles
7.1.Croda International Plc
7.1.1. Business Overview
7.1.2. Product Portfolio
7.1.3. Key Financials
7.1.4. Strategic Developments
7.2.Arizona Chemical Company, LLC.
7.2.1. Business Overview
7.2.2. Product Portfolio
7.2.3. Strategic Developments
7.3.BASF SE
7.3.1. Business Overview
7.3.2. Product Portfolio
7.3.3. Key Financials
7.3.4. Strategic Developments
7.4.Harima Chemicals Group, Inc.
7.4.1. Business Overview
7.4.2. Product Portfolio
7.4.3. Key Financials
7.4.4. Strategic Developments
7.5.Shandong Huijin Chemical Co., Ltd
7.5.1. Business Overview
7.5.2. Product Portfolio
7.5.3. Strategic Developments
7.6.Jiangsu Yonglin Oleochemical Co., Ltd.
7.6.1. Business Overview
7.6.2. Product Portfolio
7.6.3. Strategic Developments
7.7.Florachem Corporation
7.7.1. Business Overview
7.7.2. Product Portfolio
7.7.3. Strategic Developments
7.8.Fujian Liancheng Baixin Science and Technology Co.,Ltd.
7.8.1. Business Overview
7.8.2. Product Portfolio
7.8.3. Strategic Developments
7.9.Oleon N.V.
7.9.1. Business Overview
7.9.2. Product Portfolio
7.9.3. Strategic Developments
7.10.Emery Oleochemicals
7.10.1.Business Overview
7.10.2.Product Portfolio
7.10.3.Strategic Developments
7.11.NISSAN CHEMICAL INDUSTRIES. LTD.
7.11.1.Business Overview
7.11.2.Product Portfolio
7.11.3.Key Financials
7.11.4.Strategic Developments
7.12.Jarchem Industries Inc.
7.12.1.Business Overview
7.12.2.Product Portfolio
7.12.3.Strategic Developments
List of Tables
Table 1.Dimer Acid Market, By Product Type ($Million), 2017-2025
Table 2.Standard Market, By Region ($Million), 2017-2025
Table 3.Distilled Market, By Region ($Million), 2017-2025
Table 4.Distilled & hydrogenated Market, By Region ($Million), 2017-2025
Table 5.Dimer Acid Market, By Application ($Million), 2017-2025
Table 6.Non-reactive polyamides Market, By Region ($Million), 2017-2025
Table 7.Reactive polyamides Market, By Region ($Million), 2017-2025
Table 8.Oilfield chemicals Market, By Region ($Million), 2017-2025
Table 9.Other Applications Market, By Region ($Million), 2017-2025
Table 10.Dimer Acid Market, By Region ($Million), 2017-2025
Table 11.North America Dimer Acid Market, By Country, 2017-2025 ($Million)
Table 12.North America Dimer Acid Market, By Product Type, 2017-2025 ($Million)
Table 13.North America Dimer Acid Market, By Application, 2017-2025 ($Million)
Table 14.U.S. Dimer Acid Market, By Product Type, 2017-2025 ($Million)
Table 15.U.S. Dimer Acid Market, By Application, 2017-2025 ($Million)
Table 16.Canada Dimer Acid Market, By Product Type, 2017-2025 ($Million)
Table 17.Canada Dimer Acid Market, By Application, 2017-2025 ($Million)
Table 18.Mexico Dimer Acid Market, By Product Type, 2017-2025 ($Million)
Table 19.Mexico Dimer Acid Market, By Application, 2017-2025 ($Million)
Table 20.Europe Dimer Acid Market, By Country, 2017-2025 ($Million)
Table 21.Europe Dimer Acid Market, By Product Type, 2017-2025 ($Million)
Table 22.Europe Dimer Acid Market, By Application, 2017-2025 ($Million)
Table 23.Germany Dimer Acid Market, By Product Type, 2017-2025 ($Million)
Table 24.Germany Dimer Acid Market, By Application, 2017-2025 ($Million)
Table 25.France Dimer Acid Market, By Product Type, 2017-2025 ($Million)
Table 26.France Dimer Acid Market, By Application, 2017-2025 ($Million)
Table 27.UK Dimer Acid Market, By Product Type, 2017-2025 ($Million)
Table 28.UK Dimer Acid Market, By Application, 2017-2025 ($Million)
Table 29.Italy Dimer Acid Market, By Product Type, 2017-2025 ($Million)
Table 30.Italy Dimer Acid Market, By Application, 2017-2025 ($Million)
Table 31.Spain Dimer Acid Market, By Product Type, 2017-2025 ($Million)
Table 32.Spain Dimer Acid Market, By Application, 2017-2025 ($Million)
Table 33.Russia Dimer Acid Market, By Product Type, 2017-2025 ($Million)
Table 34.Russia Dimer Acid Market, By Application, 2017-2025 ($Million)
Table 35.Rest of Europe Dimer Acid Market, By Product Type, 2017-2025 ($Million)
Table 36.Rest of Europe Dimer Acid Market, By Application, 2017-2025 ($Million)
Table 37.Asia-Pacific Dimer Acid Market, By Country, 2017-2025 ($Million)
Table 38.Asia-Pacific Dimer Acid Market, By Product Type, 2017-2025 ($Million)
Table 39.Asia-Pacific Dimer Acid Market, By Application, 2017-2025 ($Million)
Table 40.Japan Dimer Acid Market, By Product Type, 2017-2025 ($Million)
Table 41.Japan Dimer Acid Market, By Application, 2017-2025 ($Million)
Table 42.China Dimer Acid Market, By Product Type, 2017-2025 ($Million)
Table 43.China Dimer Acid Market, By Application, 2017-2025 ($Million)
Table 44.Australia Dimer Acid Market, By Product Type, 2017-2025 ($Million)
Table 45.Australia Dimer Acid Market, By Application, 2017-2025 ($Million)
Table 46.India Dimer Acid Market, By Product Type, 2017-2025 ($Million)
Table 47.India Dimer Acid Market, By Application, 2017-2025 ($Million)
Table 48.South Korea Dimer Acid Market, By Product Type, 2017-2025 ($Million)
Table 49.South Korea Dimer Acid Market, By Application, 2017-2025 ($Million)
Table 50.Taiwan Dimer Acid Market, By Product Type, 2017-2025 ($Million)
Table 51.Taiwan Dimer Acid Market, By Application, 2017-2025 ($Million)
Table 52.Rest of Asia-Pacific Dimer Acid Market, By Product Type, 2017-2025 ($Million)
Table 53.Rest of Asia-Pacific Dimer Acid Market, By Application, 2017-2025 ($Million)
Table 54.Rest of the World Dimer Acid Market, By Country, 2017-2025 ($Million)
Table 55.Rest of the World Dimer Acid Market, By Product Type, 2017-2025 ($Million)
Table 56.Rest of the World Dimer Acid Market, By Application, 2017-2025 ($Million)
Table 57.Brazil Dimer Acid Market, By Product Type, 2017-2025 ($Million)
Table 58.Brazil Dimer Acid Market, By Application, 2017-2025 ($Million)
Table 59.Turkey Dimer Acid Market, By Product Type, 2017-2025 ($Million)
Table 60.Turkey Dimer Acid Market, By Application, 2017-2025 ($Million)
Table 61.Saudi Arabia Dimer Acid Market, By Product Type, 2017-2025 ($Million)
Table 62.Saudi Arabia Dimer Acid Market, By Application, 2017-2025 ($Million)
Table 63.South Africa Dimer Acid Market, By Product Type, 2017-2025 ($Million)
Table 64.South Africa Dimer Acid Market, By Application, 2017-2025 ($Million)
Table 65.United Arab Emirates Dimer Acid Market, By Product Type, 2017-2025 ($Million)
Table 66.United Arab Emirates Dimer Acid Market, By Application, 2017-2025 ($Million)
Table 67.Others Dimer Acid Market, By Product Type, 2017-2025 ($Million)
Table 68.Others Dimer Acid Market, By Application, 2017-2025 ($Million)
Table 69.Croda International Plc: Key Strategic Developments, 2017-2017
Table 70.Arizona Chemical Company, LLC.: Key Strategic Developments, 2017-2017
Table 71.BASF SE: Key Strategic Developments, 2017-2017
Table 72.Harima Chemicals Group, Inc.: Key Strategic Developments, 2017-2017
Table 73.Jiangsu Yonglin Oleochemical Co., Ltd.: Key Strategic Developments, 2017-2017
Table 74.Florachem Corporation: Key Strategic Developments, 2017-2017
Table 75.Fujian Liancheng Baixin Science and Technology Co.,Ltd.: Key Strategic Developments, 2017-2017
Table 76.Oleon N.V.: Key Strategic Developments, 2017-2017
Table 77.Emery Oleochemicals: Key Strategic Developments, 2017-2017
Table 78.NISSAN CHEMICAL INDUSTRIES LTD.: Key Strategic Developments, 2017-2017
Table 79.Jarchem Industries Inc.: Key Strategic Developments, 2017-2017
List of Figures
Figure 1.Dimer Acid Market Share, By Product Type, 2017 & 2025 ($Million)
Figure 3.Dimer Acid Market, By Application, 2017 & 2025 ($Million)
Figure 4.Dimer Acid Market, By Region, 2017, ($Million)
Figure 5.Croda International Plc: Net Revenues, 2017-2017 ($Million)
Figure 6.Croda International Plc: Net Revenue Share, By Segment, 2017
Figure 7.Croda International Plc Net Revenue Share, By Geography, 2017
Figure 8.BASF SE: Net Revenues, 2017-2017 ($Million)
Figure 9.BASF SE: Net Revenue Share, By Segment, 2017
Figure 10 BASF SE: Net Revenue Share, By Geography, 2017
Figure 11.Harima Chemicals Group, Inc.: Net Revenues, 2017-2017 ($Million)
Figure 12.Harima Chemicals Group, Inc.: Net Revenue Share, By Segment, 2017
Figure 13.Harima Chemicals Group, Inc.: Net Revenue Share, By Geography, 2017
Figure 14.NISSAN CHEMICAL INDUSTRIES LTD.: Net Revenues, 2017-2017 ($Million)
Figure 15.NISSAN CHEMICAL INDUSTRIES LTD.: Net Revenue Share, By Segment, 2017
Figure 16.NISSAN CHEMICAL INDUSTRIES LTD.: Net Revenue Share, By Geography, 2017
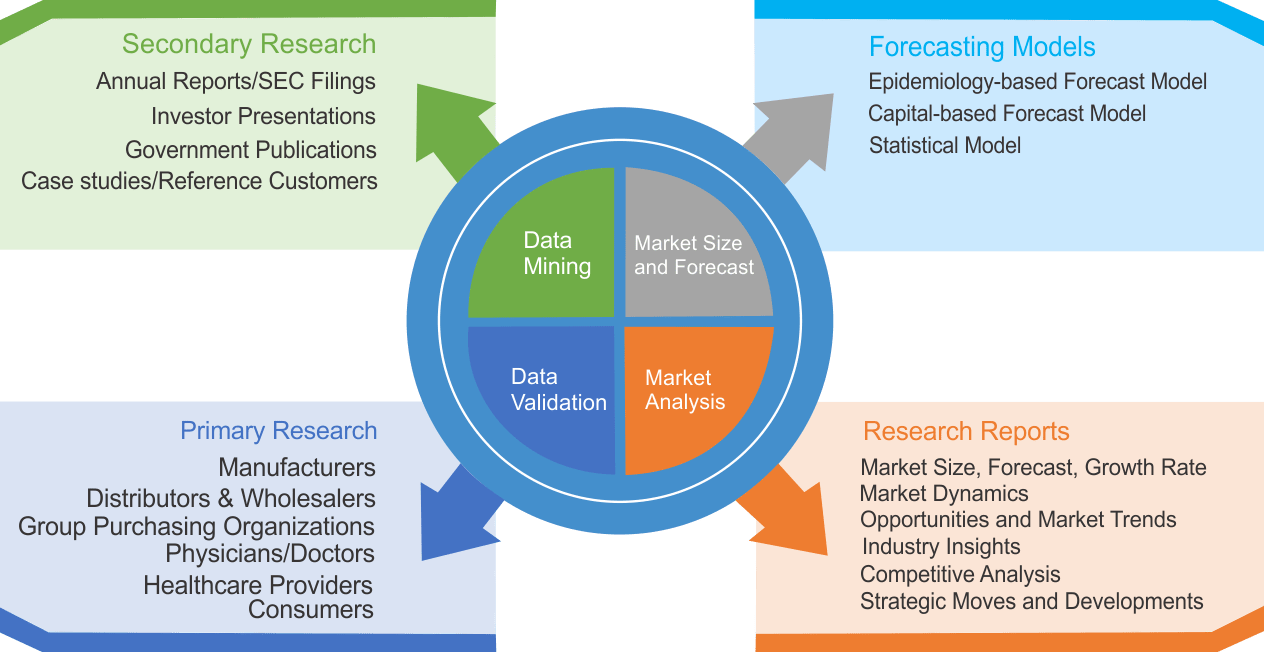
Research Methodology
We use both primary as well as secondary research for our market surveys, estimates and for developing forecast. Our research process commence by analyzing the problem which enable us to design the scope for our research study. Our research process is uniquely designed with enough flexibility to adjust according to changing nature of products and markets, while retaining core element to ensure reliability and accuracy in research findings. We understand both macro and micro-economic factors to evaluate and forecast different market segments.
Data Mining
Data is extensively collected through various secondary sources such as annual reports, investor presentations, SEC filings, and other corporate publications. We also refer trade magazines, technical journals, paid databases such as Factiva and Bloomberg, industry trade journals, scientific journals, and social media data to understand market dynamics and industry trends. Further, we also conduct primary research to understand market drivers, restraints, opportunities, challenges, and competitive scenario to build our analysis.
Data Collection Matrix
|
Data Collection Matrix |
Supply Side |
Demand Side |
|
Primary Data Sources |
|
|
|
Secondary Data Sources |
|
|
Market Modeling and Forecasting
We use epidemiology and capital equipment-based models to forecast market size of different segments at country and regional level.
- Epidemiology-based Forecasting Model: This method uses epidemiology data gathered through various publications and from physicians to estimate population of patients, flow of treatment of individual disease and therapies. The data collected through this method includes statics on incidence of disease, population suffering from disease, and treatment population. This method is used to understand:
- Number of patients for particular device or medical procedure and
- Repeated use of particular device depending on health and condition of patient
- Capital-based Forecasting Model: This method of forecasting is based on number of replacements, installed-based and new sales of capital equipment used in various healthcare and diagnostic centers. These three parameters are calculated and forecast is developed. Installation base is calculated as average number of units per facility; while sales for particular year is calculated from number of new and replace units. Secondary data is collected through various supply chain intermediaries and opinion leaders to arrive at installation and sales rate. These techniques help our analysts in validating market and developed market estimates and forecast.
We do forecast on basis of several parameters such as market drivers, market opportunities, industry trends government regulations, raw materials supply and trade dynamics to ensure relevance of forecast with market scenario. With increasing need to granulized information, we used bottom-up methodology for forecasting where we evaluate each regional segment differently and combined all forecast to develop final market forecast.
Data Validation
We believe primary research is a very important tool in analyzing and forecasting different markets. In order to make sure accuracy of our findings, our team conducts primary interviews at every stage of research to gain deep insights into current business environment and future trends and key developments in market. This includes use of various methods such as telephonic interviews, focus groups, face to face interviews and questionnaires to validate our research from all aspects. We validate our data through primary research from key industry leaders such as CEO, product managers, marketing managers, suppliers, distributors, and consumers are frequently interviewed. These interviews provide valuable insights which help us to have better market understanding besides validating our estimates and forecast.
Data Triangulation
Industry Analysis
|
Qualitative Data |
Quantitative Data (2017-2025) |
|
|