Blood Gas and Electrolyte Analyzers Market By Product, Application and End User- Global Industry Analysis and Forecast to 2022
Published On : October 2017 Pages : 90 Category: Medical Devices Report Code : HC10276
Industry Trend Analysis
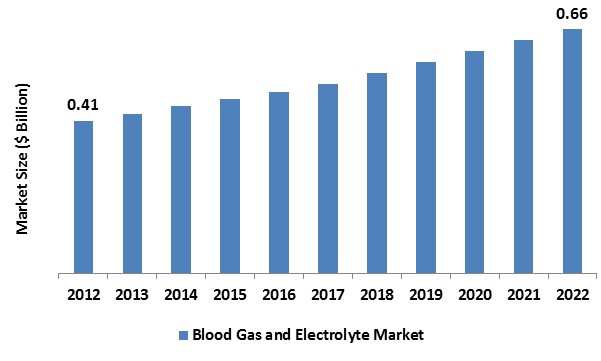
In 2017, the global blood gas and electrolyte analyzers market was worth around USD 0.14 billion and is predicted to reach around USD 0.66 billion by 2022, with a compound annual growth rate (CAGR) of 4.38% during the projected period. An escalating number of patients in emergency departments and critical care, growing inclination towards point-of-care testing, rising need for blood gas testing, the introduction of innovative technologies and rising medical spending levels are few of the highly impacting factors of the global blood gas and electrolyte analyzers industry. Increasing geriatric population around the world is also anticipated to considerably bestow towards industry growth during the forecast years, by actuating prevalence rates of target diseases like cancer, respiratory disorders, cardiovascular diseases, and diabetes. Furthermore, the growth of multi-parameter monitoring device due to growing number of tests and rising demand for compact devices are projected to drive market growth during the forecast years. For example, approximates released by the WHO, recommend that the overall population concerning to the age group of 65 years and above is anticipated to increase from 7% to 16% during 2000 to 2050. Getting older is measured as among the utmost risk factors for the cancer development and other chronic illnesses and hence, the global geriatric population is anticipated to expand the user base.
Product Outlook and Trend Analysis
Portable and Benchtop analyzers are major product sections of the global blood gas and electrolyte analyzers market. The benchtop analyzers are generally larger containing a display which is usually LCD, an opening to place in a sample tube or test strip, and a keypad to enroll information while handy analyzers are portable and assist bedside supervising. In 2017, the handy analyzers industry held the major share at around 60%. Benefits linked with portable analyzers like automation of tasks, portability and ease-of-use, self-monitoring ability, reduced manual errors, and low maintenance are some prominent factors assigning to the large industry share of the segment.
Application Outlook and Trend Analysis
In 2017, combined analyzers ruled the global market due to the existence of huge test volumes as well as a wide range of marketed products. The global market for joint analyzers is anticipated to experience lucrative growth due to rising demand for analyzers which need less protection and can assist test outcomes for both electrolyte and blood count in a particular sample of urine, blood, serum, dialysate or plasma.
End-user Outlook and Trend Analysis
The blood gas and electrolyte analyzers market is also classified on account of end-user into central laboratories and point-of-care. The point-of-care section is anticipated to be the top growing section during the projected period. Constant technological advancements scheduled in the handheld or portable devices drawing end-users to change for point-of-care analyzers is a major propelling factor for this section. It has achieved special significance in cardiothoracic surgical departments, critical care departments, and emergency transport systems as pointed by a great volume of systems produced for these sectors. The requirements for point-of-care blood gas and electrolyte analyzers are anticipated to experience rapid growth during the forecast years. These devices include computerized sample handling that assists in reducing linked errors, provide user changeability and are, hence, projected to achieve high on the customer preference matrix.
Regional Outlook and Trend Analysis
In 2017, North America region has ruled the blood gas and electrolyte analyzers market. Rising number of patients taking treatment each year in healthcare centers, particularly in the intensive care units and emergency departments and the existence of supportive medical infrastructure are few factors anticipated to propel the growth of the regional market. On the other hand, Asia-Pacific region is anticipated to offer producers with lucrative growth opportunities for future. Rising disposable income levels in developing countries like India and China and the existence of high unfulfilled patient demands are a few key drivers for market players. Furthermore, the existence of positive governmental programs and initiatives in emerging countries are anticipated to boost the expansion of the blood gas and electrolyte analyzers market. For example, the encouraging government programs like the UNFPA introduced Country Programme Action Plan (CPAP) is presented with the intention of preventing illnesses and amend medical services in MEA region is estimated to launch new opportunities for growth of the industry.
Competitive Outlook and Trend Analysis
Major market players of the global blood gas and electrolyte analyzers market are Roche, Siemens, Abbott, Bayer, Medica, Accurex Biomedical Pvt. Ltd., Samsung Medison, Erba, Radiometer Medical, Nova Stat, Edan Instruments, Convergent Technologies, Alere Medical, Afford Medical, Dalko Diagnostics and OPTI medical systems Inc. Strategic collaborations, product portfolio expansion, and mergers & acquisitions are some major sustainability schemes implemented by these industry players. For example, Erba Mannheim purchased a French company named as Maxmat S.A in September 2017, which is operating in the division of producing medical laboratory equipment. The deal aided the parent company, minimize product improvement period and supply to the altering requirements of the customers.
The global blood gas and electrolyte analyzers market is segmented as follows :
By Product
- Portable
- Benchtop
By Application
- Electrolyte Analyzers
- Blood Gas Analyzers
- Combined
By End User
- Point Of Care
- Central Laboratories
By Region
- North America
- U.S
- Canada
- Mexico
- Europe
- Germany
- France
- UK
- Italy
- Spain
- Rest of Europe
- Asia-Pacific
- Japan
- China
- Australia
- India
- South Korea
- Rest of Asia Pacific
- Rest of the World
- Brazil
- South Africa
- Saudi Arabia
- United Arab Emirates
- Others
Some of the key questions answered by the report are:
- What was the market size in 2017 and forecast from 2017 to 2022?
- What will be the industry market growth from 2017 to 2022?
- What are the major drivers, restraints, opportunities, challenges, and industry trends and their impact on the market forecast?
- What are the major segments leading the market growth and why?
- Which are the leading players in the market and what are the major strategies adopted by them to sustain the market competition?
Market Classification
- Blood Gas and Electrolyte Analyzers Market, By Product, Estimates and Forecast, 2012-2022 ($Billion)
- Portable
- Benchtop
- Blood Gas and Electrolyte Analyzers Market, By Application, Estimates and Forecast, 2012-2022 ($Billion)
- Electrolyte Analyzers
- Blood Gas Analyzers
- Combined
- Blood Gas and Electrolyte Analyzers Market, By End User, Estimates and Forecast, 2012-2022 ($Billion)
- Point Of Care
- Central Laboratories
- Blood Gas and Electrolyte Analyzers Market, By Region, Estimates and Forecast, 2012-2022 ($Billion)
- North America
- North America Blood Gas and Electrolyte Analyzers Market, By Country
- North America Blood Gas and Electrolyte Analyzers Market, By Product
- North America Blood Gas and Electrolyte Analyzers Market, By Application
- North America Blood Gas and Electrolyte Analyzers Market, By End User
- U.S. Blood Gas and Electrolyte Analyzers Market, By Product
- U.S. Blood Gas and Electrolyte Analyzers Market, By Application
- U.S. Blood Gas and Electrolyte Analyzers Market, By End User
- Canada Blood Gas and Electrolyte Analyzers Market, By Product
- Canada Blood Gas and Electrolyte Analyzers Market, By Application
- Canada Blood Gas and Electrolyte Analyzers Market, By End User
- Mexico Blood Gas and Electrolyte Analyzers Market, By Product
- Mexico Blood Gas and Electrolyte Analyzers Market, By Application
- Mexico Blood Gas and Electrolyte Analyzers Market, By End User
-
- Europe
- Europe Blood Gas and Electrolyte Analyzers Market, By Country
- Europe Blood Gas and Electrolyte Analyzers Market, By Product
- Europe Blood Gas and Electrolyte Analyzers Market, By Application
- Europe Blood Gas and Electrolyte Analyzers Market, By End User
- Germany Blood Gas and Electrolyte Analyzers Market, By Product
- Germany Blood Gas and Electrolyte Analyzers Market, By Application
- Germany Blood Gas and Electrolyte Analyzers Market, By End User
- France Blood Gas and Electrolyte Analyzers Market, By Product
- France Blood Gas and Electrolyte Analyzers Market, By Application
- France Blood Gas and Electrolyte Analyzers Market, By End User
- UK Blood Gas and Electrolyte Analyzers Market, By Product
- UK Blood Gas and Electrolyte Analyzers Market, By Application
- UK Blood Gas and Electrolyte Analyzers Market, By End User
- Italy Blood Gas and Electrolyte Analyzers Market, By Product
- Italy Blood Gas and Electrolyte Analyzers Market, By Application
- Italy Blood Gas and Electrolyte Analyzers Market, By End User
- Spain Blood Gas and Electrolyte Analyzers Market, By Product
- Spain Blood Gas and Electrolyte Analyzers Market, By Application
- Spain Blood Gas and Electrolyte Analyzers Market, By End User
- Rest of Europe Blood Gas and Electrolyte Analyzers Market, By Product
- Rest of Europe Blood Gas and Electrolyte Analyzers Market, By Application
- Rest of Europe Blood Gas and Electrolyte Analyzers Market, By End User
- Europe
-
- Asia-Pacific
- Asia-Pacific Blood Gas and Electrolyte Analyzers Market, By Country
- Asia-Pacific Blood Gas and Electrolyte Analyzers Market, By Product
- Asia-Pacific Blood Gas and Electrolyte Analyzers Market, By Application
- Asia-Pacific Blood Gas and Electrolyte Analyzers Market, By End User
- Japan Blood Gas and Electrolyte Analyzers Market, By Product
- Japan Blood Gas and Electrolyte Analyzers Market, By Application
- Japan Blood Gas and Electrolyte Analyzers Market, By End User
- Australia Blood Gas and Electrolyte Analyzers Market, By Product
- Australia Blood Gas and Electrolyte Analyzers Market, By Application
- Australia Blood Gas and Electrolyte Analyzers Market, By End User
- India Blood Gas and Electrolyte Analyzers Market, By Product
- India Blood Gas and Electrolyte Analyzers Market, By Application
- India Blood Gas and Electrolyte Analyzers Market, By End User
- South Korea Blood Gas and Electrolyte Analyzers Market, By Product
- South Korea Blood Gas and Electrolyte Analyzers Market, By Application
- South Korea Blood Gas and Electrolyte Analyzers Market, By End User
- Rest of Asia-Pacific Blood Gas and Electrolyte Analyzers Market, By Product
- Rest of Asia-Pacific Blood Gas and Electrolyte Analyzers Market, By Application
- Rest of Asia-Pacific Blood Gas and Electrolyte Analyzers Market, By End User
- Asia-Pacific
-
- Rest of the World
- Rest of the World Blood Gas and Electrolyte Analyzers Market, By Country
- Rest of the World Blood Gas and Electrolyte Analyzers Market, By Product
- Rest of the World Blood Gas and Electrolyte Analyzers Market, By Application
- Rest of the World Blood Gas and Electrolyte Analyzers Market, By End User
- Brazil Blood Gas and Electrolyte Analyzers Market, By Product
- Brazil Blood Gas and Electrolyte Analyzers Market, By Application
- Brazil Blood Gas and Electrolyte Analyzers Market, By End User
- South Africa Blood Gas and Electrolyte Analyzers Market, By Product
- South Africa Blood Gas and Electrolyte Analyzers Market, By Application
- South Africa Blood Gas and Electrolyte Analyzers Market, By End User
- Saudi Arabia Blood Gas and Electrolyte Analyzers Market, By Product
- Saudi Arabia Blood Gas and Electrolyte Analyzers Market, By Application
- Saudi Arabia Blood Gas and Electrolyte Analyzers Market, By End User
- Turkey Blood Gas and Electrolyte Analyzers Market, By Product
- Turkey Blood Gas and Electrolyte Analyzers Market, By Application
- Turkey Blood Gas and Electrolyte Analyzers Market, By End User
- United Arab Emirates Blood Gas and Electrolyte Analyzers Market, By Product
- United Arab Emirates Blood Gas and Electrolyte Analyzers Market, By Application
- United Arab Emirates Blood Gas and Electrolyte Analyzers Market, By End User
- Others Blood Gas and Electrolyte Analyzers Market, By Product
- Others Blood Gas and Electrolyte Analyzers Market, By Application
- Others Blood Gas and Electrolyte Analyzers Market, By End User
- Rest of the World
Table of Contents
1. Introduction
1.1. Report Description
1.2. Research Methodology
1.2.1. Secondary Research
1.2.2. Primary Research
2. Executive Summary
2.1. Key Highlights
3. Market Overview
3.1. Introduction
3.1.1. Market Definition
3.1.2. Market Segmentation
3.2. Market Dynamics
3.2.1. Drivers
3.2.1.1. Increasing Geriatric population Across the Globe
3.2.1.2. Rising Incidence Of Chronic Diseases
3.2.1.3. Increasing Awareness Towards integrated System
3.2.2. Restraints
3.2.2.1. High Cost Of Production
3.2.2.2. Stringent Government Regulations
3.2.3. Opportunities
3.2.3.1. Emerging Countries to Offer Lucrative Growth Opportunities
4. Blood Gas and Electrolyte Analyzers Market, By Product
4.1. Introduction
4.2. Blood Gas and Electrolyte Analyzers Market Assessment and Forecast, By Product, 2012-2022
4.3. Portable
4.3.1. Market Assessment and Forecast, By Region, 2012-2022 ($Billion)
4.4. Benchtop
4.4.1. Market Assessment and Forecast, By Region, 2012-2022 ($Billion)
5. Blood Gas and Electrolyte Analyzers Market, By Application
5.1. Introduction
5.2. Blood Gas and Electrolyte Analyzers Market Assessment and Forecast, By Application, 2012-2022
5.3. Electrolyte Analyzers
5.3.1. Market Assessment and Forecast, By Region, 2012-2022 ($Billion)
5.4. Blood Gas Analyzers
5.4.1. Market Assessment and Forecast, By Region, 2012-2022 ($Billion)
5.5. Combined
5.5.1. Market Assessment and Forecast, By Region, 2012-2022 ($Billion)
6. Blood Gas and Electrolyte Analyzers Market, By End User
6.1. Introduction
6.2. Blood Gas and Electrolyte Analyzers Market Assessment and Forecast, By End User, 2012-2022 ($Billion)
6.3. Point Of Care
6.3.1. Market Assessment and Forecast, By Region, 2012-2022 ($Billion)
6.4. Central Laboratories
6.4.1. Market Assessment and Forecast, By Region, 2012-2022 ($Billion)
7. Blood Gas and Electrolyte Analyzers Market, By Region
7.1. Introduction
7.2. Blood Gas and Electrolyte Analyzers Market Assessment and Forecast, By Region, 2012-2022 ($Billion)
7.3. North America
7.3.1. Market Assessment and Forecast, By Country, 2012-2022 ($Billion)
7.3.2. Market Assessment and Forecast, By Product, 2012-2022 ($Billion)
7.3.3. Market Assessment and Forecast, By Application, 2012-2022 ($Billion)
7.3.4. Market Assessment and Forecast, By End User, 2012-2022 ($Billion)
7.3.5. U.S.
7.3.5.1.1. Market Assessment and Forecast, By Product, 2012-2022 ($Billion)
7.3.5.1.2. Market Assessment and Forecast, By Application, 2012-2022 ($Billion)
7.3.5.1.3. Market Assessment and Forecast, By End User, 2012-2022 ($Billion)
7.3.5.2. Canada
7.3.5.2.1. Market Assessment and Forecast, By Product, 2012-2022 ($Billion)
7.3.5.2.2. Market Assessment and Forecast, By Application, 2012-2022 ($Billion)
7.3.5.2.3. Market Assessment and Forecast, By End User, 2012-2022 ($Billion)
7.3.5.3. Mexico
7.3.5.3.1. Market Assessment and Forecast, By Product, 2012-2022 ($Billion)
7.3.5.3.2. Market Assessment and Forecast, By Application, 2012-2022 ($Billion)
7.3.5.3.3. Market Assessment and Forecast, By End User, 2012-2022 ($Billion)
7.4. Europe
7.4.1. Market Assessment and Forecast, By Country, 2012-2022 ($Billion)
7.4.2. Market Assessment and Forecast, By Product, 2012-2022 ($Billion)
7.4.3. Market Assessment and Forecast, By End User, 2012-2022 ($Billion)
7.4.4. Market Assessment and Forecast, By End User, 2012-2022 ($Billion)
7.4.5. Germany
7.4.5.1.1. Market Assessment and Forecast, By Product, 2012-2022 ($Billion)
7.4.5.1.2. Market Assessment and Forecast, By Application, 2012-2022 ($Billion)
7.4.5.1.3. Market Assessment and Forecast, By End User, 2012-2022 ($Billion)
7.4.6. France
7.4.6.1.1. Market Assessment and Forecast, By Product, 2012-2022 ($Billion)
7.4.6.1.2. Market Assessment and Forecast, By Application, 2012-2022 ($Billion)
7.4.6.1.3. Market Assessment and Forecast, By End User, 2012-2022 ($Billion)
7.4.7. UK
7.4.7.1.1. Market Assessment and Forecast, By Product, 2012-2022 ($Billion)
7.4.7.1.2. Market Assessment and Forecast, By Application, 2012-2022 ($Billion)
7.4.7.1.3. Market Assessment and Forecast, By End User, 2012-2022 ($Billion)
7.4.8. Italy
7.4.8.1.1. Market Assessment and Forecast, By Product, 2012-2022 ($Billion)
7.4.8.1.2. Market Assessment and Forecast, By Application, 2012-2022 ($Billion)
7.4.8.1.3. Market Assessment and Forecast, By End User, 2012-2022 ($Billion)
7.4.9. Spain
7.4.9.1.1. Market Assessment and Forecast, By Product, 2012-2022 ($Billion)
7.4.9.1.2. Market Assessment and Forecast, By Application, 2012-2022 ($Billion)
7.4.9.1.3. Market Assessment and Forecast, By End User, 2012-2022 ($Billion)
7.4.9.2. Rest of Europe
7.4.9.2.1. Market Assessment and Forecast, By Product, 2012-2022 ($Billion)
7.4.9.2.2. Market Assessment and Forecast, By Application, 2012-2022 ($Billion)
7.4.9.2.3. Market Assessment and Forecast, By End User, 2012-2022 ($Billion)
8. Asia-Pacific
8.1.1. Market Assessment and Forecast, By Country, 2012-2022 ($Billion)
8.1.2. Market Assessment and Forecast, By Product, 2012-2022 ($Billion)
8.1.3. Market Assessment and Forecast, By Application, 2012-2022 ($Billion)
8.1.4. Market Assessment and Forecast, By End User, 2012-2022 ($Billion)
8.1.4.1. Japan
8.1.4.1.1. Market Assessment and Forecast, By Product, 2012-2022 ($Billion)
8.1.4.1.2. Market Assessment and Forecast, By Application, 2012-2022 ($Billion)
8.1.4.1.3. Market Assessment and Forecast, By End User, 2012-2022 ($Billion)
8.1.5. China
8.1.5.1.1. Market Assessment and Forecast, By Product, 2012-2022 ($Billion)
8.1.5.1.2. Market Assessment and Forecast, By Application, 2012-2022 ($Billion)
8.1.5.1.3. Market Assessment and Forecast, By End User, 2012-2022 ($Billion)
8.1.6. Australia
8.1.6.1.1. Market Assessment and Forecast, By Product, 2012-2022 ($Billion)
8.1.6.1.2. Market Assessment and Forecast, By Application, 2012-2022 ($Billion)
8.1.6.1.3. Market Assessment and Forecast, By End User, 2012-2022 ($Billion)
8.1.7. India
8.1.7.1.1. Market Assessment and Forecast, By Product, 2012-2022 ($Billion)
8.1.7.1.2. Market Assessment and Forecast, By Application, 2012-2022 ($Billion)
8.1.7.1.3. Market Assessment and Forecast, By End User, 2012-2022 ($Billion)
8.1.8. South Korea
8.1.8.1.1. Market Assessment and Forecast, By Product, 2012-2022 ($Billion)
8.1.8.1.2. Market Assessment and Forecast, By Application, 2012-2022 ($Billion)
8.1.8.1.3. Market Assessment and Forecast, By End User, 2012-2022 ($Billion)
8.1.9. Rest of Asia-Pacific
8.1.9.1.1. Market Assessment and Forecast, By Product, 2012-2022 ($Billion)
8.1.9.1.2. Market Assessment and Forecast, By Application, 2012-2022 ($Billion)
8.1.9.1.3. Market Assessment and Forecast, By End User, 2012-2022 ($Billion)
9. Rest of the World
9.1.1. Market Assessment and Forecast, By Country, 2012-2022 ($Billion)
9.1.2. Market Assessment and Forecast, By Product, 2012-2022 ($Billion)
9.1.3. Market Assessment and Forecast, By End User, 2012-2022 ($Billion)
9.1.4. Market Assessment and Forecast, By End User, 2012-2022 ($Billion)
9.1.5. Brazil
9.1.5.1.1. Market Assessment and Forecast, By Product, 2012-2022 ($Billion)
9.1.5.1.2. Market Assessment and Forecast, By Application , 2012-2022 ($Billion)
9.1.5.1.3. Market Assessment and Forecast, By End User, 2012-2022 ($Billion)
9.1.6. Turkey
9.1.6.1.1. Market Assessment and Forecast, By Product, 2012-2022 ($Billion)
9.1.6.1.2. Market Assessment and Forecast, By Application, 2012-2022 ($Billion)
9.1.6.1.3. Market Assessment and Forecast, By End User, 2012-2022 ($Billion)
9.1.7. Saudi Arabia
9.1.7.1.1. Market Assessment and Forecast, By Product, 2012-2022 ($Billion)
9.1.7.1.2. Market Assessment and Forecast, By Application, 2012-2022 ($Billion)
9.1.7.1.3. Market Assessment and Forecast, By End User, 2012-2022 ($Billion)
9.1.8. South Africa
9.1.8.1.1. Market Assessment and Forecast, By Product, 2012-2022 ($Billion)
9.1.8.1.2. Market Assessment and Forecast, By Application, 2012-2022 ($Billion)
9.1.8.1.3. Market Assessment and Forecast, By End User, 2012-2022 ($Billion)
9.1.9. United Arab Emirates
9.1.9.1.1. Market Assessment and Forecast, By Product, 2012-2022 ($Billion)
9.1.9.1.2. Market Assessment and Forecast, By Application, 2012-2022 ($Billion)
9.1.9.1.3. Market Assessment and Forecast, By End User, 2012-2022 ($Billion)
9.1.10. Others
9.1.10.1.1. Market Assessment and Forecast, By Product, 2012-2022 ($Billion)
9.1.10.1.2. Market Assessment and Forecast, By Application, 2012-2022 ($Billion)
9.1.10.1.3. Market Assessment and Forecast, By End User, 2012-2022 ($Billion)
10. Company Profiles
10.1. Siemens
10.1.1. Business Overview
10.1.2. Product Portfolio
10.1.3. Key Financials
10.1.4. Strategic Developments
10.2. Roche
10.2.1. Business Overview
10.2.2. Product Portfolio
10.2.3. Key Financials
10.2.4. Strategic Developments
10.3. Erba
10.3.1. Business Overview
10.3.2. Product Portfolio
10.3.3. Strategic Developments
10.4. Bayer
10.4.1. Business Overview
10.4.2. Product Portfolio
10.4.3. Key Financials
10.4.4. Strategic Developments
10.5. Radiometer Medical
10.5.1. Business Overview
10.5.2. Product Portfolio
10.5.3. Strategic Developments
10.6. Samsung Medison
10.6.1. Business Overview
10.6.2. Product Portfolio
10.6.3. Strategic Developments
10.7. Edan Instruments
10.7.1. Business Overview
10.7.2. Product Portfolio
10.7.3. Strategic Developments
10.8. OPTI Medical Systems Inc.
10.8.1. Business Overview
10.8.2. Product Portfolio
10.8.3. Strategic Developments
10.9. Alere Medical
10.9.1. Business Overview
10.9.2. Product Portfolio
10.9.3. Key Financials
10.9.4. Strategic Developments
10.10. Afford Medical Technologies
10.10.1. Business Overview
10.10.2. Product Portfolio
10.10.3. Strategic Developments
List of Tables
Table 1.Blood Gas and Electrolyte Analyzers Market, By Product ($Billion), 2012-2022
Table 2.Portable Market, By Region ($Billion), 2012-2022
Table 3.Benchtop Market, By Region ($Billion), 2012-2022
Table 4.Blood Gas and Electrolyte Analyzers Market, By Application ($Billion), 2012-2022
Table 5.Electrolyte Analyzers Market, By Region ($Billion), 2012-2022
Table 6.Blood Gas Analyzers Market, By Region ($Billion), 2012-2022
Table 7.CombinedMarket, By Region ($Billion), 2012-2022
Table 8.Blood Gas and Electrolyte Analyzers Market, By End User ($Billion), 2012-2022
Table 9.Point of Care Market, By Region ($Billion), 2012-2022
Table 10.Central Laboratories Market, By Region ($Billion), 2012-2022
Table 11.Blood Gas and Electrolyte Analyzers Market, By Region ($Billion), 2012-2022
Table 12.North America Blood Gas and Electrolyte Analyzers Market, By Country, 2012-2022 ($Billion)
Table 13.North America Blood Gas and Electrolyte Analyzers Market, By Product, 2012-2022 ($Billion)
Table 14.North America Blood Gas and Electrolyte Analyzers Market, By Application, 2012-2022 ($Billion)
Table 15.North America Blood Gas and Electrolyte Analyzers Market, By End User, 2012-2022 ($Billion)
Table 16.U.S. Blood Gas and Electrolyte Analyzers Market, By Product, 2012-2022 ($Billion)
Table 17.U.S. Blood Gas and Electrolyte Analyzers Market, By Application, 2012-2022 ($Billion)
Table 18.U.S. Blood Gas and Electrolyte Analyzers Market, By End User, 2012-2022 ($Billion)
Table 19.Canada Blood Gas and Electrolyte Analyzers Market, By Product, 2012-2022 ($Billion)
Table 20.Canada Blood Gas and Electrolyte Analyzers Market, By Application, 2012-2022 ($Billion)
Table 21.Canada Blood Gas and Electrolyte Analyzers Market, By End User, 2012-2022 ($Billion)
Table 22.Mexico Blood Gas and Electrolyte Analyzers Market, By Product, 2012-2022 ($Billion)
Table 23.Mexico Blood Gas and Electrolyte Analyzers Market, By Application, 2012-2022 ($Billion)
Table 24.Mexico Blood Gas and Electrolyte Analyzers Market, By End User, 2012-2022 ($Billion)
Table 25.Europe Blood Gas and Electrolyte Analyzers Market, By Country, 2012-2022 ($Billion)
Table 26.Europe Blood Gas and Electrolyte Analyzers Market, By Product, 2012-2022 ($Billion)
Table 27.Europe Blood Gas and Electrolyte Analyzers Market, By Application, 2012-2022 ($Billion)
Table 28.Europe Blood Gas and Electrolyte Analyzers Market, By End User, 2012-2022 ($Billion)
Table 29.Germany Blood Gas and Electrolyte Analyzers Market, By Product, 2012-2022 ($Billion)
Table 30.Germany Blood Gas and Electrolyte Analyzers Market, By Application, 2012-2022 ($Billion)
Table 31.Germany Blood Gas and Electrolyte Analyzers Market, By End User, 2012-2022 ($Billion)
Table 32.France Blood Gas and Electrolyte Analyzers Market, By Product, 2012-2022 ($Billion)
Table 33.France Blood Gas and Electrolyte Analyzers Market, By Application, 2012-2022 ($Billion)
Table 34.France Blood Gas and Electrolyte Analyzers Market, By End User, 2012-2022 ($Billion)
Table 35.UK Blood Gas and Electrolyte Analyzers Market, By Product, 2012-2022 ($Billion)
Table 36.UK Blood Gas and Electrolyte Analyzers Market, By Application, 2012-2022 ($Billion)
Table 37.UK Blood Gas and Electrolyte Analyzers Market, By End User, 2012-2022 ($Billion)
Table 38.Italy Blood Gas and Electrolyte Analyzers Market, By Product, 2012-2022 ($Billion)
Table 39.Italy Blood Gas and Electrolyte Analyzers Market, By Application, 2012-2022 ($Billion)
Table 40.Italy Blood Gas and Electrolyte Analyzers Market, By End User, 2012-2022 ($Billion)
Table 41.Spain Blood Gas and Electrolyte Analyzers Market, By Product, 2012-2022 ($Billion)
Table 42.Spain Blood Gas and Electrolyte Analyzers Market, By Application, 2012-2022 ($Billion)
Table 43.Spain Blood Gas and Electrolyte Analyzers Market, By End User, 2012-2022 ($Billion)
Table 44.Rest of Europe Blood Gas and Electrolyte Analyzers Market, By Product, 2012-2022 ($Billion)
Table 45.Rest of Europe Blood Gas and Electrolyte Analyzers Market, By Application, 2012-2022 ($Billion)
Table 46.Rest of Europe Blood Gas and Electrolyte Analyzers Market, By End User, 2012-2022 ($Billion)
Table 47.Asia-Pacific Blood Gas and Electrolyte Analyzers Market, By Country, 2012-2022 ($Billion)
Table 48.Asia-Pacific Blood Gas and Electrolyte Analyzers Market, By Product, 2012-2022 ($Billion)
Table 49.Asia-Pacific Blood Gas and Electrolyte Analyzers Market, By Application, 2012-2022 ($Billion)
Table 50.Asia-Pacific Blood Gas and Electrolyte Analyzers Market, By End User, 2012-2022 ($Billion)
Table 51.Japan Blood Gas and Electrolyte Analyzers Market, By Product, 2012-2022 ($Billion)
Table 52.Japan Blood Gas and Electrolyte Analyzers Market, By Application, 2012-2022 ($Billion)
Table 53.Japan Blood Gas and Electrolyte Analyzers Market, By End User, 2012-2022 ($Billion)
Table 54.China Blood Gas and Electrolyte Analyzers Market, By Product, 2012-2022 ($Billion)
Table 55.China Blood Gas and Electrolyte Analyzers Market, By Application, 2012-2022 ($Billion)
Table 56.China Blood Gas and Electrolyte Analyzers Market, By End User, 2012-2022 ($Billion)
Table 57.Australia Blood Gas and Electrolyte Analyzers Market, By Product, 2012-2022 ($Billion)
Table 58.Australia Blood Gas and Electrolyte Analyzers Market, By Application, 2012-2022 ($Billion)
Table 59.Australia Blood Gas and Electrolyte Analyzers Market, By End User, 2012-2022 ($Billion)
Table 60.India Blood Gas and Electrolyte Analyzers Market, By Product, 2012-2022 ($Billion)
Table 61.India Blood Gas and Electrolyte Analyzers Market, By Application, 2012-2022 ($Billion)
Table 62.India Blood Gas and Electrolyte Analyzers Market, By End User, 2012-2022 ($Billion)
Table 63.South Korea Blood Gas and Electrolyte Analyzers Market, By Product, 2012-2022 ($Billion)
Table 64.South Korea Blood Gas and Electrolyte Analyzers Market, By Application, 2012-2022 ($Billion)
Table 65.South Korea Blood Gas and Electrolyte Analyzers Market, By End User, 2012-2022 ($Billion)
Table 66.Rest of Asia-Pacific Blood Gas and Electrolyte Analyzers Market, By Product, 2012-2022 ($Billion)
Table 67.Rest of Asia-Pacific Blood Gas and Electrolyte Analyzers Market, By Application, 2012-2022 ($Billion)
Table 68.Rest of Asia-Pacific Blood Gas and Electrolyte Analyzers Market, By End User, 2012-2022 ($Billion)
Table 69.Rest of the World Blood Gas and Electrolyte Analyzers Market, By Country, 2012-2022 ($Billion)
Table 70.Rest of the World Blood Gas and Electrolyte Analyzers Market, By Product, 2012-2022 ($Billion)
Table 71.Rest of the World Blood Gas and Electrolyte Analyzers Market, By Application, 2012-2022 ($Billion)
Table 72.Rest of the World Blood Gas and Electrolyte Analyzers Market, By End User, 2012-2022 ($Billion)
Table 73.Brazil Blood Gas and Electrolyte Analyzers Market, By Product, 2012-2022 ($Billion)
Table 74.Brazil Blood Gas and Electrolyte Analyzers Market, By Application, 2012-2022 ($Billion)
Table 75.Brazil Blood Gas and Electrolyte Analyzers Market, By End User, 2012-2022 ($Billion)
Table 76.Turkey Blood Gas and Electrolyte Analyzers Market, By Product, 2012-2022 ($Billion)
Table 77.Turkey Blood Gas and Electrolyte Analyzers Market, By Application, 2012-2022 ($Billion)
Table 78.Turkey Blood Gas and Electrolyte Analyzers Market, By End User, 2012-2022 ($Billion)
Table 79.Saudi Arabia Blood Gas and Electrolyte Analyzers Market, By Product, 2012-2022 ($Billion)
Table 80.Saudi Arabia Blood Gas and Electrolyte Analyzers Market, By Application, 2012-2022 ($Billion)
Table 82.Saudi Arabia Blood Gas and Electrolyte Analyzers Market, By End User, 2012-2022 ($Billion)
Table 83.South Africa Blood Gas and Electrolyte Analyzers Market, By Product, 2012-2022 ($Billion)
Table 84.South Africa Blood Gas and Electrolyte Analyzers Market, By Application, 2012-2022 ($Billion)
Table 85.South Africa Blood Gas and Electrolyte Analyzers Market, By End User, 2012-2022 ($Billion)
Table 86.United Arab Emirates Blood Gas and Electrolyte Analyzers Market, By Product, 2012-2022 ($Billion)
Table 87.United Arab Emirates Blood Gas and Electrolyte Analyzers Market, By Application, 2012-2022 ($Billion)
Table 88.United Arab Emirates Blood Gas and Electrolyte Analyzers Market, By End User, 2012-2022 ($Billion)
Table 89.Others Blood Gas and Electrolyte Analyzers Market, By Product, 2012-2022 ($Billion)
Table 90.Others Blood Gas and Electrolyte Analyzers Market, By Application, 2012-2022 ($Billion)
Table 91.Others Blood Gas and Electrolyte Analyzers Market, By End User, 2012-2022 ($Billion)
Table 92.Siemens: Key Strategic Developments, 2017-2017
Table 93.Roche: Key Strategic Developments, 2017-2017
Table 94.Erba: Key Strategic Developments, 2017-2017
Table 95.Bayer Key Strategic Developments, 2017-2017
Table 96.Radiometer Medical: Key Strategic Developments, 2017-2017
Table 97.Samsung Medison: Key Strategic Developments, 2017-2017
Table 98.Edan Instruments: Key Strategic Developments, 2017-2017
Table 99.OPTI Medical Systems Inc.: Key Strategic Developments, 2017-2017
Table 100.Alere Medical: Key Strategic Developments, 2017-2017
Table 101.Afford Medical Technologies: Key Strategic Developments, 2017-2017
List of Figures
Figure 1.Blood Gas and Electrolyte Analyzers Market Share, By Product, 2017 & 2025 ($Billion)
Figure 2.Blood Gas and Electrolyte Analyzers Market, By Application, 2017 & 2025 ($Billion)
Figure 3.Blood Gas and Electrolyte Analyzers Market, By End User, 2017 & 2025 ($Billion)
Figure 4.Blood Gas and Electrolyte Analyzers Market, By Region, 2017, ($Billion)
Figure 5.Siemens: Net Revenues, 2017-2017 ($Billion)
Figure 6.Siemens: Net Revenue Share, By Segment, 2017
Figure 7.Siemens: Net Revenue Share, By Geography, 2017
Figure 8.Roche: Net Revenues, 2017-2017 ($Billion)
Figure 9.Roche: Net Revenue Share, By Segment, 2017
Figure 10.Roche: Net Revenue Share, By Geography, 2017
Figure 11.Bayer: Net Revenues, 2017-2017 ($Billion)
Figure 12.Bayer: Net Revenue Share, By Segment, 2017
Figure 13.Bayer: Net Revenue Share, By Geography, 2017
Figure 14.Afford Medical Technologies: Net Revenues, 2017-2017 ($Billion)
Figure 15.Afford Medical Technologies: Net Revenue Share, By Segment, 2017
Figure 16.Afford Medical Technologies: Net Revenue Share, By Geography, 2017
Research Methodology
We use both primary as well as secondary research for our market surveys, estimates and for developing forecast. Our research process commence by analyzing the problem which enable us to design the scope for our research study. Our research process is uniquely designed with enough flexibility to adjust according to changing nature of products and markets, while retaining core element to ensure reliability and accuracy in research findings. We understand both macro and micro-economic factors to evaluate and forecast different market segments.
Data Mining
Data is extensively collected through various secondary sources such as annual reports, investor presentations, SEC filings, and other corporate publications. We also refer trade magazines, technical journals, paid databases such as Factiva and Bloomberg, industry trade journals, scientific journals, and social media data to understand market dynamics and industry trends. Further, we also conduct primary research to understand market drivers, restraints, opportunities, challenges, and competitive scenario to build our analysis.
Data Collection Matrix
|
Data Collection Matrix |
Supply Side |
Demand Side |
|
Primary Data Sources |
|
|
|
Secondary Data Sources |
|
|
Market Modeling and Forecasting
We use epidemiology and capital equipment-based models to forecast market size of different segments at country and regional level.
- Epidemiology-based Forecasting Model: This method uses epidemiology data gathered through various publications and from physicians to estimate population of patients, flow of treatment of individual disease and therapies. The data collected through this method includes statics on incidence of disease, population suffering from disease, and treatment population. This method is used to understand:
- Number of patients for particular device or medical procedure and
- Repeated use of particular device depending on health and condition of patient
- Capital-based Forecasting Model: This method of forecasting is based on number of replacements, installed-based and new sales of capital equipment used in various healthcare and diagnostic centers. These three parameters are calculated and forecast is developed. Installation base is calculated as average number of units per facility; while sales for particular year is calculated from number of new and replace units. Secondary data is collected through various supply chain intermediaries and opinion leaders to arrive at installation and sales rate. These techniques help our analysts in validating market and developed market estimates and forecast.
We do forecast on basis of several parameters such as market drivers, market opportunities, industry trends government regulations, raw materials supply and trade dynamics to ensure relevance of forecast with market scenario. With increasing need to granulized information, we used bottom-up methodology for forecasting where we evaluate each regional segment differently and combined all forecast to develop final market forecast.
Data Validation
We believe primary research is a very important tool in analyzing and forecasting different markets. In order to make sure accuracy of our findings, our team conducts primary interviews at every stage of research to gain deep insights into current business environment and future trends and key developments in market. This includes use of various methods such as telephonic interviews, focus groups, face to face interviews and questionnaires to validate our research from all aspects. We validate our data through primary research from key industry leaders such as CEO, product managers, marketing managers, suppliers, distributors, and consumers are frequently interviewed. These interviews provide valuable insights which help us to have better market understanding besides validating our estimates and forecast.
Data Triangulation

Industry Analysis
|
Qualitative Data |
Quantitative Data (2017-2025) |
|
|