Apheresis Equipment Market by Product, Procedure, Application and Technology - Global Industry Analysis and Forecast to 2022
Published On : October 2017 Pages : 97 Category: Healthcare IT Report Code : HC10265
Industry Trend Analysis
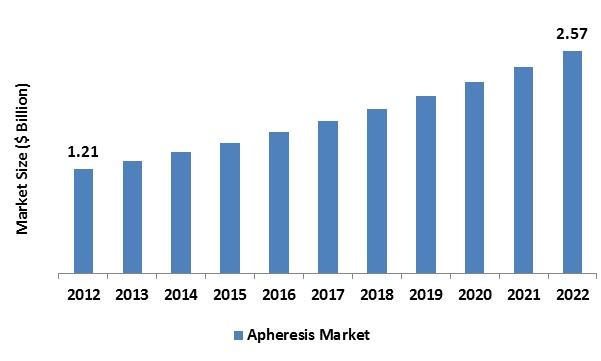
In 2017, the global apheresis market was valued around USD 1.21 billion and is projected to reach approximately USD 2.57 billion by 2022, registering a compound annual growth rate (CAGR) of 7.05% during the forecast period. The existence of well-disposed government initiatives as well as reimbursement plan is likely to drive demand over the forecast years. Moreover, increase in a number of platelet donors and rising investments in research and development by biopharma market players are projected to assist as high impact delivering factors. Increasing occurrence of blood-related diseases is anticipated to encourage demand by escalating the application rates of apheresis equipment and its kits. As per the NHSBT, the platelets demand is estimated to expand at 3% rate yearly during 2017 to 2017. Furthermore, rising awareness levels concerning to platelet donation is expected to encourage demand in developed countries. The existence of elevated unfulfilled demands and speedily growing platelets demand in the developing Latin American and Asia Pacific regions is anticipated to assist this market as future expansion opportunities. According to the reports released by the National Center for Biotechnology Information, chronic renal illnesses have an occurrence rate of 8% to 16% globally.
Product Outlook and Trend Analysis
Kits are bunched collectively and are comprehensive of separators, tubing set, filters, and other elements. Elevated application volume combined with speedily rising apheresis procedure demand are a few factors leading to the global growth of this market. Additionally, single utilization assists in restraining device-associated blood contamination in patients and donors, thus encouraging the growth of the segment.
Procedure Outlook and Trend Analysis
In 2017, plasmapheresis reported for the major share of around 50.0% of the global procedure market. Plasmapheresis formulated in 1951 by Grifols which is a procedure including the partition of plasma from the blood cells. The plasma-based medicines are also given to patients with weak immunity in order to try and increase resistance to disease or infection. Increasing prevalence of blood-related diseases and rising plasma-derived drugs demand is anticipated to assist as a key factor driving the global market growth.
Application Outlook and Trend Analysis
During the projected years, neurology is anticipated to experience the fastest expansion. In 2017, according to Multiple Sclerosis Association of America, around 4 million people were suffering from multiple sclerosis. Additionally, the annual prevalence of the disease in the United States only totaled to 10 thousand. Procedural benefits like shorter treatment duration and lesser blood loss due to total automation are also projected to impact the global growth positively.
Technology Outlook and Trend Analysis
Apheresis equipment functions by either centrifugation or membrane filtration to assist in separating a range of blood components. Since 2017, centrifugation held mass shares, though, during the projected years, membrane filtration is forecasted to record more expansion. Membrane filters are considerably functional in plasma filtration from other cellular parts as conflicting to centrifuges, which are helpful for particular cell separation. This process consumes less time and also eliminates the reduction of blood coagulation factors and, hence, reduces the requirement for substitute fluids. Superior efficacy displayed by the technology responsible for its elevated applications in the Western European developed regions as well as Japan.
Regional Outlook and Trend Analysis
In 2017, North America regional market held the major share of the global market at 46.7% owing to the existence of advanced medical infrastructure and elevated awareness levels among patients combined with comparatively higher medical expenditure. Asia Pacific region is anticipated to record the maximum rise in revenue share over the projected period. Rising occurrence of blood diseases needing plasma and platelet transfusion in the developing economies of China and India is among the major factors reporting for this expansion in revenue share. Additionally, amending medical infrastructure and rising number of medical practitioners in the region is projected to offer the market with a vigorous growth platform over the forecast years.
Competitive Outlook and Trend Analysis
The major market players in the apheresis equipment industry are; Fresenius Kabi (Fenwal), Haemonetics Corporation, Terumo BCT, Inc., Asahi Kasei Kuraray Medical Co. Ltd., HemaCare Corporation, B. Braun Melsungen AG, Therakos, Inc., and others. The global market has oligopolistic structure and is noted by a wide-ranging existence of mergers and acquisitions. Innovative product developments, acquirements, and strategical association are few key sustainability strategies implemented by the market players. Fresenius Kabi, on account of an extensive existence of product portfolio and distribution network, is a leading player in the global market.
The global apheresis market is segmented as follows :
By Product
- Apheresis machine
- Disposable Apheresis kits
By Procedure
- Plasmapheresis
- Plateletpheresis
- LDL-apheresis
- Leukapheresis
- Erythrocytapheresis
- Photopheresis
- Other Equipment
By Application
- Hematology
- Renal Diseases
- Neurology
- Other Applications
By Technology
- Centrifugation
- Membrane Separation
By Region:
- North America
- U.S
- Canada
- Mexico
- Europe
- Germany
- France
- UK
- Italy
- Spain
- Rest of Europe
- Asia-Pacific
- Japan
- China
- Australia
- India
- South Korea
- Rest of Asia Pacific
- Rest of the World
- Brazil
- South Africa
- Saudi Arabia
- United Arab Emirates
- Others
Some of the key questions answered by the report are:
- What was the market size in 2017 and forecast from 2017 to 2022?
- What will be the industry market growth from 2017 to 2022?
- What are the major drivers, restraints, opportunities, challenges, and industry trends and their impact on the market forecast?
- What are the major segments leading the market growth and why?
- Which are the leading players in the market and what are the major strategies adopted by them to sustain the market competition?
Market Classification
- Apheresis Equipment Market, By Product, Estimates and Forecast, 2012-2022 ($Million)
- Apheresis Machine
- Disposable Apheresis kits
- Apheresis Equipment Market, By Procedure, Estimates and Forecast, 2012-2022 ($Million)
- PlasmApheresis
- Plateletpheresis
- LDL-Apheresis
- LeukApheresis
- ErythrocytApheresis
- Photopheresis
- Apheresis Equipment Market, By Application, Estimates and Forecast, 2012-2022 ($Million)
- Hematology
- Renal Diseases
- Neurology
- Other Applications
- Apheresis Equipment Market, By Technology, Estimates and Forecast, 2012-2022 ($Million)
- Centrifugation
- Membrane Separation
- Apheresis Equipment Market, By Region, Estimates and Forecast, 2012-2022 ($Million)
- North America
- North America Apheresis Equipment Market, By Country
- North America Apheresis Equipment Market, By Product
- North America Apheresis Equipment Market, By Procedure
- North America Apheresis Equipment Market, By Application
- North America Apheresis Equipment Market, By Technology
- U.S. Apheresis Equipment Market, By Product
- U.S. Apheresis Equipment Market, By Procedure
- U.S. Apheresis Equipment Market, By Application
- U.S. Apheresis Equipment Market, By Technology
- Canada Apheresis Equipment Market, By Product
- Canada Apheresis Equipment Market, By Procedure
- Canada Apheresis Equipment Market, By Application
- Canada Apheresis Equipment Market, By Technology
- Mexico Apheresis Equipment Market, By Product
- Mexico Apheresis Equipment Market, By Procedure
- Mexico Apheresis Equipment Market, By Application
- Mexico Apheresis Equipment Market, By Technology
-
- Europe
- Europe Apheresis Equipment Market, By Country
- Europe Apheresis Equipment Market, By Product
- Europe Apheresis Equipment Market, By Procedure
- Europe Apheresis Equipment Market, By Application
- Europe Apheresis Equipment Market, By Technology
- Germany Apheresis Equipment Market, By Product
- Germany Apheresis Equipment Market, By Procedure
- Germany Apheresis Equipment Market, By Application
- Germany Apheresis Equipment Market, By Technology
- France Apheresis Equipment Market, By Product
- France Apheresis Equipment Market, By Procedure
- France Apheresis Equipment Market, By Application
- France Apheresis Equipment Market, By Technology
- UK Apheresis Equipment Market, By Product
- UK Apheresis Equipment Market, By Procedure
- UK Apheresis Equipment Market, By Application
- UK Apheresis Equipment Market, By Technology
- Italy Apheresis Equipment Market, By Product
- Italy Apheresis Equipment Market, By Procedure
- Italy Apheresis Equipment Market, By Application
- Italy Apheresis Equipment Market, By Technology
- Spain Apheresis Equipment Market, By Product
- Spain Apheresis Equipment Market, By Procedure
- Rest of Europe Apheresis Equipment Market, By Product
- Rest of Europe Apheresis Equipment Market, By Procedure
- Rest of Europe Apheresis Equipment Market, By Application
- Rest of Europe Apheresis Equipment Market, By Technology
-
- Asia-Pacific
- Asia-Pacific Apheresis Equipment Market, By Country
- Asia-Pacific Apheresis Equipment Market, By Product
- Asia-Pacific Apheresis Equipment Market, By Procedure
- Asia-Pacific Apheresis Equipment Market, By Application
- Asia-Pacific Apheresis Equipment Market, By Technology
- Japan Apheresis Equipment Market, By Product
- Japan Apheresis Equipment Market, By Procedure
- Japan Apheresis Equipment Market, By Application
- Japan Apheresis Equipment Market, By Technology
- Australia Apheresis Equipment Market, By Product
- Australia Apheresis Equipment Market, By Procedure
- Australia Apheresis Equipment Market, By Application
- Australia Apheresis Equipment Market, By Technology
- India Apheresis Equipment Market, By Product
- India Apheresis Equipment Market, By Procedure
- India Apheresis Equipment Market, By Application
- India Apheresis Equipment Market, By Technology
- South Korea Apheresis Equipment Market, By Product
- South Korea Apheresis Equipment Market, By Procedure
- South Korea Apheresis Equipment Market, By Application
- South Korea Apheresis Equipment Market, By Technology
- Rest of Asia-Pacific Apheresis Equipment Market, By Product
- Rest of Asia-Pacific Apheresis Equipment Market, By Procedure
- Rest of Asia-Pacific Apheresis Equipment Market, By Application
- Rest of Asia-Pacific Apheresis Equipment Market, By Technology
- Asia-Pacific
-
- Rest of the World
- Rest of the World Apheresis Equipment Market, By Country
- Rest of the World Apheresis Equipment Market, By Product
- Rest of the World Apheresis Equipment Market, By Procedure
- Rest of the World Apheresis Equipment Market, By Application
- Rest of the World Apheresis Equipment Market, By Technology
- Brazil Apheresis Equipment Market, By Product
- Brazil Apheresis Equipment Market, By Procedure
- Brazil Apheresis Equipment Market, By Application
- Brazil Apheresis Equipment Market, By Technology
- South Africa Apheresis Equipment Market, By Product
- South Africa Apheresis Equipment Market, By Procedure
- South Africa Apheresis Equipment Market, By Application
- South Africa Apheresis Equipment Market, By Technology
- Saudi Arabia Apheresis Equipment Market, By Product
- Saudi Arabia Apheresis Equipment Market, By Procedure
- Saudi Arabia Apheresis Equipment Market, By Application
- Saudi Arabia Apheresis Equipment Market, By Technology
- Turkey Apheresis Equipment Market, By Product
- Turkey Apheresis Equipment Market, By Procedure
- Turkey Apheresis Equipment Market, By Application
- Turkey Apheresis Equipment Market, By Technology
- United Arab Emirates Apheresis Equipment Market, By Product
- United Arab Emirates Apheresis Equipment Market, By Procedure
- United Arab Emirates Apheresis Equipment Market, By Application
- United Arab Emirates Apheresis Equipment Market, By Technology
- Others Apheresis Equipment Market, By Product
- Others Apheresis Equipment Market, By Procedure
- Others Apheresis Equipment Market, By Application
- Others Apheresis Equipment Market, By Technology
- Rest of the World
Table of Contents
1. Introduction
1.1. Report Description
1.2. Research Methodology
1.2.1. Secondary Research
1.2.2. Primary Research
2. Executive Summary
2.1. Key Highlights
3. Market Overview
3.1. Introduction
3.1.1. Market Definition
3.1.2. Market Segmentation
3.2. Market Dynamics
3.2.1. Drivers
3.2.1.1. Favorable Reimbursement Policies
3.2.1.2. Increasing Number of Complicated Surgical Procedures
3.2.1.3. Increasing Demand for plasma and platelets
3.2.2. Restraints
3.2.2.1. Dearth of Qualified Donors
3.2.2.2. High Cost of Instrumentation
3.2.3. Opportunities
3.2.3.1. Emerging Countries to Offer Lucrative Growth Opportunities
4. Apheresis Equipment Market, By Product
4.1. Introduction
4.2. The Apheresis Equipment Market Assessment and Forecast, By Product, 2012-2022
4.3. Apheresis Machine
4.3.1. Market Assessment and Forecast, By Region, 2012-2022 ($Million)
4.4. Disposable Apheresis Kits
4.4.1. Market Assessment and Forecast, By Region, 2012-2022 ($Million)
5. Apheresis Equipment Market, By Procedure
5.1. Introduction
5.2. The Apheresis Equipment Market Assessment and Forecast, By Procedure 2012-2022
5.3. Plasmapheresis
5.3.1. Market Assessment and Forecast, By Region, 2012-2022 ($Million)
5.4. Plateletpheresis
5.4.1. Market Assessment and Forecast, By Region, 2012-2022 ($Million)
5.5. LDL-apheresis
5.5.1. Market Assessment and Forecast, By Region, 2012-2022 ($Million)
5.6. Leukapheresis
5.6.1. Market Assessment and Forecast, By Region, 2012-2022 ($Million)
5.7. Erythrocytapheresis
5.7.1. Market Assessment and Forecast, By Region, 2012-2022 ($Million)
5.8. Photopheresis
5.8.1. Market Assessment and Forecast, By Region, 2012-2022 ($Million)
5.9. Other Procedures
5.9.1. Market Assessment and Forecast, By Region, 2012-2022 ($Million)
6. Apheresis Equipment Market, By Application
6.1. Introduction
6.2. Apheresis Equipment Market Assessment and Forecast, By Application, 2012-2022 ($Million)
6.3. Hematology
6.3.1. Market Assessment and Forecast, By Region, 2012-2022 ($Million)
6.4. Renal Diseases
6.4.1. Market Assessment and Forecast, By Region, 2012-2022 ($Million)
6.5. Neurology
6.5.1. Market Assessment and Forecast, By Region, 2012-2022 ($Million)
6.6. Other Applications
6.6.1. Market Assessment and Forecast, By Region, 2012-2022 ($Million)
7. Apheresis Equipment Market, By Technology
7.1. Introduction
7.2. Apheresis Equipment Market Assessment and Forecast, By Application, 2012-2022 ($Million)
7.3. Centrifugation
7.3.1. Market Assessment and Forecast, By Region, 2012-2022 ($Million)
7.4. Membrane Separation
7.4.1. Market Assessment and Forecast, By Region, 2012-2022 ($Million)
8. Apheresis Equipment Market, By Region
8.1. Introduction
8.2. Apheresis Equipment Market Assessment and Forecast, By Region, 2012-2022 ($Million)
8.3. North America
8.3.1. Market Assessment and Forecast, By Country, 2012-2022 ($Million)
8.3.2. Market Assessment and Forecast, By Product, 2012-2022 ($Million)
8.3.3. Market Assessment and Forecast, By Procedure, 2012-2022 ($Million)
8.3.4. Market Assessment and Forecast, By Application, 2012-2022 ($Million)
8.3.5. Market Assessment and Forecast, By Technology, 2012-2022 ($Million)
8.3.6. U.S.
8.3.6.1. Market Assessment and Forecast, By Product, 2012-2022 ($Million)
8.3.6.2. Market Assessment and Forecast, By Procedure, 2012-2022 ($Million)
8.3.6.3. Market Assessment and Forecast, By Application, 2012-2022 ($Million)
8.3.6.4. Market Assessment and Forecast, By Technology, 2012-2022 ($Million)
8.3.7. Canada
8.3.7.1. Market Assessment and Forecast, By Product, 2012-2022 ($Million)
8.3.7.2. Market Assessment and Forecast, By Procedure, 2012-2022 ($Million)
8.3.7.3. Market Assessment and Forecast, By Application, 2012-2022 ($Million)
8.3.7.4. Market Assessment and Forecast, By Technology, 2012-2022 ($Million)
8.3.8. Mexico
8.3.8.1. Market Assessment and Forecast, By Product, 2012-2022 ($Million)
8.3.8.2. Market Assessment and Forecast, By Procedure, 2012-2022 ($Million)
8.3.8.3. Market Assessment and Forecast, By Application, 2012-2022 ($Million)
8.3.8.4. Market Assessment and Forecast, By Technology, 2012-2022 ($Million)
8.4. Europe
8.4.1. Market Assessment and Forecast, By Country, 2012-2022 ($Million)
8.4.2. Market Assessment and Forecast, By Product, 2012-2022 ($Million)
8.4.3. Market Assessment and Forecast, By Procedure, 2012-2022 ($Million)
8.4.4. Market Assessment and Forecast, By Application, 2012-2022 ($Million)
8.4.5. Market Assessment and Forecast, By Technology, 2012-2022 ($Million)
8.4.6. Germany
8.4.6.1. Market Assessment and Forecast, By Product, 2012-2022 ($Million)
8.4.6.2. Market Assessment and Forecast, By Procedure, 2012-2022 ($Million)
8.4.6.3. Market Assessment and Forecast, By Application, 2012-2022 ($Million)
8.4.6.4. Market Assessment and Forecast, By Technology, 2012-2022 ($Million)
8.4.7. France
8.4.7.1. Market Assessment and Forecast, By Product, 2012-2022 ($Million)
8.4.7.2. Market Assessment and Forecast, By Procedure, 2012-2022 ($Million)
8.4.7.3. Market Assessment and Forecast, By Application, 2012-2022 ($Million)
8.4.7.4. Market Assessment and Forecast, By Technology, 2012-2022 ($Million)
8.4.8. UK
8.4.8.1. Market Assessment and Forecast, By Product, 2012-2022 ($Million)
8.4.8.2. Market Assessment and Forecast, By Procedure, 2012-2022 ($Million)
8.4.8.3. Market Assessment and Forecast, By Application, 2012-2022 ($Million)
8.4.8.4. Market Assessment and Forecast, By Technology, 2012-2022 ($Million)
8.4.9. Italy
8.4.9.1. Market Assessment and Forecast, By Product, 2012-2022 ($Million)
8.4.9.2. Market Assessment and Forecast, By Procedure, 2012-2022 ($Million)
8.4.9.3. Market Assessment and Forecast, By Application, 2012-2022 ($Million)
8.4.9.4. Market Assessment and Forecast, By Technology, 2012-2022 ($Million)
8.4.10. Spain
8.4.10.1. Market Assessment and Forecast, By Product, 2012-2022 ($Million)
8.4.10.2. Market Assessment and Forecast, By Procedure, 2012-2022 ($Million)
8.4.10.3. Market Assessment and Forecast, By Application, 2012-2022 ($Million)
8.4.10.4. Market Assessment and Forecast, By Technology, 2012-2022 ($Million)
8.4.11. Rest of Europe
8.4.11.1. Market Assessment and Forecast, By Product, 2012-2022 ($Million)
8.4.11.2. Market Assessment and Forecast, By Procedure, 2012-2022 ($Million)
8.4.11.3. Market Assessment and Forecast, By Application, 2012-2022 ($Million)
8.4.11.4. Market Assessment and Forecast, By Technology, 2012-2022 ($Million)
8.5. Asia-Pacific
8.5.1. Market Assessment and Forecast, By Country, 2012-2022 ($Million)
8.5.2. Market Assessment and Forecast, By Product, 2012-2022 ($Million)
8.5.3. Market Assessment and Forecast, By Procedure, 2012-2022 ($Million)
8.5.4. Market Assessment and Forecast, By Application, 2012-2022 ($Million)
8.5.5. Market Assessment and Forecast, By Technology, 2012-2022 ($Million)
8.5.6. Japan
8.5.6.1. Market Assessment and Forecast, By Product, 2012-2022 ($Million)
8.5.6.2. Market Assessment and Forecast, By Procedure, 2012-2022 ($Million)
8.5.6.3. Market Assessment and Forecast, By Application, 2012-2022 ($Million)
8.5.6.4. Market Assessment and Forecast, By Technology, 2012-2022 ($Million)
8.5.7. China
8.5.7.1. Market Assessment and Forecast, By Product, 2012-2022 ($Million)
8.5.7.2. Market Assessment and Forecast, By Procedure, 2012-2022 ($Million)
8.5.7.3. Market Assessment and Forecast, By Application, 2012-2022 ($Million)
8.5.7.4. Market Assessment and Forecast, By Technology, 2012-2022 ($Million)
8.5.8. Australia
8.5.8.1. Market Assessment and Forecast, By Product, 2012-2022 ($Million)
8.5.8.2. Market Assessment and Forecast, By Procedure, 2012-2022 ($Million)
8.5.8.3. Market Assessment and Forecast, By Application, 2012-2022 ($Million)
8.5.8.4. Market Assessment and Forecast, By Technology, 2012-2022 ($Million)
8.5.9. India
8.5.9.1. Market Assessment and Forecast, By Product, 2012-2022 ($Million)
8.5.9.2. Market Assessment and Forecast, By Procedure, 2012-2022 ($Million)
8.5.9.3. Market Assessment and Forecast, By Application, 2012-2022 ($Million)
8.5.9.4. Market Assessment and Forecast, By Technology, 2012-2022 ($Million)
8.5.10. South Korea
8.5.10.1. Market Assessment and Forecast, By Product, 2012-2022 ($Million)
8.5.10.2. Market Assessment and Forecast, By Procedure, 2012-2022 ($Million)
8.5.10.3. Market Assessment and Forecast, By Application, 2012-2022 ($Million)
8.5.10.4. Market Assessment and Forecast, By Technology, 2012-2022 ($Million)
8.5.11. Rest of Asia-Pacific
8.5.11.1. Market Assessment and Forecast, By Product, 2012-2022 ($Million)
8.5.11.2. Market Assessment and Forecast, By Procedure, 2012-2022 ($Million)
8.5.11.3. Market Assessment and Forecast, By Application, 2012-2022 ($Million)
8.5.11.4. Market Assessment and Forecast, By Technology, 2012-2022 ($Million)
8.6. Rest of the World
8.6.1. Market Assessment and Forecast, By Country, 2012-2022 ($Million)
8.6.2. Market Assessment and Forecast, By Product, 2012-2022 ($Million)
8.6.3. Market Assessment and Forecast, By Procedure, 2012-2022 ($Million)
8.6.4. Market Assessment and Forecast, By Application, 2012-2022 ($Million)
8.6.5. Market Assessment and Forecast, By Technology, 2012-2022 ($Million)
8.6.6. Brazil
8.6.6.1. Market Assessment and Forecast, By Product, 2012-2022 ($Million)
8.6.6.2. Market Assessment and Forecast, By Procedure, 2012-2022 ($Million)
8.6.6.3. Market Assessment and Forecast, By Application, 2012-2022 ($Million)
8.6.6.4. Market Assessment and Forecast, By Technology, 2012-2022 ($Million)
8.6.7. Turkey
8.6.7.1. Market Assessment and Forecast, By Product, 2012-2022 ($Million)
8.6.7.2. Market Assessment and Forecast, By Procedure, 2012-2022 ($Million)
8.6.7.3. Market Assessment and Forecast, By Application, 2012-2022 ($Million)
8.6.7.4. Market Assessment and Forecast, By Technology, 2012-2022 ($Million)
8.6.8. Saudi Arabia
8.6.8.1. Market Assessment and Forecast, By Product, 2012-2022 ($Million)
8.6.8.2. Market Assessment and Forecast, By Procedure, 2012-2022 ($Million)
8.6.8.3. Market Assessment and Forecast, By Application, 2012-2022 ($Million)
8.6.8.4. Market Assessment and Forecast, By Technology, 2012-2022 ($Million)
8.6.9. South Africa
8.6.9.1. Market Assessment and Forecast, By Product, 2012-2022 ($Million)
8.6.9.2. Market Assessment and Forecast, By Procedure, 2012-2022 ($Million)
8.6.9.3. Market Assessment and Forecast, By Application, 2012-2022 ($Million)
8.6.9.4. Market Assessment and Forecast, By Technology, 2012-2022 ($Million)
8.6.10. United Arab Emirates
8.6.10.1. Market Assessment and Forecast, By Product, 2012-2022 ($Million)
8.6.10.2. Market Assessment and Forecast, By Procedure, 2012-2022 ($Million)
8.6.10.3. Market Assessment and Forecast, By Application, 2012-2022 ($Million)
8.6.10.4. Market Assessment and Forecast, By Technology, 2012-2022 ($Million)
8.6.11. Others
8.6.11.1. Market Assessment and Forecast, By Product, 2012-2022 ($Million)
8.6.11.2. Market Assessment and Forecast, By Procedure, 2012-2022 ($Million)
8.6.11.3. Market Assessment and Forecast, By Application, 2012-2022 ($Million)
8.6.11.4. Market Assessment and Forecast, By Technology, 2012-2022 ($Million)
9. Company Profiles
9.1. Asahi Kasei Corporation
9.1.1. Business Overview
9.1.2. Product Portfolio
9.1.3. Key Financials
9.1.4. Strategic Developments
9.2. Fresenius SE & Co. KGaA
9.2.1. Business Overview
9.2.2. Product Portfolio
9.2.3. Key Financials
9.2.4. Strategic Developments
9.3. Terumo BCT, Inc. (a part of Terumo Corporation)
9.3.1. Business Overview
9.3.2. Product Portfolio
9.3.3. Key Financials
9.3.4. Strategic Developments
9.4. Therakos, Inc.
9.4.1. Business Overview
9.4.2. Product Portfolio
9.4.3. Key Financials
9.4.4. Strategic Developments
9.5. B. Braun Melsungen AG
9.5.1. Business Overview
9.5.2. Product Portfolio
9.5.3. Key Financials
9.5.4. Strategic Developments
9.6. Kawasumi Laboratories, Inc.
9.6.1. Business Overview
9.6.2. Product Portfolio
9.6.3. Key Financials
9.6.4. Strategic Developments
9.7. Hemacare Corporation
9.7.1. Business Overview
9.7.2. Product Portfolio
9.7.3. Key Financials
9.7.4. Strategic Developments
9.8. Haemonetics Corporation
9.8.1. Business Overview
9.8.2. Product Portfolio
9.8.3. Key Financials
9.8.4. Strategic Developments
9.9. Kaneka Medix Corporation
9.9.1. Business Overview
9.9.2. Product Portfolio
9.9.3. Key Financials
9.9.4. Strategic Developments
9.10. Cerus Corporation
9.10.1. Business Overview
9.10.2. Product Portfolio
9.10.3. Key Financials
9.10.4. Strategic Developments
List of Tables
Table 1.Global Apheresis Equipment Market, By Product, 2012-2022 ($Million)
Table 2.Apheresis machine Market, By Region, 2012-2022 ($Million)
Table 3.Disposable Apheresis kits Market, By Region, 2012-2022 ($Million)
Table 4.Apheresis Equipment Market, By Procedure, 2012-2022 ($Million)
Table 5.PlasmApheresis Market, By Region, 2012-2022 ($Million)
Table 6.Plateletpheresis Market, By Region, 2012-2022 ($Million)
Table 7.LDL-Apheresis Market, By Region, 2012-2022 ($Million)
Table 8.LeukApheresis Market, By Region, 2012-2022 ($Million)
Table 9.ErythrocytApheresis Market, By Region, 2012-2022 ($Million)
Table 10.Photopheresis Market, By Region, 2012-2022 ($Million)
Table 11.Other Procedures Market, By Region, 2012-2022 ($Million)
Table 12.Apheresis Equipment Market, By Application, 2012-2022 ($Million)
Table 13.Hematology Market, By Region, 2012-2022 ($Million)
Table 14.Renal Diseases Market, By Region, 2012-2022 ($Million)
Table 15.Neurology Market, By Region, 2012-2022 ($Million)
Table 16.Other Applications Market, By Region, 2012-2022 ($Million)
Table 17.Apheresis Equipment Market, By Technology, 2012-2022 ($Million)
Table 15.Centrifugation Market, By Region, 2012-2022 ($Million)
Table 16.Membrane Separation Market, By Region, 2012-2022 ($Million)
Table 18.Apheresis Equipment Market, By Region, 2012-2022 ($Million)
Table 19.North America Apheresis Equipment Market, By Country, 2012-2022 ($Million)
Table 20.North America Apheresis Equipment Market, By Product, 2012-2022 ($Million)
Table 21.North America Apheresis Equipment Market, By Procedure, 2012-2022 ($Million)
Table 22.North America Apheresis Equipment Market, By Application, 2012-2022 ($Million)
Table 23.North America Apheresis Equipment Market, By Technology, 2012-2022 ($Million)
Table 24.U.S. Apheresis Equipment Market, By Product, 2012-2022 ($Million)
Table 25.U.S. Apheresis Equipment Market, By Procedure, 2012-2022 ($Million)
Table 26.U.S. Apheresis Equipment Market, By Application, 2012-2022 ($Million)
Table 27.U.S. Apheresis Equipment Market, By Technology, 2012-2022 ($Million)
Table 28.Canada Apheresis Equipment Market, By Product, 2012-2022 ($Million)
Table 29.Canada Apheresis Equipment Market, By Procedure, 2012-2022 ($Million)
Table 30.Canada Apheresis Equipment Market, By Application, 2012-2022 ($Million)
Table 31.Canada Apheresis Equipment Market, By Technology, 2012-2022 ($Million)
Table 32.Mexico Apheresis Equipment Market, By Product, 2012-2022 ($Million)
Table 33.Mexico Apheresis Equipment Market, By Procedure, 2012-2022 ($Million)
Table 34.Mexico Apheresis Equipment Market, By Application, 2012-2022 ($Million)
Table 35.Mexico Apheresis Equipment Market, By Technology, 2012-2022 ($Million)
Table 36.Europe Apheresis Equipment Market, By Country, 2012-2022 ($Million)
Table 37.Europe Apheresis Equipment Market, By Product, 2012-2022 ($Million)
Table 38.Europe Apheresis Equipment Market, By Procedure, 2012-2022 ($Million)
Table 39.Europe Apheresis Equipment Market, By Application, 2012-2022 ($Million)
Table 40.Europe Apheresis Equipment Market, By Technology, 2012-2022 ($Million)
Table 41.Germany Apheresis Equipment Market, By Product, 2012-2022 ($Million)
Table 42.Germany Apheresis Equipment Market, By Procedure, 2012-2022 ($Million)
Table 43.Germany Apheresis Equipment Market, By Application, 2012-2022 ($Million)
Table 44.Germany Apheresis Equipment Market, By Technology, 2012-2022 ($Million)
Table 45.France Apheresis Equipment Market, By Product, 2012-2022 ($Million)
Table 46.France Apheresis Equipment Market, By Procedure, 2012-2022 ($Million)
Table 47.France Apheresis Equipment Market, By Application, 2012-2022 ($Million)
Table 48.France Apheresis Equipment Market, By Technology, 2012-2022 ($Million)
Table 49.UK Apheresis Equipment Market, By Product, 2012-2022 ($Million)
Table 50.UK Apheresis Equipment Market, By Procedure, 2012-2022 ($Million)
Table 51.UK Apheresis Equipment Market, By Application, 2012-2022 ($Million)
Table 52.UK Apheresis Equipment Market, By Technology, 2012-2022 ($Million)
Table 53.Italy Apheresis Equipment Market, By Product, 2012-2022 ($Million)
Table 54.Italy Apheresis Equipment Market, By Procedure, 2012-2022 ($Million)
Table 55.Italy Apheresis Equipment Market, By Application, 2012-2022 ($Million)
Table 56.Italy Apheresis Equipment Market, By Technology, 2012-2022 ($Million)
Table 57.Spain Apheresis Equipment Market, By Product, 2012-2022 ($Million)
Table 58.Spain Apheresis Equipment Market, By Procedure, 2012-2022 ($Million)
Table 59.Spain Apheresis Equipment Market, By Application, 2012-2022 ($Million)
Table 60.Spain Apheresis Equipment Market, By Technology, 2012-2022 ($Million)
Table 65.Rest of Europe Apheresis Equipment Market, By Product, 2012-2022 ($Million)
Table 66.Rest of Europe Apheresis Equipment Market, By Procedure, 2012-2022 ($Million)
Table 67.Rest of Europe Apheresis Equipment Market, By Application, 2012-2022 ($Million)
Table 68.Rest of Europe Apheresis Equipment Market, By Technology, 2012-2022 ($Million)
Table 69.Asia-Pacific Apheresis Equipment Market, By Country, 2012-2022 ($Million)
Table 70.Asia-Pacific Apheresis Equipment Market, By Product, 2012-2022 ($Million)
Table 71.Asia-Pacific Apheresis Equipment Market, By Procedure, 2012-2022 ($Million)
Table 72.Asia-Pacific Apheresis Equipment Market, By Application, 2012-2022 ($Million)
Table 73.Asia-Pacific Apheresis Equipment Market, By Technology, 2012-2022 ($Million)
Table 74.Japan Apheresis Equipment Market, By Product, 2012-2022 ($Million)
Table 75.Japan Apheresis Equipment Market, By Procedure, 2012-2022 ($Million)
Table 76.Japan Apheresis Equipment Market, By Application, 2012-2022 ($Million)
Table 77.Japan Apheresis Equipment Market, By Technology, 2012-2022 ($Million)
Table 78.China Apheresis Equipment Market, By Product, 2012-2022 ($Million)
Table 79.China Apheresis Equipment Market, By Procedure, 2012-2022 ($Million)
Table 80.China Apheresis Equipment Market, By Application, 2012-2022 ($Million)
Table 81.China Apheresis Equipment Market, By Technology, 2012-2022 ($Million)
Table 82.Australia Apheresis Equipment Market, By Product, 2012-2022 ($Million)
Table 83.Australia Apheresis Equipment Market, By Procedure, 2012-2022 ($Million)
Table 84.Australia Apheresis Equipment Market, By Application, 2012-2022 ($Million)
Table 85.Australia Apheresis Equipment Market, By Technology, 2012-2022 ($Million)
Table 86.India Apheresis Equipment Market, By Product, 2012-2022 ($Million)
Table 87.India Apheresis Equipment Market, By Procedure, 2012-2022 ($Million)
Table 88.India Apheresis Equipment Market, By Application, 2012-2022 ($Million)
Table 89.India Apheresis Equipment Market, By Technology, 2012-2022 ($Million)
Table 90.South Korea Apheresis Equipment Market, By Product, 2012-2022 ($Million)
Table 91.South Korea Apheresis Equipment Market, By Procedure, 2012-2022 ($Million)
Table 92.South Korea Apheresis Equipment Market, By Application, 2012-2022 ($Million)
Table 93.South Korea Apheresis Equipment Market, By Technology, 2012-2022 ($Million)
Table 94.Rest of Asia-Pacific Apheresis Equipment Market, By Product, 2012-2022 ($Million)
Table 95.Rest of Asia-Pacific Apheresis Equipment Market, By Procedure, 2012-2022 ($Million)
Table 96.Rest of Asia-Pacific Apheresis Equipment Market, By Application, 2012-2022 ($Million)
Table 97.Rest of Asia-Pacific Apheresis Equipment Market, By Technology, 2012-2022 ($Million)
Table 98.Rest of the World Apheresis Equipment Market, By Country, 2012-2022 ($Million)
Table 99.Rest of the World Apheresis Equipment Market, By Product, 2012-2022 ($Million)
Table 100.Rest of the World Apheresis Equipment Market, By Procedure, 2012-2022 ($Million)
Table 101.Rest of the World Apheresis Equipment Market, By Application, 2012-2022 ($Million)
Table 102.Rest of the World Apheresis Equipment Market, By Technology, 2012-2022 ($Million)
Table 103.Brazil Apheresis Equipment Market, By Product, 2012-2022 ($Million)
Table 104.Brazil Apheresis Equipment Market, By Procedure, 2012-2022 ($Million)
Table 105.Brazil Apheresis Equipment Market, By Application, 2012-2022 ($Million)
Table 106.Brazil Apheresis Equipment Market, By Technology, 2012-2022 ($Million)
Table 107.Turkey Apheresis Equipment Market, By Product, 2012-2022 ($Million)
Table 108.Turkey Apheresis Equipment Market, By Procedure, 2012-2022 ($Million)
Table 109.Turkey Apheresis Equipment Market, By Application, 2012-2022 ($Million)
Table 110.Turkey Apheresis Equipment Market, By Technology, 2012-2022 ($Million)
Table 111.Saudi Arabia Apheresis Equipment Market, By Product, 2012-2022 ($Million)
Table 112.Saudi Arabia Apheresis Equipment Market, By Procedure, 2012-2022 ($Million)
Table 113.Saudi Arabia Apheresis Equipment Market, By Application, 2012-2022 ($Million)
Table 114.Saudi Arabia Apheresis Equipment Market, By Technology, 2012-2022 ($Million)
Table 115.South Africa Apheresis Equipment Market, By Product, 2012-2022 ($Million)
Table 116.South Africa Apheresis Equipment Market, By Procedure, 2012-2022 ($Million)
Table 117.South Africa Apheresis Equipment Market, By Application, 2012-2022 ($Million)
Table 118.South Africa Apheresis Equipment Market, By Technology, 2012-2022 ($Million)
Table 119.United Arab Emirates Apheresis Equipment Market, By Product, 2012-2022 ($Million)
Table 120.United Arab Emirates Apheresis Equipment Market, By Procedure, 2012-2022 ($Million)
Table 121.United Arab Emirates Apheresis Equipment Market, By Application, 2012-2022 ($Million)
Table 122.United Arab Emirates Apheresis Equipment Market, By Technology, 2012-2022 ($Million)
Table 123.Others Apheresis Equipment Market, By Product, 2012-2022 ($Million)
Table 124.Others Apheresis Equipment Market, By Procedure, 2012-2022 ($Million)
Table 125.Others Apheresis Equipment Market, By Application, 2012-2022 ($Million)
Table 126.Others Apheresis Equipment Market, By Technology, 2012-2022 ($Million)
Table 127.Asahi Kasei Corporation: Key Strategic Developments, 2017-2017
Table 128.Fresenius SE & Co. KGaA: Key Strategic Developments, 2017-2017
Table 129.Terumo BCT, Inc. (a part of Terumo Corporation): Key Strategic Developments, 2017-2017
Table 130.Therakos, Inc.: Key Strategic Developments, 2017-2017
Table 131.B. Braun Melsungen AG: Key Strategic Developments, 2017-2017
Table 132.Kawasumi Laboratories, Inc.: Key Strategic Developments, 2017-2017
Table 133.Hemacare Corporation: Key Strategic Developments, 2017-2017
Table 134.Haemonetics Corporation: Key Strategic Developments, 2017-2017
Table 135.Kaneka Medix Corporation: Key Strategic Developments, 2017-2017
Table 136.Cerus Corporation: Key Strategic Developments, 2017-2017
List of Figures
Figure 1.Apheresis Equipment Market Share, By Product, 2012 & 2022 ($Million)
Figure 2.Apheresis Equipment Market Share, By Procedure, 2012 & 2022 ($Million)
Figure 3.Apheresis Equipment Market Share, By Application, 2012 & 2022 ($Million)
Figure 4.Apheresis Equipment Market Share, By Technology, 2012 & 2022 ($Million)
Figure 5.Apheresis Equipment Market, By Region, 2012 & 2022, ($Million)
Figure 6.Asahi Kasei Corporation: Net Revenues, 2017-2017 ($Million)
Figure 7.Asahi Kasei Corporation: Net Revenue Share, By Segment, 2017
Figure 8.Asahi Kasei Corporation: Net Revenue Share, By Geography, 2017
Figure 9.Fresenius SE & Co. KGaA: Net Revenues, 2017-2017 ($Million)
Figure 10.Fresenius SE & Co. KGaA: Net Revenue Share, By Segment, 2017
Figure 11.Fresenius SE & Co. KGaA: Net Revenue Share, By Geography, 2017
Figure 12.Terumo BCT, Inc.: Net Revenues, 2017-2017 ($Million)
Figure 13.Terumo BCT, Inc.: Net Revenue Share, By Segment, 2017
Figure 14.Terumo BCT, Inc.: Net Revenue Share, By Geography, 2017
Figure 15.Therakos, Inc.: Net Revenues, 2017-2017 ($Million)
Figure 16.Therakos, Inc.: Net Revenue Share, By Segment, 2017
Figure 17.Therakos, Inc.: Net Revenue Share, By Geography, 2017
Figure 18.B. Braun Melsungen AG: Net Revenues, 2017-2017 ($Million)
Figure 19.B. Braun Melsungen AG: Net Revenue Share, By Segment, 2017
Figure 20.B. Braun Melsungen AG: Net Revenue Share, By Geography, 2017
Figure 21.Kawasumi Laboratories, Inc.: Net Revenues, 2017-2017 ($Million)
Figure 22.Kawasumi Laboratories, Inc.: Net Revenue Share, By Segment, 2017
Figure 23.Kawasumi Laboratories, Inc.: Net Revenue Share, By Geography, 2017
Figure 24.Hemacare Corporation: Net Revenues, 2017-2017 ($Million)
Figure 25.Hemacare Corporation: Net Revenue Share, By Segment, 2017
Figure 26.Hemacare Corporation: Net Revenue Share, By Geography, 2017
Figure 27.Haemonetics Corporation: Net Revenues, 2017-2017 ($Million)
Figure 28.Haemonetics Corporation: Net Revenue Share, By Segment, 2017
Figure 29.Haemonetics Corporation: Net Revenue Share, By Geography, 2017
Figure 30.Haemonetics Corporation: Net Revenues, 2017-2017 ($Million)
Figure 31.Haemonetics Corporation: Net Revenue Share, By Segment, 2017
Figure 32.Haemonetics Corporation: Net Revenue Share, By Geography, 2017
Figure 33.Kaneka Medix Corporation: Net Revenues, 2017-2017 ($Million)
Figure 34.Kaneka Medix Corporation: Net Revenue Share, By Segment, 2017
Figure 35.Kaneka Medix Corporation: Net Revenue Share, By Geography, 2017
Figure 36.Cerus Corporation: Net Revenues, 2017-2017 ($Million)
Figure 37.Cerus Corporation: Net Revenue Share, By Segment, 2017
Figure 38.Cerus Corporation: Net Revenue Share, By Geography, 2017
Research Methodology
We use both primary as well as secondary research for our market surveys, estimates and for developing forecast. Our research process commence by analyzing the problem which enable us to design the scope for our research study. Our research process is uniquely designed with enough flexibility to adjust according to changing nature of products and markets, while retaining core element to ensure reliability and accuracy in research findings. We understand both macro and micro-economic factors to evaluate and forecast different market segments.
Data Mining
Data is extensively collected through various secondary sources such as annual reports, investor presentations, SEC filings, and other corporate publications. We also refer trade magazines, technical journals, paid databases such as Factiva and Bloomberg, industry trade journals, scientific journals, and social media data to understand market dynamics and industry trends. Further, we also conduct primary research to understand market drivers, restraints, opportunities, challenges, and competitive scenario to build our analysis.
Data Collection Matrix
|
Data Collection Matrix |
Supply Side |
Demand Side |
|
Primary Data Sources |
|
|
|
Secondary Data Sources |
|
|
Market Modeling and Forecasting
We use epidemiology and capital equipment-based models to forecast market size of different segments at country and regional level.
- Epidemiology-based Forecasting Model: This method uses epidemiology data gathered through various publications and from physicians to estimate population of patients, flow of treatment of individual disease and therapies. The data collected through this method includes statics on incidence of disease, population suffering from disease, and treatment population. This method is used to understand:
- Number of patients for particular device or medical procedure and
- Repeated use of particular device depending on health and condition of patient
- Capital-based Forecasting Model: This method of forecasting is based on number of replacements, installed-based and new sales of capital equipment used in various healthcare and diagnostic centers. These three parameters are calculated and forecast is developed. Installation base is calculated as average number of units per facility; while sales for particular year is calculated from number of new and replace units. Secondary data is collected through various supply chain intermediaries and opinion leaders to arrive at installation and sales rate. These techniques help our analysts in validating market and developed market estimates and forecast.
We do forecast on basis of several parameters such as market drivers, market opportunities, industry trends government regulations, raw materials supply and trade dynamics to ensure relevance of forecast with market scenario. With increasing need to granulized information, we used bottom-up methodology for forecasting where we evaluate each regional segment differently and combined all forecast to develop final market forecast.
Data Validation
We believe primary research is a very important tool in analyzing and forecasting different markets. In order to make sure accuracy of our findings, our team conducts primary interviews at every stage of research to gain deep insights into current business environment and future trends and key developments in market. This includes use of various methods such as telephonic interviews, focus groups, face to face interviews and questionnaires to validate our research from all aspects. We validate our data through primary research from key industry leaders such as CEO, product managers, marketing managers, suppliers, distributors, and consumers are frequently interviewed. These interviews provide valuable insights which help us to have better market understanding besides validating our estimates and forecast.
Data Triangulation

Industry Analysis
|
Qualitative Data |
Quantitative Data (2017-2025) |
|
|