Animal Feed Additives Market by Product and Livestock - Global Industry Analysis and Forecast to 2027
Published On : September 2017 Pages : 102 Category: Food and Beverages Report Code : FB09200
Industry Trend Analysis
The global animal feed additives market was worth USD 29.09 billion in 2017 and is prognosticated to be nearly USD 44.40 billion by 2027, growing at a compound annual growth rate (CAGR) of 4.81% during the forecast period. Growth in consumption of milk and meat products across the globe to gain proteins and various nutrients is anticipated to boost the growth of this market. Food additives are consistent component of the increasing meat production industry across the globe. These food additives are known to be the catalysts that assist in various activities such as enhancing the rate of weight gain in animals, the intake of vitamins, prevention of disease, conservation and digestion which result in improved quality of meat production. Due to such factors, the animal feed additives market is anticipated to witness significant growth in the consecutive years. Livestock animals are stuck with a number of disease that also include bird flu, swine flu, mouth and foot infections which has raised the concerns related to safety and the quality of meat products. This has led to the utilization of specialty additives. The official forbiddance on the use of antibiotics in the United States and Europe is said to expand the market for alternate products such as enzymes, acidifiers and amino acids. However, protruding demand of grains such as barley, maize and wheat from other commercial foods is anticipated to hinder the growth of the market. Rise in advanced technologies coupled with consistent enhancements in in the final production on the basis of type of feed and fluctuating regulatory trends are boosting the market.
Product Outlook and Trend Analysis
Amino acids that include tryptophan, thiamine, lysine and methionine came up as the leading category of products and registered more than 30 percent of the total share in 2017. The increasing consumption of meat specifically in regions like the Asia Pacific and Middle East is expected to be the major factor that boosts the growth of this market. Lysine is known to be the prime amino acid that is extremely useful in the growth of animal, specifically for swine and poultry. The benefit of lysine that is synthetically formulated over soybean which is known as its natural substitute is said to spur the requirement. The nutritional value of lysine is equal to that of soybean. Furthermore, it is widely known to be an alternative in the animal feed that is more economic. The lysine market is said to witness significant growth due to additional factors such as the official forbiddance of blood meal and bone meal in various regions. The second largest segment that came up in the animal feed additives is the antibiotics that registered more than 26 percent of the total volume in the year 2017. Antibiotics possess the ability to promote growth in livestock which is a major factor that influenced the growth of the market. Because of the utilization of antibiotics being forbidden completely in the United States and Europe, maximum of the antibiotics is anticipated to hail from the Latin American and Asia-Pacific regions.
Livestock outlook and Trend Analysis
The requirement for feed additives across the globe has witnessed exemplar shift because of increasing awareness of consumers. The largest segment of livestock in the year 2017 was poultry that registered more than 34 percent of the total share. The disruption of avian influenza or bird flu hiked the awareness regarding the poultry health and raised the demand for high-quality meat products. The disruption of bird flu resulted in the adoption of strict regulations that spurred the requirement of certain additives across the globe. Furthermore, production of poultry meat is anticipated to grow rapidly across the globe which will raise the demand of additives.
Regional Outlook and Trend Analysis
The animal feed additives market was dominated by Asia Pacific that registered 33 percent of the total share in the year 2017. Upcoming economies in the Asia Pacific region that include Indonesia, china and India have been witnessing major growth in the economy. Due to factors such as change in lifestyle and increased disposable income, their food pattern has switched to meat products from conventional food. The largest country for consumption and production of meat in the world is China. Growing population and standard of living has boosted the demand of meat. Additionally, increasing consumption of meat products in the United States and Mexico along with strict regulations in regard to the quality of meat are key factors that influence the growth of the market. Furthermore, the availability of raw materials in abundance like dextrose and maize is also anticipated to boost the global animal feed additive market.
Competitive Insights
The global animal feed additives market is widely competitive. Some of the leading companies in the global animal feed additives market are Danisco A/S, Kemin Industries, Cargill, Evonik Industries, DSM and Novozymes A/S. The main parameters for being competitive in the industry are the developments of the applications and customized products in order to enhance the portfolio and regional existence.
The global animal feed additives market is segmented as follows-
By Product
- Antioxidants
- Antibiotic
- Feed Acidifiers
- Feed Enzymes
- Non-Starch Polysaccharides & Others
- Phytase
- Amino Acids
- Tryptophan
- Threonine
- Methionine
- Lysine
- Others
- Vitamin A,B,C,E
- Others
By Livestock
- Aquaculture
- Pork/Swine
- Cattle
- Poultry
- Others
By Region
- North America
- U.S
- Canada
- Mexico
- Europe
- Germany
- France
- UK
- Italy
- Spain
- Rest of Europe
- Asia-Pacific
- Japan
- China
- Australia
- India
- South Korea
- Rest of Asia Pacific
- Rest of the World
- Brazil
- South Africa
- Saudi Arabia
- United Arab Emirates
- Others
Some of the key questions answered by the report are:
- What was the market size in 2017 and forecast from 2022 to 2027?
- What will be the industry market growth from 2022 to 2027?
- What are the major drivers, restraints, opportunities, challenges, and industry trends and their impact on the market forecast?
- What are the major segments leading the market growth and why?
- Which are the leading players in the market and what are the major strategies adopted by them to sustain the market competition?
Market Classification
- Animal Feed Additives Market, By Product, Estimates and Forecast, 2017-2027 ($Million)
- Antioxidants
- Antibiotic
- Feed Acidifiers
- Feed Enzymes
- Non-Starch Polysaccharides & Others
- Phytase
- Amino Acids
- Tryptophan
- Threonine
- Methionine
- Lysine
- Others
- Vitamin A,B,C,E
- Other Products
- Animal Feed Additives Market, By Livestock, Estimates and Forecast, 2017-2027 ($Million)
- Aquaculture
- Pork/Swine
- Cattle
- Poultry
- Other Livestock
- Animal Feed Additives Market, By Region, Estimates and Forecast, 2017-2027 ($Million)
- North America
- North America Animal Feed Additives Market, By Country
- North America Animal Feed Additives Market, By Product
- North America Animal Feed Additives Market, By Livestock
- U.S. Animal Feed Additives Market, By Product
- U.S. Animal Feed Additives Market, By Livestock
- Canada Animal Feed Additives Market, By Product
- Canada Animal Feed Additives Market, By Livestock
- Mexico Animal Feed Additives Market, By Product
- Mexico Animal Feed Additives Market, By Livestock
-
- Europe
- Europe Animal Feed Additives Market, By Country
- Europe Animal Feed Additives Market, By Product
- Europe Animal Feed Additives Market, By Livestock
- Germany Animal Feed Additives Market, By Product
- Germany Animal Feed Additives Market, By Livestock
- France Animal Feed Additives Market, By Product
- France Animal Feed Additives Market, By Livestock
- UK Animal Feed Additives Market, By Product
- UK Animal Feed Additives Market, By Livestock
- Italy Animal Feed Additives Market, By Product
- Italy Animal Feed Additives Market, By Livestock
- Spain Animal Feed Additives Market, By Product
- Spain Animal Feed Additives Market, By Livestock
- Rest of Europe Animal Feed Additives Market, By Product
- Rest of Europe Animal Feed Additives Market, By Livestock
-
- Asia-Pacific
- Asia-Pacific Animal Feed Additives Market, By Country
- Asia-Pacific Animal Feed Additives Market, By Product
- Asia-Pacific Animal Feed Additives Market, By Livestock
- Japan Animal Feed Additives Market, By Product
- Japan Animal Feed Additives Market, By Livestock
- Australia Animal Feed Additives Market, By Product
- Australia Animal Feed Additives Market, By Livestock
- India Animal Feed Additives Market, By Product
- India Animal Feed Additives Market, By Livestock
- South Korea Animal Feed Additives Market, By Product
- South Korea Animal Feed Additives Market, By Livestock
- Rest of Asia-Pacific Animal Feed Additives Market, By Product
- Rest of Asia-Pacific Animal Feed Additives Market, By Livestock
- Asia-Pacific
-
- Rest of the World
- Rest of the World Animal Feed Additives Market, By Country
- Rest of the World Animal Feed Additives Market, By Product
- Rest of the World Animal Feed Additives Market, By Livestock
- Brazil Animal Feed Additives Market, By Product
- Brazil Animal Feed Additives Market, By Livestock
- South Africa Animal Feed Additives Market, By Product
- South Africa Animal Feed Additives Market, By Livestock
- Saudi Arabia Animal Feed Additives Market, By Product
- Saudi Arabia Animal Feed Additives Market, By Livestock
- Turkey Animal Feed Additives Market, By Product
- Turkey Animal Feed Additives Market, By Livestock
- United Arab Emirates Animal Feed Additives Market, By Product
- United Arab Emirates Animal Feed Additives Market, By Livestock
- Others Animal Feed Additives Market, By Product
- Others Animal Feed Additives Market, By Livestock
- Rest of the World
Table of Contents
1.Introduction
1.1.Report Description
1.2.Research Methodology
1.2.1. Secondary Research
1.2.2. Primary Research
2.Executive Summary
2.1.Key Highlights
3.Market Overview
3.1.Introduction
3.1.1. Market Definition
3.1.2. Market Segmentation
3.2.Market Share Analysis
3.3.Market Dynamics
3.3.1. Drivers
3.3.1.1.Industrialization of meat production
3.3.1.2.Rise in awareness for meat quality and dairy products
3.3.1.3.Outbreak of livestock diseases
3.3.2. Restraints
3.3.2.1.High cost of operations
3.3.2.2.Regulatory Impositions and subsequent ban of antibiotics
3.3.3. Opportunities
3.3.3.1.Increase in feed costs
3.4.Industry Trends
4.Animal Feed Additives Market, By Product
4.1.Introduction
4.2.Animal Feed Additives Market Assessment and Forecast, By Product, 2017-2027
4.3.Antioxidants
4.3.1. Market Assessment and Forecast, By Region, 2017-2027 ($Million)
4.4.Antibiotic
4.4.1. Market Assessment and Forecast, By Region, 2017-2027 ($Million)
4.5.Feed Acidifiers
4.5.1. Market Assessment and Forecast, By Region, 2017-2027 ($Million)
4.6.Feed Enzymes
4.6.1. Market Assessment and Forecast, By Type, 2017-2027 ($Million)
4.6.2. Market Assessment and Forecast, By Region, 2017-2027 ($Million)
4.6.2.1.Non-Starch Polysaccharides & Others
4.6.2.1.1.Market Assessment and Forecast, By Region, 2017-2027 ($Million)
4.6.2.2.Phytase
4.6.2.2.1.Market Assessment and Forecast, By Region, 2017-2027 ($Million)
4.7.Amino Acids
4.7.1. Market Assessment and Forecast, By Type, 2017-2027 ($Million)
4.7.2. Market Assessment and Forecast, By Region, 2017-2027 ($Million)
4.7.2.1.Tryptophan
4.7.2.1.1.Market Assessment and Forecast, By Region, 2017-2027 ($Million)
4.7.2.2.Threonine
4.7.2.2.1.Market Assessment and Forecast, By Region, 2017-2027 ($Million)
4.7.2.3.Methionine
4.7.2.3.1.Market Assessment and Forecast, By Region, 2017-2027 ($Million)
4.7.2.4.Lysine
4.7.2.4.1.Market Assessment and Forecast, By Region, 2017-2027 ($Million)
4.7.2.5.Others
4.7.2.5.1.Market Assessment and Forecast, By Region, 2017-2027 ($Million)
4.8.Vitamin A,B,C,E
4.8.1. Market Assessment and Forecast, By Region, 2017-2027 ($Million)
4.9.Others
4.9.1. Market Assessment and Forecast, By Region, 2017-2027 ($Million)
5.Animal Feed Additives Market, By Livestock
5.1.Introduction
5.2.Animal Feed Additives Market Assessment and Forecast, By Livestock, 2017-2027
5.3.Aquaculture
5.3.1. Market Assessment and Forecast, By Region, 2017-2027 ($Million)
5.4.Pork/Swine
5.4.1. Market Assessment and Forecast, By Region, 2017-2027 ($Million)
5.5.Cattle
5.5.1. Market Assessment and Forecast, By Region, 2017-2027 ($Million)
5.6.Poultry
5.6.1. Market Assessment and Forecast, By Region, 2017-2027 ($Million)
5.7.Others
5.7.1. Market Assessment and Forecast, By Region, 2017-2027 ($Million)
6.Animal Feed Additives Market, By Region
6.1.Introduction
6.2.Animal Feed Additives Market Assessment and Forecast, By Region, 2017-2027 ($Million)
6.3.North America
6.3.1. Market Assessment and Forecast, By Country, 2017-2027 ($Million)
6.3.2. Market Assessment and Forecast, By Product, 2017-2027 ($Million)
6.3.3. Market Assessment and Forecast, By Livestock, 2017-2027 ($Million)
6.3.3.1.U.S.
6.3.3.1.1.Market Assessment and Forecast, By Product, 2017-2027 ($Million)
6.3.3.1.2.Market Assessment and Forecast, By Livestock, 2017-2027 ($Million)
6.3.3.2.Canada
6.3.3.2.1.Market Assessment and Forecast, By Product, 2017-2027 ($Million)
6.3.3.2.2.Market Assessment and Forecast, By Livestock, 2017-2027 ($Million)
6.3.3.3.Mexico
6.3.3.3.1.Market Assessment and Forecast, By Product, 2017-2027 ($Million)
6.3.3.3.2.Market Assessment and Forecast, By Livestock, 2017-2027 ($Million)
6.4.Europe
6.4.1. Market Assessment and Forecast, By Country, 2017-2027 ($Million)
6.4.2. Market Assessment and Forecast, By Product, 2017-2027 ($Million)
6.4.3. Market Assessment and Forecast, By Livestock, 2017-2027 ($Million)
6.4.3.1.Germany
6.4.3.1.1.Market Assessment and Forecast, By Product, 2017-2027 ($Million)
6.4.3.1.2.Market Assessment and Forecast, By Livestock, 2017-2027 ($Million)
6.4.3.2.France
6.4.3.2.1.Market Assessment and Forecast, By Product, 2017-2027 ($Million)
6.4.3.2.2.Market Assessment and Forecast, By Product, 2017-2027 ($Million)
6.4.3.3.UK
6.4.3.3.1.Market Assessment and Forecast, By Product, 2017-2027 ($Million)
6.4.3.3.2.Market Assessment and Forecast, By Livestock, 2017-2027 ($Million)
6.4.3.4.Italy
6.4.3.4.1.Market Assessment and Forecast, By Product, 2017-2027 ($Million)
6.4.3.4.2.Market Assessment and Forecast, By Livestock, 2017-2027 ($Million)
6.4.3.5.Spain
6.4.3.5.1.Market Assessment and Forecast, By Product, 2017-2027 ($Million)
6.4.3.5.2.Market Assessment and Forecast, By Livestock, 2017-2027 ($Million)
6.4.3.6.Russia
6.4.3.6.1.Market Assessment and Forecast, By Product, 2017-2027 ($Million)
6.4.3.6.2.Market Assessment and Forecast, By Livestock, 2017-2027 ($Million)
6.4.3.7.Rest of Europe
6.4.3.7.1.Market Assessment and Forecast, By Product, 2017-2027 ($Million)
6.4.3.7.2.Market Assessment and Forecast, By Livestock, 2017-2027 ($Million)
6.5.Asia-Pacific
6.5.1. Market Assessment and Forecast, By Country, 2017-2027 ($Million)
6.5.2. Market Assessment and Forecast, By Product, 2017-2027 ($Million)
6.5.3. Market Assessment and Forecast, By Livestock, 2017-2027 ($Million)
6.5.3.1.Japan
6.5.3.1.1.Market Assessment and Forecast, By Product, 2017-2027 ($Million)
6.5.3.1.2.Market Assessment and Forecast, By Livestock, 2017-2027 ($Million)
6.5.3.2.China
6.5.3.2.1.Market Assessment and Forecast, By Product, 2017-2027 ($Million)
6.5.3.2.2.Market Assessment and Forecast, By Livestock, 2017-2027 ($Million)
6.5.3.3.Australia
6.5.3.3.1.Market Assessment and Forecast, By Product, 2017-2027 ($Million)
6.5.3.3.2.Market Assessment and Forecast, By Livestock, 2017-2027 ($Million)
6.5.3.4.India
6.5.3.4.1.Market Assessment and Forecast, By Product, 2017-2027 ($Million)
6.5.3.4.2.Market Assessment and Forecast, By Livestock, 2017-2027 ($Million)
6.5.3.5.South Korea
6.5.3.5.1.Market Assessment and Forecast, By Product, 2017-2027 ($Million)
6.5.3.5.2.Market Assessment and Forecast, By Livestock, 2017-2027 ($Million)
6.5.3.6.Taiwan
6.5.3.6.1.Market Assessment and Forecast, By Product, 2017-2027 ($Million)
6.5.3.6.2.Market Assessment and Forecast, By Livestock, 2017-2027 ($Million)
6.5.3.7.Rest of Asia-Pacific
6.5.3.7.1.Market Assessment and Forecast, By Product, 2017-2027 ($Million)
6.5.3.7.2.Market Assessment and Forecast, By Livestock, 2017-2027 ($Million)
6.6.Rest of the World
6.6.1. Market Assessment and Forecast, By Country, 2017-2027 ($Million)
6.6.2. Market Assessment and Forecast, By Product, 2017-2027 ($Million)
6.6.3. Market Assessment and Forecast, By Livestock, 2017-2027 ($Million)
6.6.3.1.Brazil
6.6.3.1.1.Market Assessment and Forecast, By Product, 2017-2027 ($Million)
6.6.3.1.2.Market Assessment and Forecast, By Livestock, 2017-2027 ($Million)
6.6.3.2.Turkey
6.6.3.2.1.Market Assessment and Forecast, By Product, 2017-2027 ($Million)
6.6.3.2.2.Market Assessment and Forecast, By Livestock, 2017-2027 ($Million)
6.6.3.3.Saudi Arabia
6.6.3.3.1.Market Assessment and Forecast, By Product, 2017-2027 ($Million)
6.6.3.3.2.Market Assessment and Forecast, By Livestock, 2017-2027 ($Million)
6.6.3.4.South Africa
6.6.3.4.1.Market Assessment and Forecast, By Product, 2017-2027 ($Million)
6.6.3.4.2.Market Assessment and Forecast, By Livestock, 2017-2027 ($Million)
6.6.3.5.United Arab Emirates
6.6.3.5.1.Market Assessment and Forecast, By Product, 2017-2027 ($Million)
6.6.3.5.2.Market Assessment and Forecast, By Livestock, 2017-2027 ($Million)
6.6.3.6.Others
6.6.3.6.1.Market Assessment and Forecast, By Product, 2017-2027 ($Million)
6.6.3.6.2.Market Assessment and Forecast, By Livestock, 2017-2027 ($Million)
7.Company Profiles
7.1.Bluestar Adisseo Co., Ltd.
7.1.1. Business Overview
7.1.2. Product Portfolio
7.1.3. Key Financials
7.1.4. Strategic Developments
7.2.Ajinomoto Co., Inc.
7.2.1. Business Overview
7.2.2. Product Portfolio
7.2.3. Key Financials
7.2.4. Strategic Developments
7.3.Archer Daniels Midland Company
7.3.1. Business Overview
7.3.2. Product Portfolio
7.3.3. Key Financials
7.3.4. Strategic Developments
7.4.BASF SE
7.4.1. Business Overview
7.4.2. Product Portfolio
7.4.3. Key Financials
7.4.4. Strategic Developments
7.5.Cargill, Inc.
7.5.1. Business Overview
7.5.2. Product Portfolio
7.5.3. Key Financials
7.5.4. Strategic Developments
7.6.Chr. Hansen Holding A/S
7.6.1. Business Overview
7.6.2. Product Portfolio
7.6.3. Strategic Developments
7.7.Danisco (DuPont Danisco Animal Nutrition)
7.7.1. Business Overview
7.7.2. Product Portfolio
7.7.3. Strategic Developments
7.8.Elanco Animal Health - Eli lilly and company
7.8.1. Business Overview
7.8.2. Product Portfolio
7.8.3. Key Financials
7.8.4. Strategic Developments
7.9.DSM
7.9.1. Business Overview
7.9.2. Product Portfolio
7.9.3. Key Financials
7.9.4. Strategic Developments
7.10.Evonik Industries
7.10.1.Business Overview
7.10.2.Product Portfolio
7.10.3.Key Financials
7.10.4.Strategic Developments
7.11.Kemin Industries
7.11.1.Business Overview
7.11.2.Product Portfolio
7.11.3.Strategic Developments
7.12.Novozymes
7.12.1.Business Overview
7.12.2.Product Portfolio
7.12.3.Strategic Developments
7.13.Novus International Inc.
7.13.1.Business Overview
7.13.2.Product Portfolio
7.13.3.Key Financials
7.13.4.Strategic Developments
7.14.Nutreco (wholly owned subsidiary of SHV Holdings N.V.)
7.14.1.Business Overview
7.14.2.Product Portfolio
7.14.3.Key Financials
7.14.4.Strategic Developments
7.15.ALLTECH, INC.
7.15.1.Business Overview
7.15.2.Product Portfolio
7.15.3.Strategic Developments
List of Tables
Table 1.Animal Feed Additives Market, By Product ($Million), 2017-2025
Table 2.Antioxidants Market, By Region ($Million), 2017-2025
Table 3.Antibiotic Market, By Region ($Million), 2017-2025
Table 4.Feed Acidifiers Market, By Region ($Million), 2017-2025
Table 5.Feed Enzymes Market, By Region ($Million), 2017-2025
Table 6.Motion Sensors Market, By Region ($Million), 2017-2025
Table 7.Pressure and Force Sensors Market, By Region ($Million), 2017-2025
Table 8.Amino Acids Market, By Region ($Million), 2017-2025
Table 9.Tryptophan Market, By Region ($Million), 2017-2025
Table 10.Threonine Market, By Region ($Million), 2017-2025
Table 11.Methionine Market, By Region ($Million), 2017-2025
Table 12.Lysine Market, By Region ($Million), 2017-2025
Table 13.Others Market, By Region ($Million), 2017-2025
Table 14.Vitamin A,B,C,E, Market By Region ($Million), 2017-2025
Table 15.Others Market, By Region ($Million), 2017-2025
Table 20.Animal Feed Additives Market, By Livestock ($Million), 2017-2025
Table 21.Aquaculture Market, By Region ($Million), 2017-2025
Table 24.Pork/Swine Market, By Region ($Million), 2017-2025
Table 25.Cattle Market, By Region ($Million), 2017-2025
Table 26.Poultry Market, By Region ($Million), 2017-2025
Table 37.Other Livestocks Market, By Region ($Million), 2017-2025
Table 38.Animal Feed Additives Market, By Region ($Million), 2017-2025
Table 39.North America Animal Feed Additives Market, By Country, 2017-2025 ($Million)
Table 40.North America Animal Feed Additives Market, By Product, 2017-2025 ($Million)
Table 41.North America Animal Feed Additives Market, By Livestock, 2017-2025 ($Million)
Table 43.U.S. Animal Feed Additives Market, By Product, 2017-2025 ($Million)
Table 44.U.S. Animal Feed Additives Market, By Livestock, 2017-2025 ($Million)
Table 46.Canada Animal Feed Additives Market, By Product, 2017-2025 ($Million)
Table 47.Canada Animal Feed Additives Market, By Livestock, 2017-2025 ($Million)
Table 49.Mexico Animal Feed Additives Market, By Product, 2017-2025 ($Million)
Table 50.Mexico Animal Feed Additives Market, By Livestock, 2017-2025 ($Million)
Table 52.Europe Animal Feed Additives Market, By Country, 2017-2025 ($Million)
Table 53.Europe Animal Feed Additives Market, By Product, 2017-2025 ($Million)
Table 54.Europe Animal Feed Additives Market, By Livestock, 2017-2025 ($Million)
Table 56.Germany Animal Feed Additives Market, By Product, 2017-2025 ($Million)
Table 57.Germany Animal Feed Additives Market, By Livestock, 2017-2025 ($Million)
Table 59.France Animal Feed Additives Market, By Product, 2017-2025 ($Million)
Table 60.France Animal Feed Additives Market, By Livestock, 2017-2025 ($Million)
Table 62.UK Animal Feed Additives Market, By Product, 2017-2025 ($Million)
Table 63.UK Animal Feed Additives Market, By Livestock, 2017-2025 ($Million)
Table 65.Italy Animal Feed Additives Market, By Product, 2017-2025 ($Million)
Table 66.Italy Animal Feed Additives Market, By Livestock, 2017-2025 ($Million)
Table 68.Spain Animal Feed Additives Market, By Product, 2017-2025 ($Million)
Table 69.Spain Animal Feed Additives Market, By Livestock, 2017-2025 ($Million)
Table 71.Russia Animal Feed Additives Market, By Product, 2017-2025 ($Million)
Table 72.Russia Animal Feed Additives Market, By Livestock, 2017-2025 ($Million)
Table 74.Rest of Europe Animal Feed Additives Market, By Product, 2017-2025 ($Million)
Table 75.Rest of Europe Animal Feed Additives Market, By Livestock, 2017-2025 ($Million)
Table 77.Asia-Pacific Animal Feed Additives Market, By Country, 2017-2025 ($Million)
Table 78.Asia-Pacific Animal Feed Additives Market, By Product, 2017-2025 ($Million)
Table 79.Asia-Pacific Animal Feed Additives Market, By Livestock, 2017-2025 ($Million)
Table 81.Japan Animal Feed Additives Market, By Product, 2017-2025 ($Million)
Table 82.Japan Animal Feed Additives Market, By Livestock, 2017-2025 ($Million)
Table 84.China Animal Feed Additives Market, By Product, 2017-2025 ($Million)
Table 85.China Animal Feed Additives Market, By Livestock, 2017-2025 ($Million)
Table 87.Australia Animal Feed Additives Market, By Product, 2017-2025 ($Million)
Table 88.Australia Animal Feed Additives Market, By Livestock, 2017-2025 ($Million)
Table 90.India Animal Feed Additives Market, By Product, 2017-2025 ($Million)
Table 91.India Animal Feed Additives Market, By Livestock, 2017-2025 ($Million)
Table 93.South Korea Animal Feed Additives Market, By Product, 2017-2025 ($Million)
Table 94.South Korea Animal Feed Additives Market, By Livestock, 2017-2025 ($Million)
Table 96.Taiwan Animal Feed Additives Market, By Product, 2017-2025 ($Million)
Table 97.Taiwan Animal Feed Additives Market, By Livestock, 2017-2025 ($Million)
Table 99.Rest of Asia-Pacific Animal Feed Additives Market, By Product, 2017-2025 ($Million)
Table 100.Rest of Asia-Pacific Animal Feed Additives Market, By Livestock, 2017-2025 ($Million)
Table 102.Rest of the World Animal Feed Additives Market, By Country, 2017-2025 ($Million)
Table 103.Rest of the World Animal Feed Additives Market, By Product, 2017-2025 ($Million)
Table 104.Rest of the World Animal Feed Additives Market, By Livestock, 2017-2025 ($Million)
Table 107.Brazil Animal Feed Additives Market, By Livestock, 2017-2025 ($Million)
Table 109.Turkey Animal Feed Additives Market, By Product, 2017-2025 ($Million)
Table 110.Turkey Animal Feed Additives Market, By Livestock, 2017-2025 ($Million)
Table 112.Saudi Arabia Animal Feed Additives Market, By Product, 2017-2025 ($Million)
Table 113.Saudi Arabia Animal Feed Additives Market, By Livestock, 2017-2025 ($Million)
Table 115.South Africa Animal Feed Additives Market, By Product, 2017-2025 ($Million)
Table 116.South Africa Animal Feed Additives Market, By Livestock, 2017-2025 ($Million)
Table 118.United Arab Emirates Animal Feed Additives Market, By Product, 2017-2025 ($Million)
Table 119.United Arab Emirates Animal Feed Additives Market, By Livestock, 2017-2025 ($Million)
Table 121.Others Animal Feed Additives Market, By Product, 2017-2025 ($Million)
Table 122.Others Animal Feed Additives Market, By Livestock, 2017-2025 ($Million)
Table 124.Bluestar Adisseo Co., Ltd.: Key Strategic Developments, 2017-2017
Table 125.Ajinomoto Co., Inc.: Key Strategic Developments, 2017-2017
Table 126.Archer Daniels Midland Company: Key Strategic Developments, 2017-2017
Table 127.BASF SE: Key Strategic Developments, 2017-2017
Table 128.Cargill, Inc.: Key Strategic Developments, 2017-2017
Table 129.Chr. Hansen Holding A/S: Key Strategic Developments, 2017-2017
Table 130.Danisco (DuPont Danisco Animal Nutrition): Key Strategic Developments, 2017-2017
Table 131.Elanco Animal Health - Eli lilly and company: Key Strategic Developments, 2017-2017
Table 132.DSM: Key Strategic Developments, 2017-2017
Table 133.Evonik Industries: Key Strategic Developments, 2017-2017
Table 134.Kemin Industries: Key Strategic Developments, 2017-2017
Table 135.Novozymes: Key Strategic Developments, 2017-2017
Table 136.Novus International Inc.: Key Strategic Developments, 2017-2017
Table 137.Nutreco (wholly owned subsidiary of SHV Holdings N.V.): Key Strategic Developments, 2017-2017
Table 138.ALLTECH, INC.: Key Strategic Developments, 2017-2017
List of Figures
Figure 1.Animal Feed Additives Market Share, By Product, 2017 & 2025 ($Million)
Figure 2.Animal Feed Additives Market, By Livestock, 2017 & 2025 ($Million)
Figure 4.Animal Feed Additives Market, By Region, 2017, ($Million)
Figure 5.Bluestar Adisseo Co., Ltd.: Net Revenues, 2017-2017 ($Million)
Figure 6.Bluestar Adisseo Co., Ltd.: Net Revenue Share, By Segment, 2017
Figure 7.Bluestar Adisseo Co., Ltd.: Net Revenue Share, By Geography, 2017
Figure 8.Ajinomoto Co., Inc.: Net Revenues, 2017-2017 ($Million)
Figure 9.Ajinomoto Co., Inc.: Net Revenue Share, By Segment, 2017
Figure 10.Ajinomoto Co., Inc.: Net Revenue Share, By Geography, 2017
Figure 11.Archer Daniels Midland Company: Net Revenues, 2017-2017 ($Million)
Figure 12.Archer Daniels Midland Company: Net Revenue Share, By Segment, 2017
Figure 13.Archer Daniels Midland Company: Net Revenue Share, By Geography, 2017
Figure 14.BASF SE: Net Revenues, 2017-2017 ($Million)
Figure 15.BASF SE: Net Revenue Share, By Segment, 2017
Figure 16.BASF SE: Net Revenue Share, By Geography, 2017
Figure 17.Cargill, Inc.: Net Revenues, 2017-2017 ($Million)
Figure 18.Cargill, Inc.: Net Revenue Share, By Segment, 2017
Figure 19.Cargill, Inc.: Net Revenue Share, By Geography, 2017
Figure 20.Elanco Animal Health - Eli lilly and company: Net Revenues, 2017-2017 ($Million)
Figure 21.Elanco Animal Health - Eli lilly and company: Net Revenue Share, By Segment, 2017
Figure 22.Elanco Animal Health - Eli lilly and company: Net Revenue Share, By Geography, 2017
Figure 23.DSM: Net Revenues, 2017-2017 ($Million)
Figure 24.DSM: Net Revenue Share, By Segment, 2017
Figure 25.DSM: Net Revenue Share, By Geography, 2017
Figure 26.Evonik Industries: Net Revenues, 2017-2017 ($Million)
Figure 27.Evonik Industries: Net Revenue Share, By Segment, 2017
Figure 28.Evonik Industries: Net Revenue Share, By Geography, 2017
Figure 29.Kemin Industries: Net Revenues, 2017-2017 ($Million)
Figure 30.Kemin Industries: Net Revenue Share, By Segment, 2017
Figure 31.Kemin Industries: Net Revenue Share, By Geography, 2017
Figure 32.Novozymes: Net Revenues, 2017-2017 ($Million)
Figure 33.Novozymes: Net Revenue Share, By Segment, 2017
Figure 34.Novozymes: Net Revenue Share, By Geography, 2017
Figure 35.Novus International Inc.: Net Revenues, 2017-2017 ($Million)
Figure 36.Novus International Inc.: Net Revenue Share, By Segment, 2017
Figure 37.Novus International Inc.: Net Revenue Share, By Geography, 2017
Figure 38.Nutreco (wholly owned subsidiary of SHV Holdings N.V.): Net Revenues, 2017-2017 ($Million)
Figure 39.Nutreco (wholly owned subsidiary of SHV Holdings N.V.): Net Revenue Share, By Segment, 2017
Figure 40.Nutreco (wholly owned subsidiary of SHV Holdings N.V.): Net Revenue Share, By Geography, 2017
Figure 38.ALLTECH, INC.: Net Revenues, 2017-2017 ($Million)
Figure 39.ALLTECH, INC.: Net Revenue Share, By Segment, 2017
Figure 40.ALLTECH, INC.: Net Revenue Share, By Geography, 2017
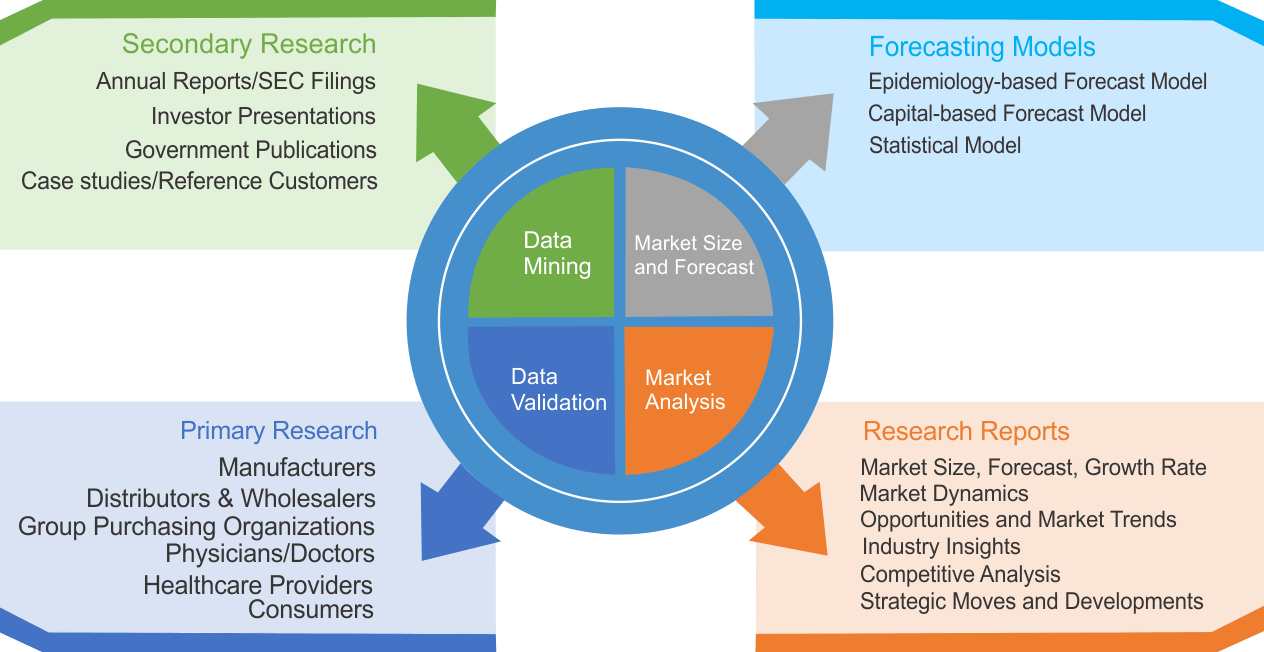
Research Methodology
We use both primary as well as secondary research for our market surveys, estimates and for developing forecast. Our research process commence by analyzing the problem which enable us to design the scope for our research study. Our research process is uniquely designed with enough flexibility to adjust according to changing nature of products and markets, while retaining core element to ensure reliability and accuracy in research findings. We understand both macro and micro-economic factors to evaluate and forecast different market segments.
Data Mining
Data is extensively collected through various secondary sources such as annual reports, investor presentations, SEC filings, and other corporate publications. We also refer trade magazines, technical journals, paid databases such as Factiva and Bloomberg, industry trade journals, scientific journals, and social media data to understand market dynamics and industry trends. Further, we also conduct primary research to understand market drivers, restraints, opportunities, challenges, and competitive scenario to build our analysis.
Data Collection Matrix
|
Data Collection Matrix |
Supply Side |
Demand Side |
|
Primary Data Sources |
|
|
|
Secondary Data Sources |
|
|
Market Modeling and Forecasting
We use epidemiology and capital equipment-based models to forecast market size of different segments at country and regional level.
- Epidemiology-based Forecasting Model: This method uses epidemiology data gathered through various publications and from physicians to estimate population of patients, flow of treatment of individual disease and therapies. The data collected through this method includes statics on incidence of disease, population suffering from disease, and treatment population. This method is used to understand:
- Number of patients for particular device or medical procedure and
- Repeated use of particular device depending on health and condition of patient
- Capital-based Forecasting Model: This method of forecasting is based on number of replacements, installed-based and new sales of capital equipment used in various healthcare and diagnostic centers. These three parameters are calculated and forecast is developed. Installation base is calculated as average number of units per facility; while sales for particular year is calculated from number of new and replace units. Secondary data is collected through various supply chain intermediaries and opinion leaders to arrive at installation and sales rate. These techniques help our analysts in validating market and developed market estimates and forecast.
We do forecast on basis of several parameters such as market drivers, market opportunities, industry trends government regulations, raw materials supply and trade dynamics to ensure relevance of forecast with market scenario. With increasing need to granulized information, we used bottom-up methodology for forecasting where we evaluate each regional segment differently and combined all forecast to develop final market forecast.
Data Validation
We believe primary research is a very important tool in analyzing and forecasting different markets. In order to make sure accuracy of our findings, our team conducts primary interviews at every stage of research to gain deep insights into current business environment and future trends and key developments in market. This includes use of various methods such as telephonic interviews, focus groups, face to face interviews and questionnaires to validate our research from all aspects. We validate our data through primary research from key industry leaders such as CEO, product managers, marketing managers, suppliers, distributors, and consumers are frequently interviewed. These interviews provide valuable insights which help us to have better market understanding besides validating our estimates and forecast.
Data Triangulation
Industry Analysis
|
Qualitative Data |
Quantitative Data (2017-2025) |
|
|