PP Nonwoven Fabric Market by Product and Application - Global Industry Analysis and Forecast to 2022
Published On : September 2017 Pages : 127 Category: Plastics, Polymers & Resins Report Code : CM09227
Industry Outlook and Trend analysis
The global PP Nonwoven Fabric Market was worth USD 17.03 Billion in the year 2017 and is foreseen to garner roughly USD 31.26 Million by 2022, while registering itself at a compound annual growth rate (CAGR) of 6.87% during the forecast period. Due to its excellent quality in comparison with other non-knitted fabrics nonwoven polypropylene fabric has gained prominence in the recent years.
Polypropylene polymers along with other fiber are prime raw materials that are utilized for the production of textile. Rising birth rates, specifically in the Asia Pacific region has accelerated to requirement for disposable products like baby diapers. The extensive requirement for disposable products is anticipated to be the major factor for driving the growth of the market. Nonwoven PP fabrics have encountered growth in requirement long-lasting applications in automotive, geotextile and construction mostly in countries like India and China. Additionally, growing geriatric population specifically in United States, Japan and Europe is said to boost the demand of adult incontinence products thereby triggering the growth of the nonwoven PP fabrics market.
However, unstable prices of raw materials coupled with strict rules imposed on the processing of petrochemicals is said to be a challenge for the nonwoven textile industry. A number of regulations have been imposed due to rising environmental issues associated with the utilization of polypropylene. Polypropylene is a major derivative of petrochemical that is utilized in a variety of applications in various end-use sectors and is retrieved from crude oil. Manufacturers are focusing on utilizing bio-based polypropylene which is anticipated to open various avenues for the growth of this market.
Product Outlook and Trend Analysis
In 2017 the dominating product segment was the spunbonded PP fabric and is anticipated to witness significant growth in the following years. They are extensively utilized in the production of feminine care, baby and adult diapers, protective apparel and other medical products. Durable applications such as battery separators, construction, agriculture and coating substrates can be produced by making the use of these materials.
Application Outlook and Trend Analysis
The major application of PP nonwoven fabric can be widely categorized as durables and disposables. The dominating application was hygiene accounting for more than 45 percent of the total demand in 2017. Hygiene applications majorly consist of wipes, adult diapers, baby diapers and feminine disposable products. The application segment of furnishings is anticipated to encounter swift growth in the upcoming years owing to rising demand of high-quality cushions due to increased disposable income in developing countries of Latin America and Asia Pacific.
Regional Outlook and Trend Analysis
The Market of PP non-knitted fabric was dominated by Asia Pacific that registered for more than 40 percent of the total revenue in 2017. There has been extensive demand in the Asia Pacific region owing to increased disposable income specifically in India and China which has increased the requirement of a variety of hygiene products like baby and adult diapers and sanitary wipes. On the other hand, the Middle East is said to have the most appealing market of PP non-knitted fabric. Increasing availability of propylene in that region is anticipated to render feed-stock advantage to the manufacturers.
Competitive Insights
The global PP nonwoven fabric market is segmented with top player that registered for almost 60 percent of the total revenue in 2017. Smaller companies are acquired by the major ones in order to increase their market share and curtail competition. The major companies in this market are Mitsui & Co, Fibertex Nonwovens SA, Fiberweb India, Avgol Industries, Toray Industries and Kimberly Clark Hygiene Products Pvt. Ltd.
The global PP nonwoven fabric market is segmented as follows-
By Product
- Meltblown
- Spunbonded
- Composite
- Staples
By Application
- Furnishings
- Industrial
- Agriculture
- Geotextiles
- Carpet
- Hygiene
- Medical
- Others
By Region
- North America
- U.S
- Canada
- Mexico
- Europe
- Germany
- France
- UK
- Italy
- Spain
- Rest of Europe
- Asia-Pacific
- Japan
- China
- Australia
- India
- South Korea
- Rest of Asia Pacific
- Rest of the World
- Brazil
- South Africa
- Saudi Arabia
- United Arab Emirates
- Others
Some of the key questions answered by the report are:
- What was the market size in 2017 and forecast from 2017 to 2022?
- What will be the industry market growth from 2017 to 2022?
- What are the major drivers, restraints, opportunities, challenges, and industry trends and their impact on the market forecast?
- What are the major segments leading the market growth and why?
- Which are the leading players in the market and what are the major strategies adopted by them to sustain the market competition?
Market Classification
- PP Nonwoven Fabric Market, By Product, Estimates and Forecast, 2014-2022 ($Million)
- Meltblown
- Spunbonded
- Composite
- Staples
- PP Nonwoven Fabric Market, By Application, Estimates and Forecast, 2014-2022 ($Million)
- Furnishings
- Industrial
- Agriculture
- Geotextiles
- Carpet
- Hygiene
- Medical
- Others
- PP Nonwoven Fabric Market, By Region, Estimates and Forecast, 2014-2022 ($Million)
- North America
- North America PP Nonwoven Fabric Market, By Country
- North America PP Nonwoven Fabric Market, By Product
- North America PP Nonwoven Fabric Market, By Application
- U.S. PP Nonwoven Fabric Market, By Product
- U.S. PP Nonwoven Fabric Market, By Application
- Canada PP Nonwoven Fabric Market, By Product
- Canada PP Nonwoven Fabric Market, By Application
- Mexico PP Nonwoven Fabric Market, By Product
- Mexico PP Nonwoven Fabric Market, By Application
-
- Europe
- Europe PP Nonwoven Fabric Market, By Country
- Europe PP Nonwoven Fabric Market, By Product
- Europe PP Nonwoven Fabric Market, By Application
- Germany PP Nonwoven Fabric Market, By Product
- Germany PP Nonwoven Fabric Market, By Application
- France PP Nonwoven Fabric Market, By Product
- France PP Nonwoven Fabric Market, By Application
- UK PP Nonwoven Fabric Market, By Product
- UK PP Nonwoven Fabric Market, By Application
- Italy PP Nonwoven Fabric Market, By Product
- Italy PP Nonwoven Fabric Market, By Application
- Spain PP Nonwoven Fabric Market, By Product
- Spain PP Nonwoven Fabric Market, By Application
- Rest of Europe PP Nonwoven Fabric Market, By Product
- Rest of Europe PP Nonwoven Fabric Market, By Application
-
- Asia-Pacific
- Asia-Pacific PP Nonwoven Fabric Market, By Country
- Asia-Pacific PP Nonwoven Fabric Market, By Product
- Asia-Pacific PP Nonwoven Fabric Market, By Application
- Japan PP Nonwoven Fabric Market, By Product
- Japan PP Nonwoven Fabric Market, By Application
- Australia PP Nonwoven Fabric Market, By Product
- Australia PP Nonwoven Fabric Market, By Application
- India PP Nonwoven Fabric Market, By Product
- India PP Nonwoven Fabric Market, By Application
- South Korea PP Nonwoven Fabric Market, By Product
- South Korea PP Nonwoven Fabric Market, By Application
- Rest of Asia-Pacific PP Nonwoven Fabric Market, By Product
- Rest of Asia-Pacific PP Nonwoven Fabric Market, By Application
- Asia-Pacific
-
- Rest of the World
- Rest of the World PP Nonwoven Fabric Market, By Country
- Rest of the World PP Nonwoven Fabric Market, By Product
- Rest of the World PP Nonwoven Fabric Market, By Application
- Brazil PP Nonwoven Fabric Market, By Product
- Brazil PP Nonwoven Fabric Market, By Application
- South Africa PP Nonwoven Fabric Market, By Product
- South Africa PP Nonwoven Fabric Market, By Application
- Saudi Arabia PP Nonwoven Fabric Market, By Product
- Saudi Arabia PP Nonwoven Fabric Market, By Application
- Turkey PP Nonwoven Fabric Market, By Product
- Turkey PP Nonwoven Fabric Market, By Application
- United Arab Emirates PP Nonwoven Fabric Market, By Product
- United Arab Emirates PP Nonwoven Fabric Market, By Application
- Others PP Nonwoven Fabric Market, By Product
- Others PP Nonwoven Fabric Market, By Application
- Rest of the World
Table of Contents
1.Introduction
1.1.Report Description
1.2.Research Methodology
1.2.1. Secondary Research
1.2.2. Primary Research
2.Executive Summary
2.1.Key Highlights
3.Market Overview
3.1.Introduction
3.1.1. Market Definition
3.1.2. Market Segmentation
3.2.Market Share Analysis
3.3.Market Dynamics
3.3.1. Drivers
3.3.1.1.Growing Demand for such hygiene products
3.3.1.2.Increasing consumption of disposable diapers and feminine care products in developing countries
3.3.2. Restraints
3.3.2.1.Increasing stringent regulations
3.3.2.2.High cost of raw materials
3.3.3. Opportunities
3.3.3.1.Technological advancement in fuel-efficient and lightweight transportation automobiles
3.4.Industry Trends
4.PP Nonwoven Fabric Market, By Product
4.1.Introduction
4.2.PP Nonwoven Fabric Market Assessment and Forecast, By Product, 2017-2022
4.3.Meltblown
4.3.1. Market Assessment and Forecast, By Region, 2017-2022 ($Million)
4.4.Spunbonded
4.4.1. Market Assessment and Forecast, By Region, 2017-2022 ($Million)
4.5.Composite
4.5.1. Market Assessment and Forecast, By Region, 2017-2022 ($Million)
4.6.Staples
4.6.1. Market Assessment and Forecast, By Region, 2017-2022 ($Million)
5.PP Nonwoven Fabric Market, By Application
5.1.Introduction
5.2.PP Nonwoven Fabric Market Assessment and Forecast, By Application, 2017-2022
5.3.Furnishings
5.3.1.1.Market Assessment and Forecast, By Region, 2017-2022 ($Million)
5.4.Industrial
5.4.1.1.Market Assessment and Forecast, By Region, 2017-2022 ($Million)
5.5.Agriculture
5.5.1.1.Market Assessment and Forecast, By Region, 2017-2022 ($Million)
5.6.Geotextiles
5.6.1.1.Market Assessment and Forecast, By Region, 2017-2022 ($Million)
5.7.Carpet
5.7.1.1.Market Assessment and Forecast, By Region, 2017-2022 ($Million)
5.8.Hygiene
5.8.1.1.Market Assessment and Forecast, By Region, 2017-2022 ($Million)
5.9.Medical
5.9.1.1.Market Assessment and Forecast, By Region, 2017-2022 ($Million)
5.10.Other Applications
5.10.1.1.Market Assessment and Forecast, By Region, 2017-2022 ($Million)
6.PP Nonwoven Fabric Market, By Region
6.1.Introduction
6.2.PP Nonwoven Fabric Market Assessment and Forecast, By Region, 2017-2022 ($Million)
6.3.North America
6.3.1. Market Assessment and Forecast, By Country, 2017-2022 ($Million)
6.3.2. Market Assessment and Forecast, By Product, 2017-2022 ($Million)
6.3.3. Market Assessment and Forecast, By Application, 2017-2022 ($Million)
6.3.3.1.U.S.
6.3.3.1.1.Market Assessment and Forecast, By Product, 2017-2022 ($Million)
6.3.3.1.2.Market Assessment and Forecast, By Application, 2017-2022 ($Million)
6.3.3.2.Canada
6.3.3.2.1.Market Assessment and Forecast, By Product, 2017-2022 ($Million)
6.3.3.2.2.Market Assessment and Forecast, By Application, 2017-2022 ($Million)
6.3.3.3.Mexico
6.3.3.3.1.Market Assessment and Forecast, By Product, 2017-2022 ($Million)
6.3.3.3.2.Market Assessment and Forecast, By Application, 2017-2022 ($Million)
6.4.Europe
6.4.1. Market Assessment and Forecast, By Country, 2017-2022 ($Million)
6.4.2. Market Assessment and Forecast, By Product, 2017-2022 ($Million)
6.4.3. Market Assessment and Forecast, By Application, 2017-2022 ($Million)
6.4.3.1.Germany
6.4.3.1.1.Market Assessment and Forecast, By Product, 2017-2022 ($Million)
6.4.3.1.2.Market Assessment and Forecast, By Application, 2017-2022 ($Million)
6.4.3.2.France
6.4.3.2.1.Market Assessment and Forecast, By Product, 2017-2022 ($Million)
6.4.3.2.2.Market Assessment and Forecast, By Product, 2017-2022 ($Million)
6.4.3.3.UK
6.4.3.3.1.Market Assessment and Forecast, By Product, 2017-2022 ($Million)
6.4.3.3.2.Market Assessment and Forecast, By Application, 2017-2022 ($Million)
6.4.3.4.Italy
6.4.3.4.1.Market Assessment and Forecast, By Product, 2017-2022 ($Million)
6.4.3.4.2.Market Assessment and Forecast, By Application, 2017-2022 ($Million)
6.4.3.5.Spain
6.4.3.5.1.Market Assessment and Forecast, By Product, 2017-2022 ($Million)
6.4.3.5.2.Market Assessment and Forecast, By Application, 2017-2022 ($Million)
6.4.3.6.Russia
6.4.3.6.1.Market Assessment and Forecast, By Product, 2017-2022 ($Million)
6.4.3.6.2.Market Assessment and Forecast, By Application, 2017-2022 ($Million)
6.4.3.7.Rest of Europe
6.4.3.7.1.Market Assessment and Forecast, By Product, 2017-2022 ($Million)
6.4.3.7.2.Market Assessment and Forecast, By Application, 2017-2022 ($Million)
6.5.Asia-Pacific
6.5.1. Market Assessment and Forecast, By Country, 2017-2022 ($Million)
6.5.2. Market Assessment and Forecast, By Product, 2017-2022 ($Million)
6.5.3. Market Assessment and Forecast, By Application, 2017-2022 ($Million)
6.5.3.1.Japan
6.5.3.1.1.Market Assessment and Forecast, By Product, 2017-2022 ($Million)
6.5.3.1.2.Market Assessment and Forecast, By Application, 2017-2022 ($Million)
6.5.3.2.China
6.5.3.2.1.Market Assessment and Forecast, By Product, 2017-2022 ($Million)
6.5.3.2.2.Market Assessment and Forecast, By Application, 2017-2022 ($Million)
6.5.3.3.Australia
6.5.3.3.1.Market Assessment and Forecast, By Product, 2017-2022 ($Million)
6.5.3.3.2.Market Assessment and Forecast, By Application, 2017-2022 ($Million)
6.5.3.4.India
6.5.3.4.1.Market Assessment and Forecast, By Product, 2017-2022 ($Million)
6.5.3.4.2.Market Assessment and Forecast, By Application, 2017-2022 ($Million)
6.5.3.5.South Korea
6.5.3.5.1.Market Assessment and Forecast, By Product, 2017-2022 ($Million)
6.5.3.5.2.Market Assessment and Forecast, By Application, 2017-2022 ($Million)
6.5.3.6.Taiwan
6.5.3.6.1.Market Assessment and Forecast, By Product, 2017-2022 ($Million)
6.5.3.6.2.Market Assessment and Forecast, By Application, 2017-2022 ($Million)
6.5.3.7.Rest of Asia-Pacific
6.5.3.7.1.Market Assessment and Forecast, By Product, 2017-2022 ($Million)
6.5.3.7.2.Market Assessment and Forecast, By Application, 2017-2022 ($Million)
6.6.Rest of the World
6.6.1. Market Assessment and Forecast, By Country, 2017-2022 ($Million)
6.6.2. Market Assessment and Forecast, By Product, 2017-2022 ($Million)
6.6.3. Market Assessment and Forecast, By Application, 2017-2022 ($Million)
6.6.3.1.Brazil
6.6.3.1.1.Market Assessment and Forecast, By Product, 2017-2022 ($Million)
6.6.3.1.2.Market Assessment and Forecast, By Application, 2017-2022 ($Million)
6.6.3.2.Turkey
6.6.3.2.1.Market Assessment and Forecast, By Product, 2017-2022 ($Million)
6.6.3.2.2.Market Assessment and Forecast, By Application, 2017-2022 ($Million)
6.6.3.3.Saudi Arabia
6.6.3.3.1.Market Assessment and Forecast, By Product, 2017-2022 ($Million)
6.6.3.3.2.Market Assessment and Forecast, By Application, 2017-2022 ($Million)
6.6.3.4.South Africa
6.6.3.4.1.Market Assessment and Forecast, By Product, 2017-2022 ($Million)
6.6.3.4.2.Market Assessment and Forecast, By Application, 2017-2022 ($Million)
6.6.3.5.United Arab Emirates
6.6.3.5.1.Market Assessment and Forecast, By Product, 2017-2022 ($Million)
6.6.3.5.2.Market Assessment and Forecast, By Application, 2017-2022 ($Million)
6.6.3.6.Others
6.6.3.6.1.Market Assessment and Forecast, By Product, 2017-2022 ($Million)
6.6.3.6.2.Market Assessment and Forecast, By Application, 2017-2022 ($Million)
7.Company Profiles
7.1.Kimberly-Clark Corporation
7.1.1. Business Overview
7.1.2. Product Portfolio
7.1.3. Key Financials
7.1.4. Strategic Developments
7.2.Polymer Group Inc.
7.2.1. Business Overview
7.2.2. Product Portfolio
7.2.3. Key Financials
7.2.4. Strategic Developments
7.3.GAF Materials Corporation
7.3.1. Business Overview
7.3.2. Product Portfolio
7.3.3. Strategic Developments
7.4.Avgol Nonwoven Industries
7.4.1. Business Overview
7.4.2. Product Portfolio
7.4.3. Strategic Developments
7.5.First Quality Nonwovens Inc.
7.5.1. Business Overview
7.5.2. Product Portfolio
7.5.3. Strategic Developments
7.6.Companhia Providência
7.6.1. Business Overview
7.6.2. Product Portfolio
7.6.3. Key Financials
7.6.4. Strategic Developments
7.7.PEGAS NONWOVENS s.r.o.
7.7.1. Business Overview
7.7.2. Product Portfolio
7.7.3. Key Financials
7.7.4. Strategic Developments
7.8.Fibertex Nonwovens S/A
7.8.1. Business Overview
7.8.2. Product Portfolio
7.8.3. Strategic Developments
7.9.Mitsui Chemicals Inc.
7.9.1. Business Overview
7.9.2. Product Portfolio
7.9.3. Key Financials
7.9.4. Strategic Developments
7.10.Fitesa
7.10.1.Business Overview
7.10.2.Product Portfolio
7.10.3.Strategic Developments
7.11.Fiberwebindia Ltd.
7.11.1.Business Overview
7.11.2.Product Portfolio
7.11.3.Strategic Developments
7.12.Toray Industries Inc.
7.12.1.Business Overview
7.12.2.Product Portfolio
7.12.3.Key Financials
7.12.4.Strategic Developments
7.13.SABIC
7.13.1.Business Overview
7.13.2.Product Portfolio
7.13.3.Key Financials
7.13.4.Strategic Developments
7.14.ExxonMobil Corporation
7.14.1.Business Overview
7.14.2.Product Portfolio
7.14.3.Key Financials
7.14.4.Strategic Developments
List of Tables
Table 1.PP Nonwoven Fabric Market, By Product ($Million), 2017-2022
Table 2.Meltblown Market, By Region ($Million), 2017-2022
Table 3.Spunbonded Market, By Region ($Million), 2017-2022
Table 4.Composite Market, By Region ($Million), 2017-2022
Table 5.Staples Market, By Region ($Million), 2017-2022
Table 6.PP Nonwoven Fabric Market, By Application ($Million), 2017-2022
Table 7.Furnishings Market, By Region ($Million), 2017-2022
Table 8.Industrial Market, By Region ($Million), 2017-2022
Table 9.Agriculture Market, By Region ($Million), 2017-2022
Table 10.Geotextiles Market, By Region ($Million), 2017-2022
Table 11.Carpet Market, By Region ($Million), 2017-2022
Table 12.Hygiene Market, By Region ($Million), 2017-2022
Table 13.Medical Market, By Region ($Million), 2017-2022
Table 14.Other Applications Market, By Region ($Million), 2017-2022
Table 15.PP Nonwoven Fabric Market, By Region ($Million), 2017-2022
Table 16.North America PP Nonwoven Fabric Market, By Country, 2017-2022 ($Million)
Table 17.North America PP Nonwoven Fabric Market, By Product, 2017-2022 ($Million)
Table 18.North America PP Nonwoven Fabric Market, By Application, 2017-2022 ($Million)
Table 19.U.S. PP Nonwoven Fabric Market, By Product, 2017-2022 ($Million)
Table 20.U.S. PP Nonwoven Fabric Market, By Application, 2017-2022 ($Million)
Table 21.Canada PP Nonwoven Fabric Market, By Product, 2017-2022 ($Million)
Table 22.Canada PP Nonwoven Fabric Market, By Application, 2017-2022 ($Million)
Table 23.Mexico PP Nonwoven Fabric Market, By Product, 2017-2022 ($Million)
Table 24.Mexico PP Nonwoven Fabric Market, By Application, 2017-2022 ($Million)
Table 25.Europe PP Nonwoven Fabric Market, By Country, 2017-2022 ($Million)
Table 26.Europe PP Nonwoven Fabric Market, By Product, 2017-2022 ($Million)
Table 27.Europe PP Nonwoven Fabric Market, By Application, 2017-2022 ($Million)
Table 28.Germany PP Nonwoven Fabric Market, By Product, 2017-2022 ($Million)
Table 29.Germany PP Nonwoven Fabric Market, By Application, 2017-2022 ($Million)
Table 30.France PP Nonwoven Fabric Market, By Product, 2017-2022 ($Million)
Table 31.France PP Nonwoven Fabric Market, By Application, 2017-2022 ($Million)
Table 32.UK PP Nonwoven Fabric Market, By Product, 2017-2022 ($Million)
Table 33.UK PP Nonwoven Fabric Market, By Application, 2017-2022 ($Million)
Table 34.Italy PP Nonwoven Fabric Market, By Product, 2017-2022 ($Million)
Table 35.Italy PP Nonwoven Fabric Market, By Application, 2017-2022 ($Million)
Table 36.Spain PP Nonwoven Fabric Market, By Product, 2017-2022 ($Million)
Table 37.Spain PP Nonwoven Fabric Market, By Application, 2017-2022 ($Million)
Table 38.Russia PP Nonwoven Fabric Market, By Product, 2017-2022 ($Million)
Table 39.Russia PP Nonwoven Fabric Market, By Application, 2017-2022 ($Million)
Table 40.Rest of Europe PP Nonwoven Fabric Market, By Product, 2017-2022 ($Million)
Table 41.Rest of Europe PP Nonwoven Fabric Market, By Application, 2017-2022 ($Million)
Table 42.Asia-Pacific PP Nonwoven Fabric Market, By Country, 2017-2022 ($Million)
Table 43.Asia-Pacific PP Nonwoven Fabric Market, By Product, 2017-2022 ($Million)
Table 45.Asia-Pacific PP Nonwoven Fabric Market, By Application, 2017-2022 ($Million)
Table 46.Japan PP Nonwoven Fabric Market, By Product, 2017-2022 ($Million)
Table 47.Japan PP Nonwoven Fabric Market, By Application, 2017-2022 ($Million)
Table 48.China PP Nonwoven Fabric Market, By Product, 2017-2022 ($Million)
Table 49.China PP Nonwoven Fabric Market, By Application, 2017-2022 ($Million)
Table 50.Australia PP Nonwoven Fabric Market, By Product, 2017-2022 ($Million)
Table 51.Australia PP Nonwoven Fabric Market, By Application, 2017-2022 ($Million)
Table 52.India PP Nonwoven Fabric Market, By Product, 2017-2022 ($Million)
Table 53.India PP Nonwoven Fabric Market, By Application, 2017-2022 ($Million)
Table 54.South Korea PP Nonwoven Fabric Market, By Product, 2017-2022 ($Million)
Table 55.South Korea PP Nonwoven Fabric Market, By Application, 2017-2022 ($Million)
Table 56.Taiwan PP Nonwoven Fabric Market, By Product, 2017-2022 ($Million)
Table 57.Taiwan PP Nonwoven Fabric Market, By Application, 2017-2022 ($Million)
Table 58.Rest of Asia-Pacific PP Nonwoven Fabric Market, By Product, 2017-2022 ($Million)
Table 59.Rest of Asia-Pacific PP Nonwoven Fabric Market, By Application, 2017-2022 ($Million)
Table 60.Rest of the World PP Nonwoven Fabric Market, By Country, 2017-2022 ($Million)
Table 61.Rest of the World PP Nonwoven Fabric Market, By Product, 2017-2022 ($Million)
Table 62.Rest of the World PP Nonwoven Fabric Market, By Application, 2017-2022 ($Million)
Table 63.Brazil PP Nonwoven Fabric Market, By Product, 2017-2022 ($Million)
Table 64.Brazil PP Nonwoven Fabric Market, By Application, 2017-2022 ($Million)
Table 65.Turkey PP Nonwoven Fabric Market, By Product, 2017-2022 ($Million)
Table 67.Turkey PP Nonwoven Fabric Market, By Application, 2017-2022 ($Million)
Table 68.Saudi Arabia PP Nonwoven Fabric Market, By Product, 2017-2022 ($Million)
Table 69.Saudi Arabia PP Nonwoven Fabric Market, By Application, 2017-2022 ($Million)
Table 70.South Africa PP Nonwoven Fabric Market, By Product, 2017-2022 ($Million)
Table 71.South Africa PP Nonwoven Fabric Market, By Application, 2017-2022 ($Million)
Table 72.United Arab Emirates PP Nonwoven Fabric Market, By Product, 2017-2022 ($Million)
Table 73.United Arab Emirates PP Nonwoven Fabric Market, By Application, 2017-2022 ($Million)
Table 74.Others PP Nonwoven Fabric Market, By Product, 2017-2022 ($Million)
Table 75.Others PP Nonwoven Fabric Market, By Application, 2017-2022 ($Million)
Table 76.Kimberly-Clark Corporation: Key Strategic Developments, 2017-2017
Table 77.Polymer Group Inc.: Key Strategic Developments, 2017-2017
Table 78.GAF Materials Corporation: Key Strategic Developments, 2017-2017
Table 79.Avgol Nonwoven Industries: Key Strategic Developments, 2017-2017
Table 80.First Quality Nonwovens Inc.: Key Strategic Developments, 2017-2017
Table 81.Companhia Providência: Key Strategic Developments, 2017-2017
Table 82.PEGAS NONWOVENS s.r.o.: Key Strategic Developments, 2017-2017
Table 83.Mitsui Chemicals Inc.: Key Strategic Developments, 2017-2017
Table 84.Mitsui Chemicals Inc.: Key Strategic Developments, 2017-2017
Table 85.Fitesa: Key Strategic Developments, 2017-2017
Table 86.Fiberwebindia Ltd.: Key Strategic Developments, 2017-2017
Table 87.Toray Industries Inc.: Key Strategic Developments, 2017-2017
Table 88.SABIC: Key Strategic Developments, 2017-2017
Table 89.ExxonMobil Corporation: Key Strategic Developments, 2017-2017
List of Figures
Figure 1.PP Nonwoven Fabric Market Share, By Product, 2017 & 2022 ($Million)
Figure 2.PP Nonwoven Fabric Market, By Application, 2017 & 2022 ($Million)
Figure 3.PP Nonwoven Fabric Market, By Region, 2017, ($Million)
Figure 4.Kimberly-Clark Corporation: Net Revenues, 2017-2017 ($Million)
Figure 5.Kimberly-Clark Corporation: Net Revenue Share, By Segment, 2017
Figure 6.Kimberly-Clark Corporation: Net Revenue Share, By Geography, 2017
Figure 7.Polymer Group Inc.: Net Revenues, 2017-2017 ($Million)
Figure 8.Polymer Group Inc.: Net Revenue Share, By Segment, 2017
Figure 9.Polymer Group Inc.: Net Revenue Share, By Geography, 2017
Figure 10.Companhia Providência: Net Revenues, 2017-2017 ($Million)
Figure 11.Companhia Providência: Net Revenue Share, By Segment, 2017
Figure 12.Companhia Providência: Net Revenue Share, By Geography, 2017
Figure 13.PEGAS NONWOVENS s.r.o.: Net Revenues, 2017-2017 ($Million)
Figure 14.PEGAS NONWOVENS s.r.o.: Net Revenue Share, By Segment, 2017
Figure 15.PEGAS NONWOVENS s.r.o.: Net Revenue Share, By Geography, 2017
Figure 16.Mitsui Chemicals Inc.: Net Revenues, 2017-2017 ($Million)
Figure 17.Mitsui Chemicals Inc.: Net Revenue Share, By Segment, 2017
Figure 18.Mitsui Chemicals Inc.: Net Revenue Share, By Geography, 2017
Figure 19.Toray Industries Inc.: Net Revenues, 2017-2017 ($Million)
Figure 20.Toray Industries Inc.: Net Revenue Share, By Segment, 2017
Figure 21.Toray Industries Inc.: Net Revenue Share, By Geography, 2017
Figure 22.SABIC: Net Revenues, 2017-2017 ($Million)
Figure 23.SABIC: Net Revenue Share, By Segment, 2017
Figure 24.SABIC: Net Revenue Share, By Geography, 2017
Figure 25.ExxonMobil Corporation: Net Revenues, 2017-2017 ($Million)
Figure 26.ExxonMobil Corporation: Net Revenue Share, By Segment, 2017
Figure 27.ExxonMobil Corporation: Net Revenue Share, By Geography, 2017
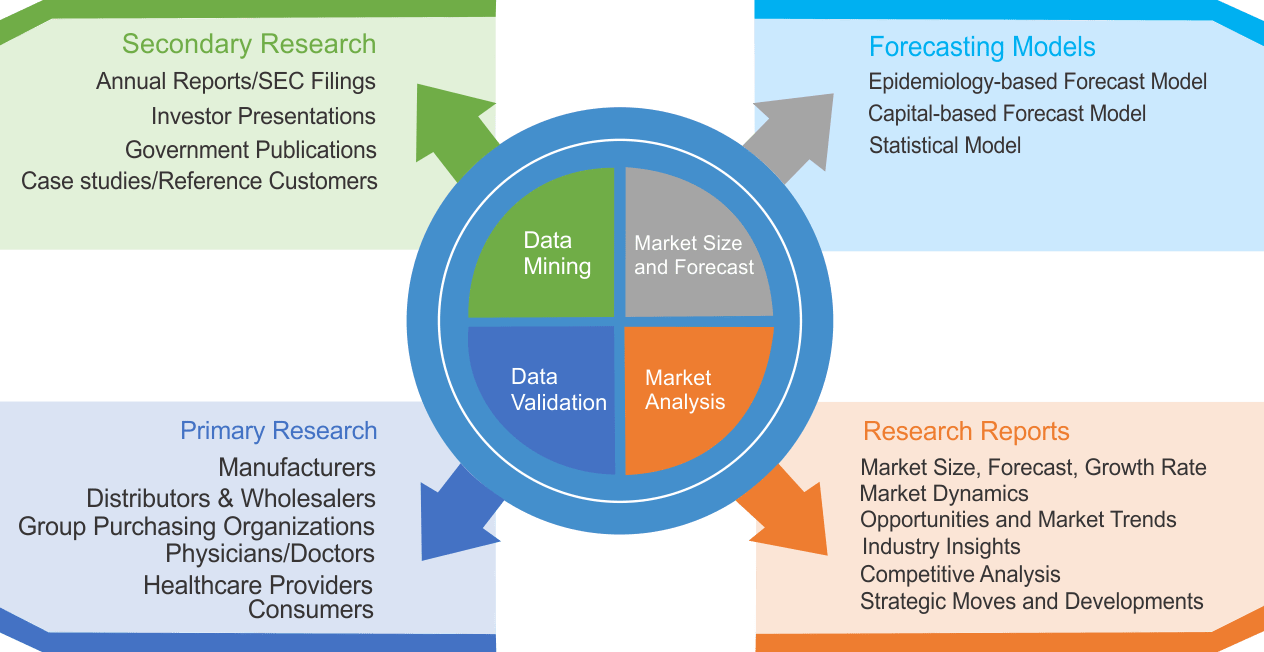
Research Methodology
We use both primary as well as secondary research for our market surveys, estimates and for developing forecast. Our research process commence by analyzing the problem which enable us to design the scope for our research study. Our research process is uniquely designed with enough flexibility to adjust according to changing nature of products and markets, while retaining core element to ensure reliability and accuracy in research findings. We understand both macro and micro-economic factors to evaluate and forecast different market segments.
Data Mining
Data is extensively collected through various secondary sources such as annual reports, investor presentations, SEC filings, and other corporate publications. We also refer trade magazines, technical journals, paid databases such as Factiva and Bloomberg, industry trade journals, scientific journals, and social media data to understand market dynamics and industry trends. Further, we also conduct primary research to understand market drivers, restraints, opportunities, challenges, and competitive scenario to build our analysis.
Data Collection Matrix
|
Data Collection Matrix |
Supply Side |
Demand Side |
|
Primary Data Sources |
|
|
|
Secondary Data Sources |
|
|
Market Modeling and Forecasting
We use epidemiology and capital equipment-based models to forecast market size of different segments at country and regional level.
- Epidemiology-based Forecasting Model: This method uses epidemiology data gathered through various publications and from physicians to estimate population of patients, flow of treatment of individual disease and therapies. The data collected through this method includes statics on incidence of disease, population suffering from disease, and treatment population. This method is used to understand:
- Number of patients for particular device or medical procedure and
- Repeated use of particular device depending on health and condition of patient
- Capital-based Forecasting Model: This method of forecasting is based on number of replacements, installed-based and new sales of capital equipment used in various healthcare and diagnostic centers. These three parameters are calculated and forecast is developed. Installation base is calculated as average number of units per facility; while sales for particular year is calculated from number of new and replace units. Secondary data is collected through various supply chain intermediaries and opinion leaders to arrive at installation and sales rate. These techniques help our analysts in validating market and developed market estimates and forecast.
We do forecast on basis of several parameters such as market drivers, market opportunities, industry trends government regulations, raw materials supply and trade dynamics to ensure relevance of forecast with market scenario. With increasing need to granulized information, we used bottom-up methodology for forecasting where we evaluate each regional segment differently and combined all forecast to develop final market forecast.
Data Validation
We believe primary research is a very important tool in analyzing and forecasting different markets. In order to make sure accuracy of our findings, our team conducts primary interviews at every stage of research to gain deep insights into current business environment and future trends and key developments in market. This includes use of various methods such as telephonic interviews, focus groups, face to face interviews and questionnaires to validate our research from all aspects. We validate our data through primary research from key industry leaders such as CEO, product managers, marketing managers, suppliers, distributors, and consumers are frequently interviewed. These interviews provide valuable insights which help us to have better market understanding besides validating our estimates and forecast.
Data Triangulation
Industry Analysis
|
Qualitative Data |
Quantitative Data (2017-2025) |
|
|