Nitrile Butadiene Rubber (NBR) Market by Application and End User - Global Industry Analysis and Forecast To 2022
Published On : November 2017 Pages : 122 Category: Plastics, Polymers & Resins Report Code : CM11354
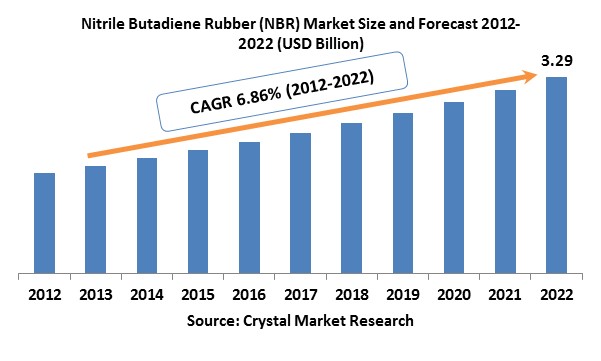
Industry Trend Analysis
In 2017, the global nitrile butadiene rubber (NBR)market was evaluated around USD 1.69 billion and is expected to reach approximately USD 3.29 billion by 2022 while registering itself at a compound annual growth rate (CAGR) of 6.86% over the forecast period on account of growing requirement for high-quality plasticizers due to their brilliant mechanical characteristics. Additionally, rising NBR demand in the production of several automobile components involving dash boards, kick panels, brake pads, and brake lining is projected to drive the growth of the global market. NBRs capability to uphold an extensive temperatures range makes it the best material for the applications in aerospace industry. Expansion in the aerospace industry, particularly in emerging regions is expected to fuel the global NBR market during the forecast period. Also, stiffness and hardness of NBR make it a perfect material for nuclear industry applications. NBR is chemical resistant as well as heat resistant and hence it is used over an extensive range of industrial and automotive applications. NBR is used as a substitute to latex materials owing to its high strength, puncture resistant and excellent flexibility properties. Major applications of NBR are; the manufacturing of medical & industrial gloves, adhesives, hose, sealants, cables, and belting. Moreover, speedy industrialization along with infrastructure expansion in several regions is expected to fuel the growth of NBR market in emerging countries during next few years. The rising utilization of NBR gloves in industrial & medical applications for protection purposes is projected to drive its market during the forecast period. Though, fluctuating costs of raw material along with ecological concerns are expected to hamper the growth of global NBR market.
Application Outlook and Trend Analysis
Major applications of NBR observed in this report involve molded & extruded products, belting & cable, hose, adhesive & sealants, seals & O-rings, industrial & medical gloves, and others involving oil field products, cement, weather stripping cables and gaskets. Medical & Industrial gloves are expected to be the top growing application section while, belting, cable & hose has been the leading application section of the global NBR industry. NBR is widely utilized in oilfields for various applications such as, blow out preventers, seals, and Packers. Also, NBR is widely used in the automobile sector for the production of underhood components where temperatures constantly vary owing to compress airflow inside small engine compartments.
End User Outlook and Trend Analysis
In 2017, automotive was the leading end-user section of the NBR market worldwide, and the drift is expected to persist during the forecast years. Resistance to alkalis, minerals, acids, and oils along with tolerance to excessive temperatures has contributed to the wide application of NBR in an automobile over the last few years. Though, construction is expected to observe the top growth in NBR market during the next few years owing to the elevated rubber resistance to acids and friction, making it perfect for utilization in the production of several products involving seals. Furthermore, growing government expenditure on infrastructure is anticipated to fuel the growth of the NBR market during the forecast years.
Regional Outlook and Trend Analysis
Asia Pacific regional market ruled the global market concerning revenue as well as volume. Asia Pacific region was the leading consumer and is prone to be the top growing NBR market during the forecast years. Speedy industrialization, along with expansion in the automotive section is expected to fuel NBR market in emerging countries like China and India during the next few years. The North American market was the second major market due to elevated NBR demand from the healthcare industry. Though, fiscal recession in Europe and North America has affected the growth of NBR market during the last few years. European regional NBR market is projected to expand at a reasonable rate during the next few years since it is still getting better from the economic recession.
Competitive Outlook and Trend Analysis
The major market players for nitrile butadiene rubber (NBR) market are Zeon Chemicals, Lanxess AG, Synthos S.A., Omnova Solutions, Kumho Petrochemical Co., Versalis, Sibur Holding, and JSR Corporation. Lanxess supplies an extensive series of NBR products involving BAYMOD, PERBUNAN, and KRYNAC with high oil resistance, easy processing, high viscosity, high density, high abrasion resistance, and low-temperature flexibility for several end-user industries involving machine construction, automotive, plastic modification, gas/oil exploration, footwear, and electronics.
The global nitrile butadiene rubber (NBR) market is segmented as follows –
By Product
- Hose, belting and cable
- Adhesives and sealants
- Industrial and medical gloves
- Seals and O-rings
- Molded and extruded products
- Others
By End User
- Automotive
- Machinery
- Cots & aprons
- Construction
- Plastic modification
- Wires & cables
- Others
By Region
- North America
- U.S
- Canada
- Mexico
- Europe
- Germany
- France
- UK
- Italy
- Spain
- Rest of Europe
- Asia-Pacific
- Japan
- China
- Australia
- India
- South Korea
- Rest of Asia Pacific
- Rest of the World
- Brazil
- South Africa
- Saudi Arabia
- United Arab Emirates
- Others
Some of the key questions answered by the report are:
· What was the market size in 2017 and forecast from 2017 to 2022?
· What will be the industry market growth from 2017 to 2022?
· What are the major drivers, restraints, opportunities, challenges, and industry trends and their impact on the market forecast?
· What are the major segments leading the market growth and why?
· Which are the leading players in the market and what are the major strategies adopted by them to sustain the market competition?
Market Classification
- Nitrile Butadiene Rubber (NBR) Market, By Application, Estimates and Forecast, 2012-2022 ($Million)
- Hose, belting and cable
- Adhesives and sealants
- Industrial and medical gloves
- Seals and O-rings
- Molded and extruded products
- Other Applications
- Nitrile Butadiene Rubber (NBR) Market, By End User, Estimates and Forecast, 2012-2022 ($Million)
- Automotive
- Machinery
- Cots & aprons
- Construction
- Plastic modification
- Wires & cables
- Other End Users
- Nitrile Butadiene Rubber (NBR) Market, By Region, Estimates and Forecast, 2012-2022 ($Million)
- North America
- North America Nitrile Butadiene Rubber (NBR) Market, By Country
- North America Nitrile Butadiene Rubber (NBR) Market, By Application
- North America Nitrile Butadiene Rubber (NBR) Market, By End User
- U.S. Nitrile Butadiene Rubber (NBR) Market, By Application
- U.S. Nitrile Butadiene Rubber (NBR) Market, By End User
- Canada Nitrile Butadiene Rubber (NBR) Market, By Application
- Canada Nitrile Butadiene Rubber (NBR) Market, By End User
- Mexico Nitrile Butadiene Rubber (NBR) Market, By Application
- Mexico Nitrile Butadiene Rubber (NBR) Market, By End User
-
- Europe
- Europe Nitrile Butadiene Rubber (NBR) Market, By Country
- Europe Nitrile Butadiene Rubber (NBR) Market, By Application
- Europe Nitrile Butadiene Rubber (NBR) Market, By End User
- Germany Nitrile Butadiene Rubber (NBR) Market, By Application
- Germany Nitrile Butadiene Rubber (NBR) Market, By End User
- France Nitrile Butadiene Rubber (NBR) Market, By Application
- France Nitrile Butadiene Rubber (NBR) Market, By End User
- UK Nitrile Butadiene Rubber (NBR) Market, By Application
- UK Nitrile Butadiene Rubber (NBR) Market, By End User
- Italy Nitrile Butadiene Rubber (NBR) Market, By Application
- Italy Nitrile Butadiene Rubber (NBR) Market, By End User
- Spain Nitrile Butadiene Rubber (NBR) Market, By Application
- Spain Nitrile Butadiene Rubber (NBR) Market, By End User
- Rest of Europe Nitrile Butadiene Rubber (NBR) Market, By Application
- Rest of Europe Nitrile Butadiene Rubber (NBR) Market, By End User
-
- Asia-Pacific
- Asia-Pacific Nitrile Butadiene Rubber (NBR) Market, By Country
- Asia-Pacific Nitrile Butadiene Rubber (NBR) Market, By Application
- Asia-Pacific Nitrile Butadiene Rubber (NBR) Market, By End User
- Japan Nitrile Butadiene Rubber (NBR) Market, By Application
- Japan Nitrile Butadiene Rubber (NBR) Market, By End User
- Australia Nitrile Butadiene Rubber (NBR) Market, By Application
- Australia Nitrile Butadiene Rubber (NBR) Market, By End User
- India Nitrile Butadiene Rubber (NBR) Market, By Application
- India Nitrile Butadiene Rubber (NBR) Market, By End User
- South Korea Nitrile Butadiene Rubber (NBR) Market, By Application
- South Korea Nitrile Butadiene Rubber (NBR) Market, By End User
- Rest of Asia-Pacific Nitrile Butadiene Rubber (NBR) Market, By Application
- Rest of Asia-Pacific Nitrile Butadiene Rubber (NBR) Market, By End User
- Asia-Pacific
-
- Rest of the World
- Rest of the World Nitrile Butadiene Rubber (NBR) Market, By Country
- Rest of the World Nitrile Butadiene Rubber (NBR) Market, By Application
- Rest of the World Nitrile Butadiene Rubber (NBR) Market, By End User
- Brazil Nitrile Butadiene Rubber (NBR) Market, By Application
- Brazil Nitrile Butadiene Rubber (NBR) Market, By End User
- South Africa Nitrile Butadiene Rubber (NBR) Market, By Application
- South Africa Nitrile Butadiene Rubber (NBR) Market, By End User
- Saudi Arabia Nitrile Butadiene Rubber (NBR) Market, By Application
- Saudi Arabia Nitrile Butadiene Rubber (NBR) Market, By End User
- Turkey Nitrile Butadiene Rubber (NBR) Market, By Application
- Turkey Nitrile Butadiene Rubber (NBR) Market, By End User
- United Arab Emirates Nitrile Butadiene Rubber (NBR) Market, By Application
- United Arab Emirates Nitrile Butadiene Rubber (NBR) Market, By End User
- Others Nitrile Butadiene Rubber (NBR) Market, By Application
- Others Nitrile Butadiene Rubber (NBR) Market, By End User
- Rest of the World
Table of Contents
1. Introduction
1.1. Report Description
1.2. Research Methodology
1.2.1. Secondary Research
1.2.2. Primary Research
2. Executive Summary
2.1. Key Highlights
3. Market Overview
3.1. Introduction
3.1.1. Market Definition
3.1.2. Market Segmentation
3.2. Market Share Analysis
3.3. Market Dynamics
3.3.1. Drivers
3.3.1.1. Increasing Incidence of Cardiovascular Diseases Globally
3.3.1.2. Rising Geriatric Population Globally
3.3.1.3. Technological Advancements in Defibrillation Devices
3.3.2. Restraints
3.3.2.1. Lack of Awareness about Sudden Cardiac Arrest (SAC)
3.3.2.2. Increasing Price Competition in the Industry
3.3.3. Opportunities
3.3.3.1. Emerging Markets to Offer Lucrative Growth Opportunities
3.4. Industry Trends
4. Nitrile Butadiene Rubber (NBR) Market, By Application
4.1. Introduction
4.2. Nitrile Butadiene Rubber (NBR) Market Assessment and Forecast, By Application, 2012-2022
4.3. Hose, belting and cable
4.3.1. Market Assessment and Forecast, By Region, 2012-2022 ($Million)
4.4. Adhesives and sealants
4.4.1. Market Assessment and Forecast, By Region, 2012-2022 ($Million)
4.5. Industrial and medical gloves
4.5.1. Market Assessment and Forecast, By Region, 2012-2022 ($Million)
4.6. Seals and O-rings
4.6.1. Market Assessment and Forecast, By Region, 2012-2022 ($Million)
4.7. Molded and extruded products
4.7.1. Market Assessment and Forecast, By Region, 2012-2022 ($Million)
4.8. Other Applications
4.8.1. Market Assessment and Forecast, By Region, 2012-2022 ($Million)
5. Nitrile Butadiene Rubber (NBR) Market, By End User
5.1. Introduction
5.2. The Nitrile Butadiene Rubber (NBR) MarketAssessment and Forecast, By End User, 2012-2022
5.3. Automotive
5.3.1.1. Market Assessment and Forecast, By Region, 2012-2022 ($Million)
5.4. Machinery
5.4.1.1. Market Assessment and Forecast, By Region, 2012-2022 ($Million)
5.5.1.1. Market Assessment and Forecast, By Region, 2012-2022 ($Million)
5.6. Construction
5.6.1.1. Market Assessment and Forecast, By Region, 2012-2022 ($Million)
5.7. Plastic modification
5.7.1. Market Assessment and Forecast, By Region, 2012-2022 ($Million)
5.8. Wires & cables
5.8.1.1. Market Assessment and Forecast, By Region, 2012-2022 ($Million)
5.9. Other End Users
5.9.1. Market Assessment and Forecast, By Region, 2012-2022 ($Million)
6. Nitrile Butadiene Rubber (NBR) Market, By Region
6.1. Introduction
6.2. Nitrile Butadiene Rubber (NBR) Market Assessment and Forecast, By Region, 2012-2022 ($Million)
6.3. North America
6.3.1. Market Assessment and Forecast, By Country, 2012-2022 ($Million)
6.3.2. Market Assessment and Forecast, By Application, 2012-2022 ($Million)
6.3.3. Market Assessment and Forecast, By End User, 2012-2022 ($Million)
6.3.3.1. U.S.
6.3.3.1.1. Market Assessment and Forecast, By Application, 2012-2022 ($Million)
6.3.3.1.2. Market Assessment and Forecast, By End User, 2012-2022 ($Million)
6.3.3.2. Canada
6.3.3.2.1. Market Assessment and Forecast, By Application, 2012-2022 ($Million)
6.3.3.2.2. Market Assessment and Forecast, By End User, 2012-2022 ($Million)
6.3.3.3. Mexico
6.3.3.3.1. Market Assessment and Forecast, By Application, 2012-2022 ($Million)
6.3.3.3.2. Market Assessment and Forecast, By End User, 2012-2022 ($Million)
6.4. Europe
6.4.1. Market Assessment and Forecast, By Country, 2012-2022 ($Million)
6.4.2. Market Assessment and Forecast, By Application, 2012-2022 ($Million)
6.4.3. Market Assessment and Forecast, By End User, 2012-2022 ($Million)
6.4.3.1. Germany
6.4.3.1.1. Market Assessment and Forecast, By Application, 2012-2022 ($Million)
6.4.3.1.2. Market Assessment and Forecast, By End User, 2012-2022 ($Million)
6.4.3.2. France
6.4.3.2.1. Market Assessment and Forecast, By Application, 2012-2022 ($Million)
6.4.3.2.2. Market Assessment and Forecast, By Application, 2012-2022 ($Million)
6.4.3.3. UK
6.4.3.3.1. Market Assessment and Forecast, By Application, 2012-2022 ($Million)
6.4.3.3.2. Market Assessment and Forecast, By End User, 2012-2022 ($Million)
6.4.3.4. Italy
6.4.3.4.1. Market Assessment and Forecast, By Application, 2012-2022 ($Million)
6.4.3.4.2. Market Assessment and Forecast, By End User, 2012-2022 ($Million)
6.4.3.5. Spain
6.4.3.5.1. Market Assessment and Forecast, By Application, 2012-2022 ($Million)
6.4.3.5.2. Market Assessment and Forecast, By End User, 2012-2022 ($Million)
6.4.3.6. Rest of Europe
6.4.3.6.1. Market Assessment and Forecast, By Application, 2012-2022 ($Million)
6.4.3.6.2. Market Assessment and Forecast, By End User, 2012-2022 ($Million)
6.5. Asia-Pacific
6.5.1. Market Assessment and Forecast, By Country, 2012-2022 ($Million)
6.5.2. Market Assessment and Forecast, By Application, 2012-2022 ($Million)
6.5.3. Market Assessment and Forecast, By End User, 2012-2022 ($Million)
6.5.3.1. Japan
6.5.3.1.1. Market Assessment and Forecast, By Application, 2012-2022 ($Million)
6.5.3.1.2. Market Assessment and Forecast, By End User, 2012-2022 ($Million)
6.5.3.2. China
6.5.3.2.1. Market Assessment and Forecast, By Application, 2012-2022 ($Million)
6.5.3.2.2. Market Assessment and Forecast, By End User, 2012-2022 ($Million)
6.5.3.3. Australia
6.5.3.3.1. Market Assessment and Forecast, By Application, 2012-2022 ($Million)
6.5.3.3.2. Market Assessment and Forecast, By End User, 2012-2022 ($Million)
6.5.3.4. India
6.5.3.4.1. Market Assessment and Forecast, By Application, 2012-2022 ($Million)
6.5.3.4.2. Market Assessment and Forecast, By End User, 2012-2022 ($Million)
6.5.3.5. South Korea
6.5.3.5.1. Market Assessment and Forecast, By Application, 2012-2022 ($Million)
6.5.3.5.2. Market Assessment and Forecast, By End User, 2012-2022 ($Million)
6.5.3.6. Rest of Asia-Pacific
6.5.3.6.1. Market Assessment and Forecast, By Application, 2012-2022 ($Million)
6.5.3.6.2. Market Assessment and Forecast, By End User, 2012-2022 ($Million)
6.6. Rest of the World
6.6.1. Market Assessment and Forecast, By Country, 2012-2022 ($Million)
6.6.2. Market Assessment and Forecast, By Application, 2012-2022 ($Million)
6.6.3. Market Assessment and Forecast, By End User, 2012-2022 ($Million)
6.6.3.1. Brazil
6.6.3.1.1. Market Assessment and Forecast, By Application, 2012-2022 ($Million)
6.6.3.1.2. Market Assessment and Forecast, By End User, 2012-2022 ($Million)
6.6.3.2. Turkey
6.6.3.2.1. Market Assessment and Forecast, By Application, 2012-2022 ($Million)
6.6.3.2.2. Market Assessment and Forecast, By End User, 2012-2022 ($Million)
6.6.3.3. Saudi Arabia
6.6.3.3.1. Market Assessment and Forecast, By Application, 2012-2022 ($Million)
6.6.3.3.2. Market Assessment and Forecast, By End User, 2012-2022 ($Million)
6.6.3.4. South Africa
6.6.3.4.1. Market Assessment and Forecast, By Application, 2012-2022 ($Million)
6.6.3.4.2. Market Assessment and Forecast, By End User, 2012-2022 ($Million)
6.6.3.5. United Arab Emirates
6.6.3.5.1. Market Assessment and Forecast, By Application, 2012-2022 ($Million)
6.6.3.5.2. Market Assessment and Forecast, By End User, 2012-2022 ($Million)
6.6.3.6. Others
6.6.3.6.1. Market Assessment and Forecast, By Application, 2012-2022 ($Million)
6.6.3.6.2. Market Assessment and Forecast, By End User, 2012-2022 ($Million)
7. Company Profiles
7.1. DSM
7.1.1. Business Overview
7.1.2. Product Portfolio
7.1.3. Key Financials
7.1.4. Strategic Developments
7.2. Dow Chemicals
7.2.1. Business Overview
7.2.2. Product Portfolio
7.2.3. Key Financials
7.2.4. Strategic Developments
7.3. OMNOVA Solutions
7.3.1. Business Overview
7.3.2. Product Portfolio
7.3.3. Strategic Developments
7.4. PetroChina Company Ltd
7.4.1. Business Overview
7.4.2. Product Portfolio
7.4.3. Key Financials
7.4.4. Strategic Developments
7.5. Lanxess AG
7.5.1. Business Overview
7.5.2. Product Portfolio
7.5.3. Strategic Developments
7.6. Lubrizol
7.6.1. Business Overview
7.6.2. Product Portfolio
7.6.3. Strategic Developments
List of Tables
Table 1.Global Nitrile Butadiene Rubber (NBR) Market, By Application ($Million), 2012-2022
Table 2.Hose, belting and cable Market, By Region ($Million), 2012-2022
Table 3.Adhesives and sealants, By Region ($Million), 2012-2022
Table 4.Industrial and medical gloves Market, By End User ($Million), 2012-2022
Table 5.Seals and O-rings Market, By Region ($Million), 2012-2022
Table 6.Molded and extruded products Market, By Region ($Million), 2012-2022
Table 7.Other Applications Market, By Region ($Million), 2012-2022
Table 8.Global Nitrile Butadiene Rubber (NBR) Market, By End User ($Million), 2012-2022
Table 9.Automotive Market, By Region ($Million), 2012-2022
Table 10.Machinery Market, By Region ($Million), 2012-2022
Table 11.Cots & aprons Market, By Region ($Million), 2012-2022
Table 12.Construction Market, By Region ($Million), 2012-2022
Table 13.Plastic modification Market, By Region ($Million), 2012-2022
Table 14.Wires & cables Market, By Region ($Million), 2012-2022
Table 15. Other End Users Market, By Region ($Million), 2012-2022
Table 16.Nitrile Butadiene Rubber (NBR) Market, By Region ($Million), 2012-2022
Table17.North America Nitrile Butadiene Rubber (NBR) Market, By Country, 2012-2022 ($Million)
Table18.North America Nitrile Butadiene Rubber (NBR) Market, By Application, 2012-2022 ($Million)
Table 19.North America Nitrile Butadiene Rubber (NBR) Market, By End User, 2012-2022 ($Million)
Table 20.U.S. Nitrile Butadiene Rubber (NBR) Market, By Application, 2012-2022 ($Million)
Table 21.U.S. Nitrile Butadiene Rubber (NBR) Market, by End User, 2012-2022 ($Million)
Table 22.Canada Nitrile Butadiene Rubber (NBR) Market, By Application, 2012-2022 ($Million)
Table 23.Canada Nitrile Butadiene Rubber (NBR) Market, By End User, 2012-2022 ($Million)
Table 24.Mexico Nitrile Butadiene Rubber (NBR) Market, By Application, 2012-2022 ($Million)
Table 25.Mexico Nitrile Butadiene Rubber (NBR) Market, By End User, 2012-2022 ($Million)
Table 26.Europe Nitrile Butadiene Rubber (NBR) Market, By Country, 2012-2022 ($Million)
Table 27.Europe Nitrile Butadiene Rubber (NBR) Market, By Application, 2012-2022 ($Million)
Table 28.Europe Nitrile Butadiene Rubber (NBR) Market, By End User, 2012-2022 ($Million)
Table 29.Germany Nitrile Butadiene Rubber (NBR) Market, By Application, 2012-2022 ($Million)
Table 30.Germany Nitrile Butadiene Rubber (NBR) Market, By End User, 2012-2022 ($Million)
Table 31.France Nitrile Butadiene Rubber (NBR) Market, By Application, 2012-2022 ($Million)
Table 32.France Nitrile Butadiene Rubber (NBR) Market, By End User, 2012-2022 ($Million)
Table 33.UK Nitrile Butadiene Rubber (NBR) Market, By Application, 2012-2022 ($Million)
Table 34.UK Nitrile Butadiene Rubber (NBR) Market, By End User, 2012-2022 ($Million)
Table 35.Italy Nitrile Butadiene Rubber (NBR) Market, By Application, 2012-2022 ($Million)
Table 36.Italy Nitrile Butadiene Rubber (NBR) Market, By End User, 2012-2022 ($Million)
Table 37.Spain Nitrile Butadiene Rubber (NBR) Market, By Application, 2012-2022 ($Million)
Table 38.Spain Nitrile Butadiene Rubber (NBR) Market, By End User, 2012-2022 ($Million)
Table 39.Russia Nitrile Butadiene Rubber (NBR) Market, By Application, 2012-2022 ($Million)
Table 40.Russia Nitrile Butadiene Rubber (NBR) Market, By End User, 2012-2022 ($Million)
Table 41.Rest of Europe Nitrile Butadiene Rubber (NBR) Market, By Application, 2012-2022 ($Million)
Table 42.Rest of Europe Nitrile Butadiene Rubber (NBR) Market, By End User, 2012-2022 ($Million)
Table 43.Asia-Pacific Nitrile Butadiene Rubber (NBR) Market, By Country, 2012-2022 ($Million)
Table 44.Asia-Pacific Nitrile Butadiene Rubber (NBR) Market, By Application, 2012-2022 ($Million)
Table 45.Asia-Pacific Nitrile Butadiene Rubber (NBR) Market, By End User, 2012-2022 ($Million)
Table 46.Japan Nitrile Butadiene Rubber (NBR) Market, By Application, 2012-2022 ($Million)
Table 47.Japan Nitrile Butadiene Rubber (NBR) Market, By End User, 2012-2022 ($Million)
Table 48.China Nitrile Butadiene Rubber (NBR) Market, By Application, 2012-2022 ($Million)
Table 50.China Nitrile Butadiene Rubber (NBR) Market, By End User, 2012-2022 ($Million)
Table 51.Australia Nitrile Butadiene Rubber (NBR) Market, By Application, 2012-2022 ($Million)
Table 52.Australia Nitrile Butadiene Rubber (NBR) Market, By End User, 2012-2022 ($Million)
Table 53.India Nitrile Butadiene Rubber (NBR) Market, By Application, 2012-2022 ($Million)
Table 54.India Nitrile Butadiene Rubber (NBR) Market, By End User, 2012-2022 ($Million)
Table 55.South Korea Nitrile Butadiene Rubber (NBR) Market, By Application, 2012-2022 ($Million)
Table 56.South Korea Nitrile Butadiene Rubber (NBR) Market, By End User, 2012-2022 ($Million)
Table 57.Taiwan Nitrile Butadiene Rubber (NBR) Market, By Application, 2012-2022 ($Million)
Table 58.Taiwan Nitrile Butadiene Rubber (NBR) Market, By End User, 2012-2022 ($Million)
Table 59.Rest of Asia-Pacific Nitrile Butadiene Rubber (NBR) Market, By Application, 2012-2022 ($Million)
Table 60.Rest of Asia-Pacific Nitrile Butadiene Rubber (NBR) Market, By End User, 2012-2022 ($Million)
Table 61.Rest of the World Nitrile Butadiene Rubber (NBR) Market, By Country, 2012-2022 ($Million)
Table 62.Rest of the World Nitrile Butadiene Rubber (NBR) Market, By Application, 2012-2022 ($Million)
Table 63.Rest of the World Nitrile Butadiene Rubber (NBR) Market, By End User, 2012-2022 ($Million)
Table 64.Brazil Nitrile Butadiene Rubber (NBR) Market, By Application, 2012-2022 ($Million)
Table 65.Brazil Nitrile Butadiene Rubber (NBR) Market, By End User, 2012-2022 ($Million)
Table 66.Turkey Nitrile Butadiene Rubber (NBR) Market, By Application, 2012-2022 ($Million)
Table 67.Turkey Nitrile Butadiene Rubber (NBR) Market, By End User, 2012-2022 ($Million)
Table 68.Saudi Arabia Nitrile Butadiene Rubber (NBR) Market, By Application, 2012-2022 ($Million)
Table 69.Saudi Arabia Nitrile Butadiene Rubber (NBR) Market, By End User, 2012-2022 ($Million)
Table 70.South Africa Nitrile Butadiene Rubber (NBR) Market, By Application, 2012-2022 ($Million)
Table 71.South Africa Nitrile Butadiene Rubber (NBR) Market, By End User, 2012-2022 ($Million)
Table 72.United Arab Emirates Nitrile Butadiene Rubber (NBR) Market, By Application, 2012-2022 ($Million)
Table 73.United Arab Emirates Nitrile Butadiene Rubber (NBR) Market, By End User, 2012-2022 ($Million)
Table 74.Others Nitrile Butadiene Rubber (NBR) Market, By Application, 2012-2022 ($Million)
Table 75.Others Nitrile Butadiene Rubber (NBR) Market, By End User, 2012-2022 ($Million)
Table 76.DSM: Key Strategic Developments, 2017-2017
Table 77.Dow Chemicals: Key Strategic Developments, 2017-2017
Table 78.OMNOVA Solutions: Key Strategic Developments, 2017-2017
Table 79.PetroChina Company Ltd: Key Strategic Developments, 2017-2017
Table 80.Lanxess AG.: Key Strategic Developments, 2017-2017
Table 81.Lubrizol: Key Strategic Developments, 2017-2017
List of Figures
Figure 1.Global Nitrile Butadiene Rubber (NBR) Market Share, By Application, 2012 & 2022
Figure 2.Nitrile Butadiene Rubber (NBR) Market, By End User, 2017, ($Million)
Figure 3.Nitrile Butadiene Rubber (NBR) Market, By Region, 2017, ($Million)
Figure 4.DSM: Net Revenues, 2017-2017 ($Million)
Figure 5.DSM: Net Revenue Share, By Segment, 2017
Figure 6.DSM: Net Revenue Share, By Geography, 2017
Figure 7.Dow Chemicals: Net Revenues, 2017-2017 ($Million)
Figure 8.Dow Chemicals: Net Revenue Share, By Segment, 2017
Figure 9.Dow Chemicals: Net Revenue Share, By Geography, 2017
Research Methodology
We use both primary as well as secondary research for our market surveys, estimates and for developing forecast. Our research process commence by analyzing the problem which enable us to design the scope for our research study. Our research process is uniquely designed with enough flexibility to adjust according to changing nature of products and markets, while retaining core element to ensure reliability and accuracy in research findings. We understand both macro and micro-economic factors to evaluate and forecast different market segments.
Data Mining
Data is extensively collected through various secondary sources such as annual reports, investor presentations, SEC filings, and other corporate publications. We also refer trade magazines, technical journals, paid databases such as Factiva and Bloomberg, industry trade journals, scientific journals, and social media data to understand market dynamics and industry trends. Further, we also conduct primary research to understand market drivers, restraints, opportunities, challenges, and competitive scenario to build our analysis.
Data Collection Matrix
|
Data Collection Matrix |
Supply Side |
Demand Side |
|
Primary Data Sources |
|
|
|
Secondary Data Sources |
|
|
Market Modeling and Forecasting
We use epidemiology and capital equipment-based models to forecast market size of different segments at country and regional level.
- Epidemiology-based Forecasting Model: This method uses epidemiology data gathered through various publications and from physicians to estimate population of patients, flow of treatment of individual disease and therapies. The data collected through this method includes statics on incidence of disease, population suffering from disease, and treatment population. This method is used to understand:
- Number of patients for particular device or medical procedure and
- Repeated use of particular device depending on health and condition of patient
- Capital-based Forecasting Model: This method of forecasting is based on number of replacements, installed-based and new sales of capital equipment used in various healthcare and diagnostic centers. These three parameters are calculated and forecast is developed. Installation base is calculated as average number of units per facility; while sales for particular year is calculated from number of new and replace units. Secondary data is collected through various supply chain intermediaries and opinion leaders to arrive at installation and sales rate. These techniques help our analysts in validating market and developed market estimates and forecast.
We do forecast on basis of several parameters such as market drivers, market opportunities, industry trends government regulations, raw materials supply and trade dynamics to ensure relevance of forecast with market scenario. With increasing need to granulized information, we used bottom-up methodology for forecasting where we evaluate each regional segment differently and combined all forecast to develop final market forecast.
Data Validation
We believe primary research is a very important tool in analyzing and forecasting different markets. In order to make sure accuracy of our findings, our team conducts primary interviews at every stage of research to gain deep insights into current business environment and future trends and key developments in market. This includes use of various methods such as telephonic interviews, focus groups, face to face interviews and questionnaires to validate our research from all aspects. We validate our data through primary research from key industry leaders such as CEO, product managers, marketing managers, suppliers, distributors, and consumers are frequently interviewed. These interviews provide valuable insights which help us to have better market understanding besides validating our estimates and forecast.
Data Triangulation

Industry Analysis
|
Qualitative Data |
Quantitative Data (2017-2025) |
|
|