Medical Device Connectivity Market by Component and Technology - Global Industry Analysis and Forecast to 2027
Published On : May 2022 Pages : 95 Category: Medical Devices Report Code : HC0636
Industry Trend Analysis
The global medical device connectivity market is projected to be around $2.1 billion by 2027. This is attributed to factors such as rising need to downsize healthcare cost, growing need to integrate healthcare systems for improving quality of care, and efforts of healthcare providers to maximize their return on investment. In addition, rising demand for home healthcare is further leading to increase adoption of medical device connectivity solutions. However, high cost of installation, resistant from healthcare professionals to adopt highly sophisticated IT solutions, and lack of standard interface are set to hamper uptake of these devices by healthcare professionals globally.
Product Outlook and Trend Analysis
Medical device connectivity services segment dominated the global market in 2017, primarily due to need of effective implementation and demand for maximum utilization of connectivity services. Wired hardware accounted for largest share in 2017 and is predicted to maintain its leading position during forecast period. Wireless hardware is expected to grow at highest rate because of various benefits such as portability and cost effectiveness. However, new versions with minimum cost, low energy consumption, and compact size will drive the demand for wireless technology such as Wi-Fi and Bluetooth.
Regional Outlook and Trend Analysis
North America dominated the global market in 2017 because of better accessibility to advanced technology, high adoption rate of new technologies, increasing need for data mining and analytics, healthcare information systems and need for safety and quality of care for patients. Asia-Pacific is projected to witness high growth because of increasing demand for quality health care and information systems.
Competitive Analysis
Major players operating in this market are Capsule Tech Inc., Cerner Corporation, Philips Healthcare, Digi International Inc., Cisco Systems Inc., Siemens Healthcare, Honeywell HomMed LLC, Dräger Medical GmbH, eDevice Inc., Qualcomm Inc., Lantronix Inc., Bernoulli Enterprise, Inc., and GE Healthcare.
Medical Device Connectivity Market Segmentation :
By Component :
- Medical Device Connectivity Services
- Medical Device Connectivity Solution
By Technology:
- Wired Technologies
- Wireless Technologies
- Hybrid Technologies
By Region:
- North America
- U.S
- Canada
- Mexico
- Europe
- Germany
- France
- UK
- Italy
- Spain
- Rest of Europe
- Asia-Pacific
- Japan
- China
- Australia
- India
- South Korea
- Rest of Asia-Pacific
- Rest of the World
- Brazil
- South Africa
- Saudi Arabia
- Turkey
- United Arab Emirates
- Others
Some of the key questions answered by the report are:
- What was the market size in 2017 and forecast from 2022 to 2027?
- What will be the industry market growth from 2022 to 2027?
- What are the major drivers, restraints, opportunities, challenges, and industry trends and their impact on the market forecast?
- What are the major segments leading the market growth and why?
- Which are the leading players in the market and what are the major strategies adopted by them to sustain the market competition?
Market Classification
- Medical Device Connectivity Market, By Component, Estimates and Forecast, 2017-2027 ($Million)
- Medical Device Connectivity Solution
- Medical Device Connectivity Services
- Medical Device Connectivity Market, By Technology, Estimates and Forecast, 2017-2027 ($Million)
- Wireless Technologies
- Wired Technologies
- Hybrid Technologies
- Medical Device Connectivity Market, By Region, Estimates and Forecast, 2017-2027 ($Million)
- North America
- North America Medical Device Connectivity Market, By Country
- North America Medical Device Connectivity Market, By Component
- North America Medical Device Connectivity Market, By Technology
- U.S. Medical Device Connectivity Market, By Component
- U.S. Medical Device Connectivity Market, By Technology
- Canada Medical Device Connectivity Market, By Component
- Canada Medical Device Connectivity Market, By Technology
- Mexico Medical Device Connectivity Market, By Component
- Mexico Medical Device Connectivity Market, By Technology
-
- Europe
- Europe Medical Device Connectivity Market, By Country
- Europe Medical Device Connectivity Market, By Component
- Europe Medical Device Connectivity Market, By Technology
- Germany Medical Device Connectivity Market, By Component
- Germany Medical Device Connectivity Market, By Technology
- France Medical Device Connectivity Market, By Component
- France Medical Device Connectivity Market, By Technology
- UK Medical Device Connectivity Market, By Component
- UK Medical Device Connectivity Market, By Technology
- Italy Medical Device Connectivity Market, By Component
- Italy Medical Device Connectivity Market, By Technology
- Spain Medical Device Connectivity Market, By Component
- Spain Medical Device Connectivity Market, By Technology
- Rest of Europe Medical Device Connectivity Market, By Component
- Rest of Europe Medical Device Connectivity Market, By Technology
-
- Asia-Pacific
- Asia-Pacific Medical Device Connectivity Market, By Country
- Asia-Pacific Medical Device Connectivity Market, By Component
- Asia-Pacific Medical Device Connectivity Market, By Technology
- Japan Medical Device Connectivity Market, By Component
- Japan Medical Device Connectivity Market, By Technology
- China Medical Device Connectivity Market, By Component
- China Medical Device Connectivity Market, By Technology
- Australia Medical Device Connectivity Market, By Component
- Australia Medical Device Connectivity Market, By Technology
- India Medical Device Connectivity Market, By Component
- India Medical Device Connectivity Market, By Technology
- South Korea Medical Device Connectivity Market, By Component
- South Korea Medical Device Connectivity Market, By Technology
- Rest of Asia-Pacific Medical Device Connectivity Market, By Component
- Rest of Asia-Pacific Medical Device Connectivity Market, By Technology
- Asia-Pacific
-
- Rest of the World
- Rest of the World Medical Device Connectivity Market, By Country
- Rest of the World Medical Device Connectivity Market, By Component
- Rest of the World Medical Device Connectivity Market, By Technology
- Brazil Medical Device Connectivity Market, By Component
- Brazil Medical Device Connectivity Market, By Technology
- South Africa Medical Device Connectivity Market, By Component
- South Africa Medical Device Connectivity Market, By Technology
- Saudi Arabia Medical Device Connectivity Market, By Component
- Saudi Arabia Medical Device Connectivity Market, By Technology
- Turkey Medical Device Connectivity Market, By Component
- Turkey Medical Device Connectivity Market, By Technology
- United Arab Emirates Medical Device Connectivity Market, By Component
- United Arab Emirates Medical Device Connectivity Market, By Technology
- Others Medical Device Connectivity Market, By Component
- Others Medical Device Connectivity Market, By Technology
- Rest of the World
Table of Contents
1. Introduction
1.1. Report Description
1.2. Research Methodology
1.2.1. Secondary Research
1.2.2. Primary Research
2. Executive Summary
2.1. Key Highlights
3. Market Overview
3.1. Introduction
3.1.1. Market Definition
3.1.2. Market Segmentation
3.2. Market Share Analysis
3.3. Market Dynamics
3.3.1. Drivers
3.3.1.1. Rising Need to Downsize Healthcare Cost
3.3.1.2. High Demand for Home Healthcare
3.3.1.3. Growing Need to Integrate Healthcare Systems
3.3.2. Restraints
3.3.2.1. High Cost of Installation
3.3.2.2. Lack of Standard Interface
3.3.2.3. Resistant from Healthcare Professionals
3.3.3. Opportunities
3.3.3.1. Emerging Market to Offer Lucrative Growth Opportunities
3.3.3.2. Steep Decline for Time Taken for Commercialization of Components
3.4. Industry Trends
3.5. Reimbursement Scenario
4. Medical Device Connectivity Market, By Component
4.1. Introduction
4.2. Medical Device Connectivity Market Assessment and Forecast, By Component, 2017-2027
4.2.1. Medical Device Connectivity Solutions
4.2.1.1. Market Assessment and Forecast, By Region, 2017-2027 ($Million)
4.2.2. Medical Devices Connectivity Services
4.2.2.1. Market Assessment and Forecast, By Region, 2017-2027 ($Million)
5. Medical Device Connectivity Market, By Technology
5.1. Introduction
5.2. Medical Device Connectivity Market Assessment and Forecast, By Technology, 2017-2027
5.2.1. Wireless Technology
5.2.1.1. Market Assessment and Forecast, By Region, 2017-2027 ($Million)
5.2.2. Wired Technology
5.2.2.1. Market Assessment and Forecast, By Region, 2017-2027 ($Million)
5.2.3. Hybrid Technology
5.2.3.1. Market Assessment and Forecast, By Region, 2017-2027 ($Million)
6. Medical Device Connectivity Market, By Region
6.1. Introduction
6.2. Medical Device Connectivity Market Assessment and Forecast, By Region, 2017-2027 ($Million)
6.3. North America
6.3.1. Market Assessment and Forecast, By Country, 2017-2027 ($Million)
6.3.2. Market Assessment and Forecast, By Component, 2017-2027 ($Million)
6.3.3. Market Assessment and Forecast, By Technology, 2017-2027 ($Million)
6.3.4. U.S.
6.3.4.1. Market Assessment and Forecast, By Component, 2017-2027 ($Million)
6.3.4.2. Market Assessment and Forecast, By Technology, 2017-2027 ($Million)
6.3.5. Canada
6.3.5.1. Market Assessment and Forecast, By Component, 2017-2027 ($Million)
6.3.5.2. Market Assessment and Forecast, By Technology, 2017-2027 ($Million)
6.3.6. Mexico
6.3.6.1. Market Assessment and Forecast, By Component, 2017-2027 ($Million)
6.3.6.2. Market Assessment and Forecast, By Technology, 2017-2027 ($Million)
6.4. Europe
6.4.1. Market Assessment and Forecast, By Country, 2017-2027 ($Million)
6.4.2. Market Assessment and Forecast, By Component, 2017-2027 ($Million)
6.4.3. Market Assessment and Forecast, By Technology, 2017-2027 ($Million)
6.4.4. Germany
6.4.4.1. Market Assessment and Forecast, By Component, 2017-2027 ($Million)
6.4.4.2. Market Assessment and Forecast, By Technology, 2017-2027 ($Million)
6.4.5. France
6.4.5.1. Market Assessment and Forecast, By Component, 2017-2027 ($Million)
6.4.5.2. Market Assessment and Forecast, By Technology, 2017-2027 ($Million)
6.4.6. UK
6.4.6.1. Market Assessment and Forecast, By Component, 2017-2027 ($Million)
6.4.6.2. Market Assessment and Forecast, By Technology, 2017-2027 ($Million)
6.4.7. Italy
6.4.7.1. Market Assessment and Forecast, By Component, 2017-2027 ($Million)
6.4.7.2. Market Assessment and Forecast, By Technology, 2017-2027 ($Million)
6.4.8. Spain
6.4.8.1. Market Assessment and Forecast, By Component, 2017-2027 ($Million)
6.4.8.2. Market Assessment and Forecast, By Technology, 2017-2027 ($Million)
6.4.9. Russia
6.4.9.1. Market Assessment and Forecast, By Component, 2017-2027 ($Million)
6.4.9.2. Market Assessment and Forecast, By Technology, 2017-2027 ($Million)
6.4.10. Rest of Europe
6.4.10.1. Market Assessment and Forecast, By Component, 2017-2027 ($Million)
6.4.10.2. Market Assessment and Forecast, By Technology, 2017-2027 ($Million)
6.5. Asia-Pacific
6.5.1. Market Assessment and Forecast, By Country, 2017-2027 ($Million)
6.5.2. Market Assessment and Forecast, By Component, 2017-2027 ($Million)
6.5.3. Market Assessment and Forecast, By Technology, 2017-2027 ($Million)
6.5.4. Japan
6.5.4.1. Market Assessment and Forecast, By Component, 2017-2027 ($Million)
6.5.4.2. Market Assessment and Forecast, By Technology, 2017-2027 ($Million)
6.5.5. China
6.5.5.1. Market Assessment and Forecast, By Component, 2017-2027 ($Million)
6.5.5.2. Market Assessment and Forecast, By Technology, 2017-2027 ($Million)
6.5.6. Australia
6.5.6.1. Market Assessment and Forecast, By Component, 2017-2027 ($Million)
6.5.6.2. Market Assessment and Forecast, By Technology, 2017-2027 ($Million)
6.5.7. India
6.5.7.1. Market Assessment and Forecast, By Component, 2017-2027 ($Million)
6.5.7.2. Market Assessment and Forecast, By Technology, 2017-2027 ($Million)
6.5.8. South Korea
6.5.8.1. Market Assessment and Forecast, By Component, 2017-2027 ($Million)
6.5.8.2. Market Assessment and Forecast, By Technology, 2017-2027 ($Million)
6.5.9. Taiwan
6.5.9.1. Market Assessment and Forecast, By Component, 2017-2027 ($Million)
6.5.9.2. Market Assessment and Forecast, By Technology, 2017-2027 ($Million)
6.5.10. Rest of Asia-Pacific
6.5.10.1.1. Market Assessment and Forecast, By Component, 2017-2027 ($Million)
6.6. Rest of the World
6.6.1. Market Assessment and Forecast, By Country, 2017-2027 ($Million)
6.6.2. Market Assessment and Forecast, By Component, 2017-2027 ($Million)
6.6.3. Market Assessment and Forecast, By Technology, 2017-2027 ($Million)
6.6.4. Brazil
6.6.4.1. Market Assessment and Forecast, By Component, 2017-2027 ($Million)
6.6.4.2. Market Assessment and Forecast, By Technology, 2017-2027 ($Million)
6.6.5. Turkey
6.6.5.1. Market Assessment and Forecast, By Component, 2017-2027 ($Million)
6.6.5.2. Market Assessment and Forecast, By Technology, 2017-2027 ($Million)
6.6.6. Saudi Arabia
6.6.6.1. Market Assessment and Forecast, By Component, 2017-2027 ($Million)
6.6.6.2. Market Assessment and Forecast, By Technology, 2017-2027 ($Million)
6.6.7. South Africa
6.6.7.1. Market Assessment and Forecast, By Component, 2017-2027 ($Million)
6.6.7.2. Market Assessment and Forecast, By Technology, 2017-2027 ($Million)
6.6.8. United Arab Emirates
6.6.8.1. Market Assessment and Forecast, By Component, 2017-2027 ($Million)
6.6.8.2. Market Assessment and Forecast, By Technology, 2017-2027 ($Million)
6.6.9. Others
6.6.9.1. Market Assessment and Forecast, By Component, 2017-2027 ($Million)
6.6.9.2. Market Assessment and Forecast, By Technology, 2017-2027 ($Million)
7. Company Profiles
7.1. Capsule Tech Inc.
7.1.1. Business Overview
7.1.2. Component Portfolio
7.1.3. Key Financials
7.1.4. Strategic Developments
7.2. Cerner Corporation
7.2.1. Business Overview
7.2.2. Component Portfolio
7.2.3. Key Financials
7.2.4. Strategic Developments
7.3. Philips Healthcare
7.3.1. Business Overview
7.3.2. Component Portfolio
7.3.3. Key Financials
7.3.4. Strategic Developments
7.4. Digi International Inc.
7.4.1. Business Overview
7.4.2. Component Portfolio
7.4.3. Key Financials
7.4.4. Strategic Developments
7.5. Cisco Systems Inc.
7.5.1. Business Overview
7.5.2. Component Portfolio
7.5.3. Key Financials
7.5.4. Strategic Developments
7.6. Siemens Healthcare
7.6.1. Business Overview
7.6.2. Component Portfolio
7.6.3. Key Financials
7.6.4. Strategic Developments
7.7. Honeywell HomeMed LLC
7.7.1. Business Overview
7.7.2. Component Portfolio
7.7.3. Key Financials
7.7.4. Strategic Developments
7.8. Dräger Medical GmbH
7.8.1. Business Overview
7.8.2. Component Portfolio
7.8.3. Key Financials
7.8.4. Strategic Developments
7.9. eDevice Inc.
7.9.1. Business Overview
7.9.2. Component Portfolio
7.9.3. Key Financials
7.9.4. Strategic Developments
7.10. Lantronix Inc.
7.10.1. Business Overview
7.10.2. Component Portfolio
7.10.3. Key Financials
7.10.4. Strategic Developments
List of Tables
Table 1.Global Medical Device Connectivity Market, By Component ($Million), 2017-2025
Table 2 Medical Devices Connectivity Solution Market, By Region ($Million), 2017-2025
Table 3.Medical Device Connectivity Services Market, By Region ($Million), 2017-2025
Table 4 Global Medical Device Connectivity Market, By Technology ($Million), 2017-2025
Table 5.Wireless Technologies Market, By Region ($Million), 2017-2025
Table 6.Wired Technologies Market, By Region ($Million), 2017-2025
Table 7.Hybrid Technologies Market, By Region ($Million), 2017-2025
Table 8.Medical Device Connectivity Market, By Region, 2017-2025 ($Million)
Table 9.North America Medical Device Connectivity Market, By Country, 2017-2025 ($Million)
Table 10.North America Medical Device Connectivity Market, By Component, 2017-2025 ($Million)
Table 11.U.S. Medical Device Connectivity Market, By Component, 2017-2025 ($Million)
Table 12.U.S. Medical Device Connectivity Market, By Technology, 2017-2025 ($Million)
Table 13.Canada Medical Device Connectivity Market, By Component, 2017-2025 ($Million)
Table 14.Canada Medical Device Connectivity Market, By Technology, 2017-2025 ($Million)
Table 15.Mexico Medical Device Connectivity Market, By Component, 2017-2025 ($Million)
Table 16.Mexico Medical Device Connectivity Market, By Technology, 2017-2025 ($Million)
Table 17.Europe Medical Device Connectivity Market, By Country, 2017-2025 ($Million)
Table 18.Europe Medical Device Connectivity Market, By Component, 2017-2025 ($Million)
Table 19.Europe Medical Device Connectivity Market, By Technology, 2017-2025 ($Million)
Table 20.Germany Medical Device Connectivity Market, By Component, 2017-2025 ($Million)
Table 21 Germany Medical Device Connectivity Market, By Technology, 2017-2025 ($Million)
Table 22.France Medical Device Connectivity Market, By Component, 2017-2025 ($Million)
Table 23.France Medical Device Connectivity Market, By Technology, 2017-2025 ($Million)
Table 24.UK Medical Device Connectivity Market, By Component, 2017-2025 ($Million)
Table 25.UK Medical Device Connectivity Market, By Technology, 2017-2025 ($Million)
Table 26.Italy Medical Device Connectivity Market, By Component, 2017-2025 ($Million)
Table 27.Italy Medical Device Connectivity Market, By Technology, 2017-2025 ($Million)
Table 28.Spain Medical Device Connectivity Market, By Component, 2017-2025 ($Million)
Table 29.Spain Medical Device Connectivity Market, By Technology, 2017-2025 ($Million)
Table 30.Russia Medical Device Connectivity Market, By Component, 2017-2025 ($Million)
Table 31.Russia Medical Device Connectivity Market, By Technology, 2017-2025 ($Million)
Table 32.Rest of Europe Medical Device Connectivity Market, By Component, 2017-2025 ($Million)
Table 33.Rest of Europe Medical Device Connectivity Market, By Technology, 2017-2025 ($Million)
Table 34.Asia-Pacific Medical Device Connectivity Market, By Country, 2017-2025 ($Million)
Table 35.Asia-Pacific Medical Device Connectivity Market, By Component, 2017-2025 ($Million)
Table 36 Asia-Pacific Medical Device Connectivity Market, By Technology, 2017-2025 ($Million)
Table 37.Japan Medical Device Connectivity Market, By Component, 2017-2025 ($Million)
Table 38.Japan Medical Device Connectivity Market, By Technology, 2017-2025 ($Million)
Table 39.China Medical Device Connectivity Market, By Component, 2017-2025 ($Million)
Table 40.China Medical Device Connectivity Market, By Technology, 2017-2025 ($Million)
Table 41.Australia Medical Device Connectivity Market, By Component, 2017-2025 ($Million)
Table 42.Australia Medical Device Connectivity Market, By Technology, 2017-2025 ($Million)
Table 43.India Medical Device Connectivity Market, By Component, 2017-2025 ($Million)
Table 44.India Medical Device Connectivity Market, By Technology, 2017-2025 ($Million)
Table 45.South Korea Medical Device Connectivity Market, By Component, 2017-2025 ($Million)
Table 46.South Korea Medical Device Connectivity Market, By Technology, 2017-2025 ($Million)
Table 47.Taiwan Medical Device Connectivity Market, By Component, 2017-2025 ($Million)
Table 48.Taiwan Medical Device Connectivity Market, By Technology, 2017-2025 ($Million)
Table 49.Rest of Asia-Pacific Medical Device Connectivity Market, By Component, 2017-2025 ($Million)
Table 50.Rest of Asia-Pacific Medical Device Connectivity Market, By Technology, 2017-2025 ($Million)
Table 51.Rest of the World Medical Device Connectivity Market, By Country, 2017-2025 ($Million)
Table 52.Rest of the World Medical Device Connectivity Market, By Component, 2017-2025 ($Million)
Table 53.Rest of the World Medical Device Connectivity Market, By Technology, 2017-2025 ($Million)
Table 54.Brazil Medical Device Connectivity Market, By Component, 2017-2025 ($Million)
Table 55.Brazil Medical Device Connectivity Market, By Technology, 2017-2025 ($Million)
Table 56.Turkey Medical Device Connectivity Market, By Component, 2017-2025 ($Million)
Table 57.Turkey Medical Device Connectivity Market, By Technology, 2017-2025 ($Million)
Table 58.Saudi Arabia Medical Device Connectivity Market, By Component, 2017-2025 ($Million)
Table 59 Saudi Arabia Medical Device Connectivity Market, By Technology, 2017-2025 ($Million)
Table 60.South Africa Medical Device Connectivity Market, By Component, 2017-2025 ($Million)
Table 61 South Africa Medical Device Connectivity Market, By Technology, 2017-2025 ($Million)
Table 62.United Arab Emirates Medical Device Connectivity Market, By Component, 2017-2025 ($Million)
Table 63.United Arab Emirates Medical Device Connectivity Market, Technology, 2017-2025 ($Million)
Table 64.Others Medical Device Connectivity Market, By Component, 2017-2025 ($Million)
Table 65.Others Medical Device Connectivity Market, Technology, 2017-2025 ($Million)
Table 66.Capsule Tech Inc.: Key Strategic Developments, 2017-2017
Table 67.Cerner Corporation: Key Strategic Developments, 2017-2017
Table 68.Philips Healthcare: Key Strategic Developments, 2017-2017
Table 69.Digi International Inc.: Key Strategic Developments, 2017-2017
Table 70.Cisco Systems Inc.: Key Strategic Developments, 2017-2017
Table 71.Siemens Healthcare: Key Strategic Developments, 2017-2017
Table 72 Honeywell Home Med LLC: Key Strategic Developments, 2017-2017
Table 73.Dräger Medical GmbH: Key Strategic Developments, 2017-2017
Table 74.eDevice Inc.: Key Strategic Developments, 2017-2017
Table 75.Qualcomm Inc.: Key Strategic Developments, 2017-2017
List of Figures
Figure 1.Global Medical Device Connectivity Market Share, By Component, 2017 & 2025
Figure 2.Global Medical Device Connectivity Market Share, By Technology, 2017 & 2025
Figure 3.Medical Device Connectivity Market, By Region, 2017, ($Million)
Figure 4.Capsule Tech Inc.: Net Revenues, 2017-2017 ($Million)
Figure 5 Capsule Tech Inc.: Net Revenue Share, By Segment, 2017
Figure 6 Capsule Tech Inc.: Net Revenue Share, By Geography, 2017
Figure 7.Cerner Corporation: Net Revenues, 2017-2017 ($Million)
Figure 8.Cerner Corporation: Net Revenue Share, By Segment, 2017
Figure 9 Cerner Corporation: Net Revenue Share, By Geography, 2017
Figure 10.Philips Healthcare: Net Revenues, 2017-2017 ($Million)
Figure 11.Philips Healthcare: Net Revenue Share, By Segment, 2017
Figure 12.Philips Healthcare: Net Revenue Share, By Geography, 2017
Figure 13.Digi International Inc.: Net Revenues, 2017-2017 ($Million)
Figure 14 .Digi International Inc.: Net Revenue Share, By Segment, 2017
Figure 15.Digi International Inc.: Net Revenue Share, By Geography, 2017
Figure 16.Cisco Systems Inc.: Net Revenues, 2017-2017 ($Million)
Figure 17.Cisco Systems Inc.: Net Revenue Share, By Segment, 2017
Figure 18.Cisco Systems Inc.: Net Revenue Share, By Geography, 2017
Figure 19 Siemens Healthcare: Net Revenues, 2017-2017 ($Million)
Figure 20.Siemens Healthcare: Net Revenue Share, By Segment, 2017
Figure 21.Siemens Healthcare: Net Revenue Share, By Geography, 2017
Figure 22.Honeywell Home Med LLC: Net Revenues, 2017-2017 ($Million)
Figure 23.Honeywell Home Med LLC: Net Revenue Share, By Segment, 2017
Figure 24.Honeywell Home Med LLC: Net Revenue Share, By Geography, 2017
Figure 25.Dräger Medical GmbH: Net Revenues, 2017-2017 ($Million)
Figure 26.Dräger Medical GmbH: Net Revenue Share, By Segment, 2017
Figure 27.Dräger Medical GmbH: Net Revenue Share, By Geography, 2017
Figure 28.eDevice Inc.: Net Revenues, 2017-2017 ($Million)
Figure 29.eDevice Inc.: Net Revenue Share, By Segment, 2017
Figure30.eDevice Inc.: Net Revenue Share, By Geography, 2017
Figure 31.Qualcomm Inc.: Net Revenues, 2017-2017 ($Million)
Figure 32.Qualcomm Inc.: Net Revenue Share, By Segment, 2017
Figure 33.Qualcomm Inc.: Net Revenue Share, By Geography, 2017
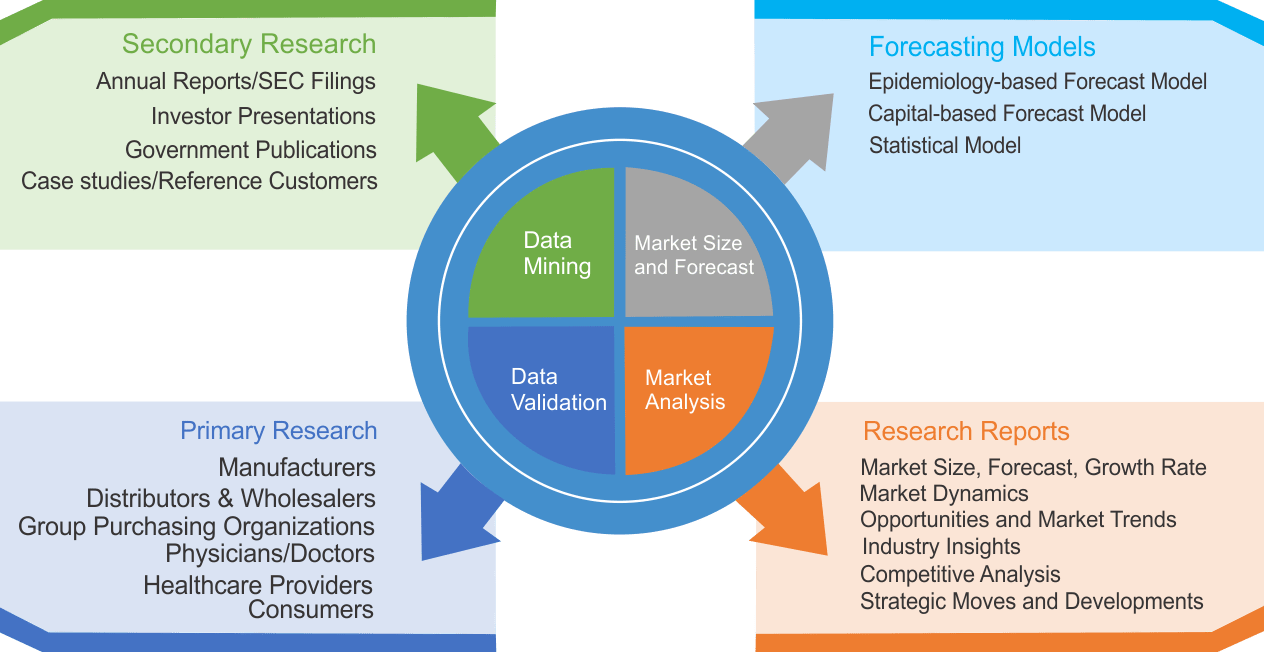
Research Methodology
We use both primary as well as secondary research for our market surveys, estimates and for developing forecast. Our research process commence by analyzing the problem which enable us to design the scope for our research study. Our research process is uniquely designed with enough flexibility to adjust according to changing nature of products and markets, while retaining core element to ensure reliability and accuracy in research findings. We understand both macro and micro-economic factors to evaluate and forecast different market segments.
Data Mining
Data is extensively collected through various secondary sources such as annual reports, investor presentations, SEC filings, and other corporate publications. We also refer trade magazines, technical journals, paid databases such as Factiva and Bloomberg, industry trade journals, scientific journals, and social media data to understand market dynamics and industry trends. Further, we also conduct primary research to understand market drivers, restraints, opportunities, challenges, and competitive scenario to build our analysis.
Data Collection Matrix
|
Data Collection Matrix |
Supply Side |
Demand Side |
|
Primary Data Sources |
|
|
|
Secondary Data Sources |
|
|
Market Modeling and Forecasting
We use epidemiology and capital equipment-based models to forecast market size of different segments at country and regional level.
- Epidemiology-based Forecasting Model: This method uses epidemiology data gathered through various publications and from physicians to estimate population of patients, flow of treatment of individual disease and therapies. The data collected through this method includes statics on incidence of disease, population suffering from disease, and treatment population. This method is used to understand:
- Number of patients for particular device or medical procedure and
- Repeated use of particular device depending on health and condition of patient
- Capital-based Forecasting Model: This method of forecasting is based on number of replacements, installed-based and new sales of capital equipment used in various healthcare and diagnostic centers. These three parameters are calculated and forecast is developed. Installation base is calculated as average number of units per facility; while sales for particular year is calculated from number of new and replace units. Secondary data is collected through various supply chain intermediaries and opinion leaders to arrive at installation and sales rate. These techniques help our analysts in validating market and developed market estimates and forecast.
We do forecast on basis of several parameters such as market drivers, market opportunities, industry trends government regulations, raw materials supply and trade dynamics to ensure relevance of forecast with market scenario. With increasing need to granulized information, we used bottom-up methodology for forecasting where we evaluate each regional segment differently and combined all forecast to develop final market forecast.
Data Validation
We believe primary research is a very important tool in analyzing and forecasting different markets. In order to make sure accuracy of our findings, our team conducts primary interviews at every stage of research to gain deep insights into current business environment and future trends and key developments in market. This includes use of various methods such as telephonic interviews, focus groups, face to face interviews and questionnaires to validate our research from all aspects. We validate our data through primary research from key industry leaders such as CEO, product managers, marketing managers, suppliers, distributors, and consumers are frequently interviewed. These interviews provide valuable insights which help us to have better market understanding besides validating our estimates and forecast.
Data Triangulation
Industry Analysis
|
Qualitative Data |
Quantitative Data (2017-2025) |
|
|